Advanced Guide
Install Edge Insights for Industrial from source code
By default, EII is installed via Edge Software Hub after downloading the EII package and running command ./edgesoftware install. This is the recommended installation when you want to preview EII stack.
If you are more interested in knowing different EII configurations that could be exercised or wish to customize the EII source code, please check the below sections:
Complete the following tasks to install EII manually.
Task 1: Install Prerequisites
The pre_requisites.sh script automates the installation and configuration of all the prerequisites required for building and running the EII stack. The prerequisites are as follows:
docker daemon
docker client
docker-compose
Python packages
The pre-requisites.sh script performs the following:
Checks if docker and docker-compose is installed in the system. If required, it uninstalls the older version and installs the correct version of docker and docker-compose.
Configures the proxy settings for the docker client and docker daemon to connect to the internet.
Configures the proxy settings system-wide (/etc/environment) and for docker. If a system is running behind a proxy, then the script prompts users to enter the proxy address to configure the proxy settings.
Configures proxy setting for /etc/apt/apt.conf to enable apt updates and installations.
Note
The recommended version of the docker-compose is
1.29.0. In versions older than 1.29.0, the video use case docker-compose.yml files and the device_cgroup_rules command may not work.To use versions older than docker-compose 1.29.0, in the
ia_video_ingestionandia_video_analyticsservices, comment out thedevice_cgroup_rulescommand.You can comment out the
device_cgroup_rulescommand in theia_video_ingestionandia_video_analyticsservices to use versions older than 1.29.0 of docker-compose. This can result in limited inference and device support. The following code sample shows how thedevice_cgroup_rulescommands are commented out:ia_video_ingestion: ... #device_cgroup_rules: #- 'c 189:* rmw' #- 'c 209:* rmw'
After modifying the docker-compose.yml file, refer to the Using the Builder script section. Before running the services using the docker-compose up command, rerun the builder.py script.
Run the Prerequisites Script
To run the prerequisite script, execute the following commands:
cd [WORKDIR]/IEdgeInsights/build
sudo -E ./pre_requisites.sh --help
  Usage :: sudo -E ./pre_requisites.sh [OPTION...]
  List of available options...
  --proxy         proxies, required when the gateway/edge node running EII (or any of EII profile) is connected behind proxy
  --help / -h         display this help and exit
Note
If the –proxy option is not provided, then script will run without proxy. Different use cases are as follows:
Runs without proxy
sudo -E ./pre_requisites.sh
Runs with proxy
sudo -E ./pre_requisites.sh --proxy="proxy.intel.com:891"
Optional Steps
If required, you can enable full security for production deployments. Ensure that the host machine and docker daemon are configured per the security recommendation. For more info, see build/docker_security_recommendation.md.
If required, you can enable log rotation for docker containers using any of the following methods:
Method 1
Set the logging driver as part of the docker daemon. This applies to all the docker containers by default.
Configure the json-file driver as the default logging driver. For more info, see JSON File logging driver. The sample json-driver configuration that can be copied to
/etc/docker/daemon.jsonis as follows:{ "log-driver": "json-file", "log-opts": { "max-size": "10m", "max-file": "5" } }
Run the following command to reload the docker daemon:
sudo systemctl daemon-reload
Run the following command to restart docker:
sudo systemctl restart docker
Method 2
Set logging driver as part of docker compose which is container specific. This overwrites the first option (i.e /etc/docker/daemon.json). The following example shows how to enable the logging driver only for the video_ingestion service:
  ia_video_ingestion:
    ...
    ...
    logging:
      driver: json-file
      options:
      max-size: 10m
max-file: 5
Task 2: Generate the Deployment and the Configuration Files
After downloading EII from the release package or git, run the commands mentioned in this section from the [WORKDIR]/IEdgeInsights/build/ directory.
Use the Builder Script
Note
:
To run the builder.py script, complete the prerequisite by entering the values for the following keys in build/.env:
ETCDROOT_PASSWORD – The value for this key is required, if you are using the ConfigMgrAgent and the EtcdUI services.
INFLUXDB_USERNAME, INFLUXDB_PASSWORD, MINIO_ACCESS_KEY, and MINIO_SECRETKEY – The values for these keys are required, if you are using the Data Store service. Special characters ``~:’+[/@^{%(-“*|,&<``}.=}!>;?#$)` are not allowed for the INFLUXDB_USERNAME and INFLUXDB_PASSWORD. The MINIO_ACCESS_KEY and the MINIO_SECRET_KEY length must be a minimum of 8 characters. If you enter wrong values or do not enter the values for the keys, the
builder.pyscript prompts for corrections or values.PKG_SRC - The value will be pre-populated with the local http server daemon which is brought up by the
./edgesoftware installcommand when installed from Edge Software Hub. By default, the EII core libs and other artifacts would be picked up from$HOME/edge_insights_industrial/Edge_Insights_for_Industrial_<version>/CoreLibsdirectory.
To use the builder.py script, run the following command:
python3 builder.py -h
usage: builder.py [-h] [-f YML_FILE] [-v VIDEO_PIPELINE_INSTANCES]
                    [-d OVERRIDE_DIRECTORY] [-s STANDALONE_MODE] [-r REMOTE_DEPLOYMENT_MODE]
optional arguments:
    -h, --help            show this help message and exit
    -f YML_FILE, --yml_file YML_FILE
                        Optional config file for list of services to include.
                        Eg: python3 builder.py -f video-streaming.yml (default: None)
    -v VIDEO_PIPELINE_INSTANCES, --video_pipeline_instances VIDEO_PIPELINE_INSTANCES
                        Optional number of video pipeline instances to be
                        created.
                        Eg: python3 builder.py -v 6 (default: 1)
    -d OVERRIDE_DIRECTORY, --override_directory OVERRIDE_DIRECTORY
                        Optional directory consisting of benchmarking
                        configs to be present in each app directory.
                        Eg: python3 builder.py -d benchmarking (default: None)
    -s STANDALONE_MODE, --standalone_mode STANDALONE_MODE
                        Standalone mode brings in changes to support independently
                        deployable services.
                        Eg: python3 builder.py -s True (default: False)
    -r REMOTE_DEPLOYMENT_MODE, --remote_deployment_mode REMOTE_DEPLOYMENT_MODE
                        Remote deployment mode brings in changes to support remote deployment
                        wherein builder does not auto-populate absolute paths of build
                        related variables in the generated docker-compose.yml
                        Eg: python3 builder.py -r True (default: False)
Generate Consolidated Files for All Applicable Services of Edge Insights for Industrial
Using the Builder tool, EII auto-generates the configuration files that are required for deploying the EII services on a single node or multiple nodes. The Builder tool auto-generates the consolidated files by getting the relevant files from the EII service directories that are required for different EII use-cases. The Builder tool parses the top-level directories excluding VideoIngestion and VideoAnalytics under the IEdgeInsights directory to generate the consolidated files. The VideoIngestion and VideoAnalytics are excluded since we will be using EdgeVideoAnalyticsMicroservice as the default primary analytics pipeline moving forward.
The following table shows the list of consolidated files and their details:
Table: Consolidated files
File Name |
Description |
|---|---|
docker-compose.yml |
Consolidated |
docker-compose.override.yml |
Consolidated |
eii_config.json |
Consolidated |
values.yaml |
Consolidated |
Template yaml files |
Files copied from the helm/templates directory of every app to the helm-eii/eii-deploy/templates directory that is required to deploy EII services via helm. |
Note
If you modify an individual EII app or service directory file, then ensure to rerun the
builder.pyscript before running the EII stack to regenerate the updated consolidated files.Manual editing of consolidated files is not recommended. Instead modify the respective files in the EII app or service directories and use the
builder.pyscript to generate the consolidated files.Enter the secret credentials in the
# Service credentialssection of the .env([WORK_DIR]/IEdgeInsights/build/.env) file if you are trying to run that EII app/service. If the required credentials are not present, thebuilder.pyscript would be prompting until all the required credentials are entered. Apply a file access mask to protect the .env([WORK_DIR]/IEdgeInsights/build/.env) file from being read by unauthorized users.The builder_config.json(
[WORK_DIR]/IEdgeInsights/build/builder_config.json) is the config file for thebuilder.pyscript and it contains the following keys:subscriber_list: This key contains a list of services that act as a subscriber to the stream being published.publisher_list: This key contains a list of services that publishes a stream of data.include_services: This key contains the mandatory list of services. These services should be included when the Builder is run without the-fflag.exclude_services: This key contains the mandatory list of services. These services should be excluded when the Builder is run without the-fflag.increment_rtsp_port: This is a Boolean key. It increments the port number for the RTSP stream pipelines.
To generate the consolidated files, run the following command:
python3 builder.py
Generate Consolidated Files for a Subset of Edge Insights for Industrial Services
Builder uses a yml file for configuration. The config yml file consists of a list of services to include. You can mention the service name as the path relative to IEdgeInsights or full path to the service in the config yml file.
To include only a certain number of services in the EII stack, you can add the -f or yml_file flag of builder.py. You can find the examples of yml files for different use cases as follows:
Azure(
[WORK_DIR]/IEdgeInsights/build/usecases/video-streaming-azure.yml)The following example shows running Builder with the -f flag:
python3 builder.py -f usecases/video-streaming.yml
Main Use Cases
Use case |
yaml file |
|---|---|
Video + Time Series |
build/usecases/video-timeseries.yml( |
Video |
build/usecases/video.yml( |
Time Series |
build/usecases/time-series.yml( |
Video Pipeline Sub Use Cases
Use case |
yaml file |
|---|---|
Video streaming |
build/usecases/video-streaming.yml( |
Video streaming with EVAM |
build/usecases/video-streaming-evam.yml( |
Video streaming and historical |
build/usecases/video-streaming-storage.yml( |
Video streaming with AzureBridge |
build/usecases/video-streaming-azure.yml( |
Video streaming and custom udfs |
build/usecases/video-streaming-all-udfs.yml( |
When you run the multi-instance config, a build/multi_instance directory is created in the build directory. Based on the number of video_pipeline_instances specified, that many directories of EdgeVideoAnalyticsMicroservice are created in the build/multi_instance directory.
The following section provides an example for running the Builder to generate the multi-instance boiler plate config for 3 streams of video-streaming use case.
Generate Multi-instance Config Using the Builder
If required, you can generate the multi-instance docker-compose.yml and config.json files using the Builder. You can use the -v or video_pipeline_instances flag of the Builder to generate boiler plate config for the multiple-stream use cases. The -v or video_pipeline_instances flag creates the multi-stream boiler plate config for the docker-compose.yml and eii_config.json files.
The following example shows running builder to generate the multi-instance boiler plate config for 3 streams of video-streaming use case:
python3 builder.py -v 3 -f usecases/video-streaming-evam.yml
Using the previous command for 3 instances, the build/multi_instance directory consists of the following directories
EdgeVideoAnalyticsMicroservice1
EdgeVideoAnalyticsMicroservice2
EdgeVideoAnalyticsMicroservice3
Initially each directory will have the default config.json and the docker-compose.yml files that are present within the EdgeVideoAnalyticsMicroservice/eii directory.
      ./build/multi_instance/
      |-- EdgeVideoAnalyticsMicroservice1
      |   |-- config.json
      |   `-- docker-compose.yml
      |-- EdgeVideoAnalyticsMicroservice2
      |   |-- config.json
      |   `-- docker-compose.yml
      |-- EdgeVideoAnalyticsMicroservice3
      |   |-- config.json
      |   `-- docker-compose.yml

You can edit the config of each of these streams within the ``build/multi_instance`` directory. To generate the consolidated ``docker compose`` and ``eii_config.json`` file, rerun the ``builder.py`` command.
Note
The multi-instance feature support of Builder works only for the video pipeline that is the usecases/video-streaming.yml and video-streaming-evam.yml use case and not with any other use case yml files like usecases/video-streaming-storage.yml and so on. Also, it doesn’t work for cases without the
-fswitch. The previous example will work with any positive number for-v. To learn more about using the multi-instance feature with the DiscoverHistory tool, see Multi-instance feature support for the builder script with the DiscoverHistory tool.If you are running the multi-instance config for the first time, it is recommended not to change the default
config.jsonfile and thedocker-compose.ymlfile in theEdgeVideoAnalyticsMicroservice/eiidirectory.If you are not running the multi-instance config for the first time, the existing
config.jsonanddocker-compose.ymlfiles in thebuild/multi_instancedirectory will be used to generate the consolidatedeii-config.jsonanddocker-composefiles.The
docker-compose.ymlfiles present within thebuild/multi_instancedirectory will have the following:the updated service_name, container_name, hostname, AppName, ports and secrets for that respective instance.
The
config.json filein thebuild/multi_instancedirectory will have the following:the updated Name, Type, Topics, Endpoint, PublisherAppname, ServerAppName, and AllowedClients for the interfaces section.
the incremented RTSP port number for the config section of that respective instance.
Ensure that all containers are down before running the multi-instance configuration. Run the
docker-compose downcommand before running thebuilder.pyscript for the multi-instance configuration.It is recommended to use either EdgeVideoAnalyticsMicroservice or VideoIngestion and VideoAnalytics and not both in the usecase yml files.
Generate Benchmarking Config Using Builder
To provide a different set of docker-compose.yml and config.json files than those found in each service directory, use the -d or the override directory flag. The -d flag instructs the program to look in the specified directory for the necessary set of files.
For example, to pick files from a directory named benchmarking, you can run the following command:
python3 builder.py -d benchmarking
Note
If you use the override directory feature of the builder then include all the 3 files mentioned in the previous example. If you do not include a file in the override directory, then the Builder will omit that service in the final config that is generated.
Adding the
AppNameof the subscriber container or client container in thesubscriber_list of builder_config.jsonallows you to spawn a single subscriber container or client container that is subscribing or receiving on multiple publishers or server containers.Multiple containers specified by the
-vflag is spawned for services that are not mentioned in thesubscriber_list. For example, if you run Builder with–v 3option andVisualizeris not added in thesubscriber_listofbuilder_config.jsonthen 3 instances of Visualizer are spawned. Each instance subscribes to 3 VideoAnalytics services. If Visualizer is added in thesubscriber_listofbuilder_config.json, a single Visualizer instance subscribing to 3 multiple VideoAnalytics is spawned.
Task 3: Build the Edge Insights for Industrial Stack
Note
For running the EII services in the IPC mode, ensure that the same user is mentioned in the publisher services and subscriber services.
If the publisher service is running as root, then the subscriber service should also run as root. For example, in the
docker-compose.ymlfile, if you have specifieduser: ${EII_UID}in the publisher service, then specify the sameuser: ${EII_UID}in the subscriber service. If you have not specified a user in the publisher service, then don’t specify the user in the subscriber service.If services need to be running in multiple nodes in the TCP mode of communication, msgbus subscribers, and clients of
AppNameare required to configure theEndPointinconfig.jsonwith theHOST_IPand thePORTunderSubscribers/PublishersorClients/Serversinterfaces section.Ensure that the port is being exposed in the
docker-compose.ymlof the respectiveAppName. For example, if the"EndPoint": <HOST_IP>:65012is configured in theconfig.jsonfile, then expose the port65012in thedocker-compose.ymlfile of theia_video_ingestionservice.
ia_edge_video_analytics_microservice:
  ...
  ports:
    - 65012:65012
Run all the following EII build and commands from the [WORKDIR]/IEdgeInsights/build/ directory.
EII supports the following use cases to run the services mentioned in the docker_compose.yml file. Refer to the Task 2 to generate the docker_compose.yml file for a specific use case. For more information and configuration, refer to the [WORK_DIR]/IEdgeInsights/README.md file.
Note
This is an optional step, if you want to use the EII pre-built container images and not build from source. For more details, refer to List of Distributed EII Services
Run the following command to build all EII services in the build/docker-compose.yml along with the base EII services.
docker-compose build
If any of the services fails during the build, then run the following command to build the service again:
docker-compose build --no-cache <service name>
Task 4: Deploy EII Services
Docker compose Deployment
This deployment primarily supports single node deployment
Independent building and deployment of services
All the EII services are aligning with the Microservice architecture principles of being Independently buildable and deployable.
Independently buildable and deployable feature is useful in allowing users to pick and choose only one service to build or deploy.
If one wants to run two or more microservices, we recommend to use the use-case driven approach as mentioned in Generate Consolidated Files for a Subset of Edge Insights for Industrial Services.
- The Independently buildable and deployable feature allows the users to build the individual service at the directory level and also allows the users to deploy the service in either of the two ways:
Without ConfigMgrAgent dependency:
- Deployment without ConfigMgrAgent dependency is only available in DEV mode where we make use of the ConfigMgr library config file APIs, by setting the `READ_CONFIG_FROM_FILE_ENV` value to `true` in the .env(`[WORK_DIR]/IEdgeInsights/build/.env`) file.
NOTE: We recommend the users to follow this simpler docker-compose deployment approach while adding in new services or debugging the existing service.
With ConfigMgrAgent dependency:
- Deployment with ConfigMgrAgent dependency is available in both DEV and PROD mode where we set the `READ_CONFIG_FROM_FILE_ENV` value to `false` in the .env(`[WORK_DIR]/IEdgeInsights/build/.env`) file and make use of the ConfigMgrAgent(`[WORK_DIR]/IEdgeInsights/ConfigMgrAgent/docker-compose.yml`) and the builder.py(`[WORK_DIR]/IEdgeInsights/build/builder.py`) to deploy the service.
NOTE: We recommend the users to follow the earlier use-case driven approach mentioned in Generate Consolidated Files for a Subset of Edge Insights for Industrial Services, when they want to deploy more than one microservice.
Run Edge Insights for Industrial Services
Note
Ensure to run docker-compose down from the build([WORK_DIR]/IEdgeInsights/build) directory before you bring up the EII stack. This helps to remove running containers and avoid any sync issues where other services have come up before ia_configmgr_agent container has completed the provisioning step.
If the images tagged with the EII_VERSION label, as in the build/.env([WORK_DIR]/IEdgeInsights/build/.env) do not exist locally in the system but are available in the Docker Hub, then the images will be pulled during the docker-compose upcommand.
Provision Edge Insights for Industrial
The EII provisioning is taken care by the ia_configmgr_agent service that gets launched as part of the EII stack. For more details on the ConfigMgr Agent component, refer to the Readme.
Start Edge Insights for Industrial in Dev Mode
Note
By default, EII is provisioned in the secure mode.
It is recommended not to use EII in the Dev mode in a production environment. In the Dev mode, all security features, communication to and from the etcd server over the gRPC protocol, and the communication between the EII services/apps over the ZMQ protocol are disabled.
By default, the EII empty certificates folder Certificates(
[WORK_DIR]/IEdgeInsights/Certificates]) will be created in the DEV mode. This happens because of docker bind mounts but it is not an issue.The
EII_INSTALL_PATHin the build/.env([WORK_DIR]/IEdgeInsights/build/.env) remains protected both in the DEV and the PROD mode with the Linux group permissions.
Starting EII in the Dev mode eases the development phase for System Integrators (SI). In the Dev mode, all components communicate over non-encrypted channels. To enable the Dev mode, set the environment variable DEV_MODE to true in the [WORK_DIR]/IEdgeInsights/build/.env file. The default value of this variable is false.
To provision EII in the developer mode, complete the following steps:
Update
DEV_MODE=truein[WORK_DIR]/IEdgeInsights/build/.env.Rerun the
build/builder.pyto regenerate the consolidated files.
Start Edge Insights for Industrial in Profiling Mode
The Profiling mode is used for collecting the performance statistics in EII. In this mode, each EII component makes a record of the time needed for processing any single frame. These statistics are collected in the visualizer where System Integrators (SIs) can see the end-to-end processing time and the end-to-end average time for individual frames.
To enable the Profiling mode, in the [WORK_DIR]/IEdgeInsights/build/.env file, set the environment variable PROFILING to true.
Run Provisioning Service and Rest of the Edge Insights for Industrial Stack Services
Note
After the EII services starts, you can use the Etcd UI web interface to make the changes to the EII service configs or interfaces keys.
in the DEV and the PROD mode, if the EII services come before the Config Manager Agent service, then they would be in the restarting mode with error logs such as
Config Manager initialization failed.... This is due to the single step deployment to support the independent deployment of the EII services, where services can come in a random order and start working when the dependent service comes up later. In one to two minutes, all the EII services should show the status asrunningwhenConfig Manager Agentservice starts up.To build the common libs and generate needed artifacts from source and use it for building the EII services, refer common/README.md.
docker-compose up -d
On successful run, you can open the web visualizer in the Chrome browser at https://<HOST_IP>:3000. The HOST_IP corresponds to the IP of the system on which the visualization service is running.
Kubernetes Deployment
This deployment primarily supports multi-node cluster deployment
With K8s Orchestrator
You can use any of the following options to deploy EII on a multi-node cluster:
[
Recommended] For deploying through ansible playbook on multiple nodes automatically, refer to build/ansible/README.mdFor information about using helm charts to provision the node and deploy the EII services, refer to build/helm-eii/README.md
Azure Manifest Deployment
For more details refer to Azure Deployment
List of EII Services
Based on requirement, you can include or exclude the following EII services in the [WORKDIR]/IEdgeInsights/build/docker-compose.yml file:
Provisioning Service - This service is a prerequisite and cannot be excluded from the
docker-compose.ymlfile.Common EII services for Video and Timeseries Analytics pipeline services
OpcuaExport - Optional service to read from the VideoAnalytics container to publish data to opcua clients.
RestDataExport - Optional service to read the metadata and the image blob from the from the Data store service.
Video Analytics pipeline services
FactoryControlApp - Optional service to read from the VideoAnalytics container if you want to control the light based on the defective or non-defective data
Timeseries Analytics pipeline services
Adding New Services to EII Stack
This section provides information about adding a service, subscribing to the EdgeVideoAnalyticsMicroservice([WORK_DIR]/IEdgeInsights/EdgeVideoAnalyticsMicroservice), and publishing it on a new port.
Add a service to the EII stack as a new directory in the IEdgeInsights([WORK_DIR]/IEdgeInsights/) directory. The Builder registers and runs any service present in its own directory in the IEdgeInsights([WORK_DIR]/IEdgeInsights/) directory. The directory should contain the following:
A
docker-compose.ymlfile to deploy the service as a docker container. TheAppNameis present in theenvironmentsection in thedocker-compose.ymlfile. Before adding theAppNameto the mainbuild/eii_config.json, it is appended to theconfigandinterfacesas/AppName/configand/AppName/interfaces.A
config.jsonfile that contains the required config for the service to run after it is deployed. Theconfig.jsonconsists of the following:A
configsection, which includes the configuration-related parameters that are required to run the application.An
interfacessection, which includes the configuration of how the service interacts with other services of the EII stack.
Note
For more information on adding new EII services, refer to the EII sample apps at Samples written in C++, Python, and Golang using the EII core libraries.
The following example shows:
How to write the config.json for any new service
Subscribe to EdgeVideoAnalyticsMicroservice
Publish on a new port
{
    "config": {
        "paramOne": "Value",
        "paramTwo": [1, 2, 3],
        "paramThree": 4000,
        "paramFour": true
    },
    "interfaces": {
        "Subscribers": [
            {
                "Name": "default",
                "Type": "zmq_tcp",
                "EndPoint": "127.0.0.1:65114",
                "PublisherAppName": "EdgeVideoAnalyticsMicroservice",
                "Topics": [
                    "edge_video_analytics_results"
                ]
            }
        ],
        "Publishers": [
            {
                "Name": "default",
                "Type": "zmq_tcp",
                "EndPoint": "127.0.0.1:65113",
                "Topics": [
                    "publish_stream"
                ],
                "AllowedClients": [
                    "ClientOne",
                    "ClientTwo",
                    "ClientThree"
                ]
            }
        ]
    }
}
The config.json file consists of the following key and values:
value of the
configkey is the config required by the service to run.value of the
interfaceskey is the config required by the service to interact with other services of EII stack over the Message Bus.the
Subscribersvalue in theinterfacessection denotes that this service should act as a subscriber to the stream being published by the value specified byPublisherAppNameon the endpoint mentioned in value specified byEndPointon topics specified in value ofTopickey.the
Publishersvalue in theinterfacessection denotes that this service publishes a stream of data after obtaining and processing it fromEdgeVideoAnalyticsMicroservice. The stream is published on the endpoint mentioned in value ofEndPointkey on topics mentioned in the value ofTopicskey.the services mentioned in the value of
AllowedClientsare the only clients that can subscribe to the published stream, if it is published securely over the Message Bus.
Note
Like the interface keys, EII services can also have
ServersandClientsinterface keys. For more information, refer to config.json([WORK_DIR]/IEdgeInsights/VideoIngestion/config.json) of theVideoIngestionservice and config.json([WORK_DIR]/IEdgeInsights/tools/SWTriggerUtility/config.json) of the SWTriggerUtility tool.For more information on the
interfaceskey responsible for the Message Bus endpoint configuration, refer to common/libs/ConfigMgr/README.md#interfaces.For the etcd secrets configuration, in the new EII service or app
docker-compose.ymlfile, add the following volume mounts with the rightAppNameenv value:
...
 volumes:
   - ./Certificates/[AppName]:/run/secrets/[AppName]:ro
   - ./Certificates/rootca/cacert.pem:/run/secrets/rootca/cacert.pem:ro
DataStore Microservice
Data Store microservice provides on-prem persistent metadata stored in the InfluxDB* platform and Binary Large Object (BLOB) data stored in the MinIO* system. These storage solutions are of NoSQL nature and support video analytics and time-series analytics data store operations at the edge.
The microservice supports the following data storage types:
BLOBs: these are files in containers as BLOBs of data.
NoSQL data.
The DataStore microservice consists of the following databases:
DataStore Configuration
The configurations for Datastore Service are added in etcd. The configuration details are available in the docker-compose file, under AppName in the environment section of the app’s service definition.
For the scenario, when the AppName is Datastore, the following example shows how the app’s config will look for /DataStore/config key in etcd:
"dbs": {
    "influxdb": {
        "topics": ["*"],
        "server": "datastore_influxdb_server",
        "retention": "1h30m5s",
        "dbname": "datain",
        "ssl": "True",
        "verifySsl": "False",
        "port": "8086",
        "pubWorkers": "5",
        "subWorkers": "5",
        "ignoreKeys": [ "defects" ],
        "tagKeys": []
    },
    "miniodb": {
        "topics": ["camera1_stream_results"],
        "server": "datastore_minio_server",
        "retentionTime": "1h",
        "retentionPollInterval": "60s",
        "ssl": "false"
    }
}
By default, both the DBs will be enabled. If you want to disable any of the above DBs, remove the corresponding key and its value from the config.
For Example, if you are not using MinIO DB, you can disable the same and modify the config as below:
"dbs": {
    "influxdb": {
        "topics": ["*"],
        "server": "datastore_influxdb_server",
        "retention": "1h30m5s",
        "dbname": "datain",
        "ssl": "True",
        "verifySsl": "False",
        "port": "8086",
        "pubWorkers": "5",
        "subWorkers": "5",
        "ignoreKeys": [ "defects" ],
        "tagKeys": []
    }
}
The following are the details of the keys in the above config:
The
topicskey determines which messages are to be processed by the corresponding DB microservice. Only the messages with a topic listed intopicskey are processed by the individual module. Iftopicscontain\*, then all the messages are processed.The
serverkey specifies the name of the server interface on which, the corresponding module server is active
InfluxDB
- DataStore will subscribe to the InfluxDB and start the zmq
publisher, zmq subscriber threads, and zmq request reply thread based on PubTopics, SubTopics and QueryTopics configuration.
- zmq subscriber thread connects to the PUB socket of zmq bus on which
the data is published by VideoAnalytics and push it to the InfluxDB.
- zmq publisher thread will publish the point data ingested by the telegraf
and the classifier result coming out of the point data analytics.
- zmq reply request service will receive the InfluxDB select query and
response with the historical data.
For nested json data, by default, DataStore will flatten the nested json and push the flat data to InfluxDB to avoid the flattening of any particular nested key mention the tag key in the config.json(``[WORK_DIR]/IEdgeInsights/DataStore/config.json``) file. Currently the defects key is ignored from flattening. Every key to be ignored has to be in a new line.
For example,
ignore_keys = [ "Key1", "Key2", "Key3" ]
By default, all the keys in the data schema will be pushed to InfluxDB as fields. If tags are present in data schema, it can be mentioned in the config.json(``[WORK_DIR]/IEdgeInsights/DataStore/config.json``) file then the data pushed to InfluxDB, will have fields and tags both. At present, no tags are visible in the data scheme and tag_keys are kept blank in the config file.
For Example,
tag_keys = [ "Tag1", "Tag2" ]
MinIO
The MinIO DB submodule primarily subscribes to the stream that comes out of the VideoAnalytics app via MessageBus and stores the frame into minio for historical analysis.
The high-level logical flow of MinIO DB is as follows:
The messagebus subscriber in MinIO DB will subscribe to the VideoAnalytics published classified result (metadata, frame) on the messagebus. The img_handle is extracted out of the metadata and is used as the key and the frame is stored as a value for that key in minio persistent storage.
For a historical analysis of the stored classified images, MinIO DB starts the messagebus server which provides the read and store interfaces. The payload format is as follows for:
Store Interface:
       Request: map ("command": "store","img_handle":"$handle_name"),[]byte($binaryImage)
       Response : map ("img_handle":"$handle_name", "error":"$error_msg") ("error" is optional and available only in case of error in execution.)

b. Read Interface:
Request : map ("command": "read", "img_handle":"$handle_name")
Response : map ("img_handle":"$handle_name", "error":"$error_msg"),[]byte($binaryImage) ("error" is optional and available only in case of error in execution. And $binaryImage is available only in case of successful read)
Detailed Description on Each Keys
accessKey |Username required to access Minio DB |Any suitable value|Required|
secretKey|Password required to access Minio DB| Any suitable value| Required
retentionTime|The retention parameter specifies the retention policy to apply for the images stored in Minio DB. In case of infinite retention time, set it to “-1”| Suitable duration string value as mentioned at https://golang.org/pkg/time/#ParseDuration.| Required
retentionPollInterval|Used to set the time interval for checking images for expiration. Expired images will become candidates for deletion and no longer retained. In case of infinite retention time, this attribute will be ignored| Suitable duration string value as mentioned at https://golang.org/pkg/time/#ParseDuration| Required
ssl|If “true”, establishes a secure connection with Minio DB else a non-secure connection| “true” or “false”| Required
Steps to Independently Build and Deploy DataStore Microservice
Note
For running two or more microservices, you are recommended to try the use case-driven approach for building and deploying as described at Generate Consolidated Files for a Subset of Edge Insights for Industrial Services
Steps to Independently Build the DataStore Microservice
Note
When switching between independent deployment of the service with and without config manager agent service dependency, one would run into issues with docker-compose build w.r.t Certificates folder existence. As a workaround, run the command sudo rm -rf Certificates to proceed with the docker-compose build.
To independently build the DataStore microservice, complete the following steps:
The downloaded source code should have a directory named DataStore:
cd IEdgeInsights/DataStore
Copy the IEdgeInsights/build/.env file using the following command in the current folder
cp ../build/.env .
NOTE: Update the HOST_IP and ETCD_HOST variables in the .env file with your system IP.
# Source the .env using the following command:
set -a && source .env && set +a
Independently build
docker-compose build
Steps to Independently Deploy DataStore Microservice
You can deploy the DataStore service in either of the following two ways:
Deploy DataStore Service without Config Manager Agent Dependency
Run the following commands to deploy DataStore service without Config Manager Agent dependency:
# Enter the DataStore directory
cd IEdgeInsights/DataStore
Copy the IEdgeInsights/build/.env file using the following command in the current folder, if not already present.
cp ../build/.env .Note: Ensure that
docker psis clean anddocker network lsmust not have EII bridge network.
Update .env file for the following:
1. HOST_IP and ETCD_HOST variables with your system IP.
2. `READ_CONFIG_FROM_FILE_ENV` value to `true` and `DEV_MODE` value to `true`.
3. Set the values for 'INFLUXDB_USERNAME', 'INFLUXDB_PASSWORD', 'MINIO_ACCESS_KEY', 'MINIO_SECRET_KEY' which are InfluxDB and Minio DB credentials

Source the .env using the following command:
set -a && source .env && set +a

Set Write Permission for Data Dir(Volume Mount paths): This is required for Database Server to have write permission to the respective storage paths.
sudo mkdir -p $EII_INSTALL_PATH/data
sudo chmod 777 $EII_INSTALL_PATH/data
sudo chown -R eiiuser:eiiuser $EII_INSTALL_PATH/data
# Run the service
docker-compose -f docker-compose.yml -f docker-compose-dev.override.yml up -d
Note
Datastore container restarts automatically when its config is modified in the config.json file.
If you update the config.json file by using vi or vim editor, it is required to append the set backupcopy=yes in ~/.vimrc so that the changes done on the host machine config.json are reflected inside the container mount point.
Deploy DataStore Service with Config Manager Agent Dependency
Run the following commands to deploy the DataStore Service with Config Manager Agent dependency:
Note
Ensure that the Config Manager Agent image present in the system. If not, build the Config Manager Agent locally when independently deploying the service with Config Manager Agent dependency.
# Enter the DataStore directory
cd IEdgeInsights/DataStore
Copy the IEdgeInsights/build/.env file using the following command in the current folder, if not already present.
cp ../build/.env .Note: Ensure that
docker psis clean anddocker network lsdoesn’t have EII bridge networks.
Update .env file for following:
1. HOST_IP and ETCD_HOST variables with your system IP.
2. `READ_CONFIG_FROM_FILE_ENV` value is set to `false`.
3. Set the values for 'INFLUXDB_USERNAME', 'INFLUXDB_PASSWORD', 'MINIO_ACCESS_KEY', 'MINIO_SECRET_KEY' which are InfluxDB and Minio DB credentials
Copy the docker-compose.yml from IEdgeInsights/ConfigMgrAgent as docker-compose.override.yml in IEdgeInsights/DataStore.
cp ../ConfigMgrAgent/docker-compose.yml docker-compose.override.yml
Copy the builder.py with standalone mode changes from IEdgeInsights/build directory
cp ../build/builder.py .Run the builder.py in standalone mode, this will generate eii_config.json and update docker-compose.override.yml
python3 builder.py -s trueBuilding the service (This step is optional for building the service if not already done in the
Independently buildablestep above)docker-compose buildFor running the service in PROD mode, run the below command:
NOTE: Make sure to update
DEV_MODEtofalsein .env while running in PROD mode and source the .env using the commandset -a && source .env && set +a.docker-compose up -dFor running the service in DEV mode, run the below command:
NOTE: Make sure to update
DEV_MODEtotruein .env while running in DEV mode and source the .env using the commandset -a && source .env && set +a.docker-compose -f docker-compose.yml -f docker-compose-dev.override.yml -f docker-compose.override.yml up -d
Video Pipeline Analytics
Edge Video Analytics Microservice for Edge insights for Industrial (EII) Overview
The Edge Video Analytics Microservice (EVAM) combines video ingestion and analytics capabilities provided by Edge insights for Industrial (EII) visual ingestion and analytics modules. This directory provides the Intel® Deep Learning Streamer (Intel® DL Streamer) pipelines to perform object detection on an input URI source and send the ingested frames and inference results using the MsgBus Publisher. It also provides a Docker compose and config file to use EVAM with the Edge insights software stack.
Prerequisites
As a prerequisite for using EVAM in EII mode, download EII 4.0.0 package from EII 4.0.0 package from ESH and complete the following steps:
EII when downloaded from ESH would be available at the installed location
cd [EII installed location]/IEdgeInsights
Complete the prerequisite for provisioning the EII stack by referring to the README.md.
Download the required model files to be used for the pipeline mentioned in the config(
[WORK_DIR]/IEdgeInsights/EdgeVideoAnalyticsMicroservice/eii/config.json) file by completing step 2 to step 4 as mentioned in the README. ..Note: The model files are large and hence they are not part of the repo.
Run the following commands to set the environment, build the
ia_configmgr_agentcontainer and copy models to the required directory:Go to the
builddirectory:
cd [WORK_DIR]/IEdgeInsights/build
Configure visualizer app’s subscriber interfaces. Example: Add the following
interfaceskey value inVisualizer/multimodal-data-visualization-streaming/eii/config.jsonandVisualizer/multimodal-data-visualization/eii/config.jsonfiles.
"interfaces": {
   "Subscribers": [
      {
          "Name": "default",
          "Type": "zmq_tcp",
          "zmq_recv_hwm": 50,
          "EndPoint": "ia_edge_video_analytics_microservice:65114",
          "PublisherAppName": "EdgeVideoAnalyticsMicroservice",
          "Topics": [
              "edge_video_analytics_results"
          ]
      }
  ]
}
Execute the builder.py script
python3 builder.py -f usecases/video-streaming-evam.yml
Create some necessary items for the service
sudo mkdir -p /opt/intel/eii/models/
Copy the downloaded model files to /opt/intel/eii
sudo cp -r [downloaded_model_directory]/models /opt/intel/eii/
Run the Containers
To pull the prebuilt EII container images and EVAM from Docker Hub and run the containers in the detached mode, run the following command:
# Launch the EII stack
docker-compose up -d
Note
The prebuilt container image for the Edge Video Analytics Microservice gets downloaded when you run the
docker-compose up -dcommand, if the image is not already present on the host system.The ETCD watch capability is enabled for Edge Video Analytics Microservice and it will restart when config/interface changes are done via the EtcdUI interface. While changing the pipeline/pipeline_version, make sure they are volume mounted to the container.
Configuration
See the edge-video-analytics-microservice/eii/config.json([WORK_DIR]/IEdgeInsights/EdgeVideoAnalyticsMicroservice/eii/config.json) file for the configuration of EVAM. The default configuration will start the
object_detection demo for EII.
The config file is divided into two sections as follows:
Config
The following table describes the attributes that are supported in the config section.
Parameter |
Description |
|---|---|
|
Type of EII certs to be created. This should be |
|
Source of the frames. This should be |
|
The parameters for the source element. The provided object is the typical parameters. |
|
The name of the DL Streamer pipeline to use. This should correspond to a directory in the pipelines directory). |
|
The version of the pipeline to use. This typically is a subdirectory of a pipeline in the pipelines directory. |
|
The Boolean flag for whether to publish the metadata and the analyzed frame, or just the metadata. |
|
This provides the parameters for the model used for inference. |
Interfaces
Currently in the EII mode, EVAM supports launching a single pipeline and publishing on a single topic. This implies that in the configuration file (“config.json”), the single JSON object in the Publisher list is where the configuration resides for the published data. For more details on the structure, refer to the EII documentation.
EVAM also supports subscribing and publishing messages or frames using the Message Bus. The endpoint details for the EII service you need to subscribe from are to be provided in the Subscribers section in the config([WORK_DIR]/IEdgeInsights/EdgeVideoAnalyticsMicroservice/eii/config.json) file and the endpoints where you need to publish to are to be provided in Publishers section in the config([WORK_DIR]/IEdgeInsights/EdgeVideoAnalyticsMicroservice/eii/config.json) file.
To enable injection of frames into the GStreamer pipeline obtained from Message Bus, ensure to make the following changes:
The source parameter in the config(
[WORK_DIR]/IEdgeInsights/EdgeVideoAnalyticsMicroservice/eii/config.json) file is set to msgbus. Refer to the following code snippet:"config": { "source": "msgbus" }
The template of respective pipeline is set to appsrc as source instead of uridecodebin. Refer to the following code snippet:
{
    "type": "GStreamer",
    "template": ["appsrc name=source",
                 " ! rawvideoparse",
                 " ! appsink name=destination"
                ]
}
Steps to Independently Build and Deploy EdgeVideoAnalyticsMicroservice Service
Note
For running two or more microservices, we recommend users to try the use case-driven approach for building and deploying as mentioned in Generate Consolidated Files for a Subset of Edge Insights for Industrial Services
Steps to Independently Build EdgeVideoAnalyticsMicroservice Service
Note
When switching between independent deployment of the service with and without config manager agent service dependency, one would run into issues with docker-compose build w.r.t Certificates folder existence. As a workaround, please run command sudo rm -rf Certificates to proceed with docker-compose build.
To independently build EdgeVideoAnalyticsMicroservice service, complete the following steps:
The downloaded source code should have a directory named EdgeVideoAnalyticsMicroservice/eii:
cd IEdgeInsights/EdgeVideoAnalyticsMicroservice/eii
Copy the IEdgeInsights/build/.env file using the following command in the current folder
cp ../../build/.env .
NOTE: Update the HOST_IP and ETCD_HOST variables in the .env file with your system IP.
# Source the .env using the following command:
set -a && source .env && set +a
Independently build
docker-compose build
Steps to Independently Deploy EdgeVideoAnalyticsMicroservice Service
You can deploy the EdgeVideoAnalyticsMicroservice service in any of the following two ways:
Deploy EdgeVideoAnalyticsMicroservice Service without Config Manager Agent Dependency
Run the following commands to deploy EdgeVideoAnalyticsMicroservice service without Config Manager Agent dependency:
# Enter the eii directory
cd IEdgeInsights/EdgeVideoAnalyticsMicroservice/eii
Copy the IEdgeInsights/build/.env file using the following command in the current folder, if not already present.
cp ../../build/.env .Note: Ensure that
docker psis clean anddocker network lsmust not have EII bridge network.
Update .env file for the following:
1. HOST_IP and ETCD_HOST variables with your system IP.
2. `READ_CONFIG_FROM_FILE_ENV` value to `true` and `DEV_MODE` value to `true`.

Source the .env using the following command:
set -a && source .env && set +a
# Run the service
docker-compose -f docker-compose.yml -f docker-compose-dev.override.yml up -d
Deploy EdgeVideoAnalyticsMicroservice Service with Config Manager Agent Dependency
Run the following commands to deploy EdgeVideoAnalyticsMicroservice service with Config Manager Agent dependency:
Note: Ensure that the Config Manager Agent image present in the system. If not, build the Config Manager Agent locally when independently deploying the service with Config Manager Agent dependency.
# Enter the eii directory
cd IEdgeInsights/EdgeVideoAnalyticsMicroservice/eii
Copy the IEdgeInsights/build/.env file using the following command in the current folder, if not already present.
cp ../../build/.env .Note: Ensure that
docker psis clean anddocker network lsdoesn’t have EII bridge networks.
Update .env file for following:
1. HOST_IP and ETCD_HOST variables with your system IP.
2. `READ_CONFIG_FROM_FILE_ENV` value is set to `false`.
Copy the docker-compose.yml from IEdgeInsights/ConfigMgrAgent as docker-compose.override.yml
cp ../../ConfigMgrAgent/docker-compose.yml docker-compose.override.yml
Copy the builder.py with standalone mode changes from IEdgeInsights/build directory
cp ../../build/builder.py .Run the builder.py in standalone mode, this will generate eii_config.json and update docker-compose.override.yml
python3 builder.py -s trueBuilding the service (This step is optional for building the service if not already done in the
Independently buildablestep above)docker-compose buildRunning the service
Note: Source the .env using the command
set -a && source .env && set +abefore running the below command.docker-compose -f docker-compose.yml -f docker-compose-dev.override.yml -f docker-compose.override.yml up -d
Camera Configurations
You need to make changes to the config.json([WORK_DIR]/IEdgeInsights/EdgeVideoAnalyticsMicroservice/eii/config.json) and the templates section of the pipeline.json([WORK_DIR]/IEdgeInsights/EdgeVideoAnalyticsMicroservice/eii/pipelines/cameras/camera_source/pipeline.json) files while configuring cameras.
By default the pipeline.json([WORK_DIR]/IEdgeInsights/EdgeVideoAnalyticsMicroservice/eii/pipelines/cameras/camera_source/pipeline.json) file has the RTSP camera configurations.
The camera configurations for the Edge Video Analytics Microservice module are as follows:
Note
source_parameters values in config.json([WORK_DIR]/IEdgeInsights/EdgeVideoAnalyticsMicroservice/eii/config.json) can get overriden if the required gstreamer source plugin in specified in template section of pipeline.json([WORK_DIR]/IEdgeInsights/EdgeVideoAnalyticsMicroservice/eii/pipelines/cameras/camera_source/pipeline.json) files.
GenICam GigE or USB3 Cameras
Note
As Matrix Vision SDK([WORK_DIR]/IEdgeInsights/EdgeVideoAnalyticsMicroservice/eii/mvGenTL_Acquire-x86_64_ABI2-2.44.1.tgz) is being used with evaluation license, one would start seeing watermark after 200 ingested images when using a non Matrix Vision camera. One has to purchase the Matrix Vision license to remove this watermark or use a Matrix Vision camera or integrate the respective camera SDK(Eg: basler camera SDK for basler cameras).
For more information or configuration details for the GenICam GigE or the USB3 camera support, refer to the GenICam GigE/USB3.0 Camera Support.
Prerequisites for Working with the GenICam Compliant Cameras
The following are the prerequisites for working with the GeniCam compliant cameras.
Note
For other cameras such as RSTP, and USB (v4l2 driver compliant) revert the changes that are mentioned in this section. Refer to the following snip of the
ia_edge_video_analytics_microserviceservice, to add the required changes in the docker-compose.yml([WORK_DIR]/IEdgeInsights/EdgeVideoAnalyticsMicroservice/eii/docker-compose.yml) file. After making the changes, before you build and run the services, ensure to run the builder.py([WORK_DIR]/IEdgeInsights/build/builder.py).
For GenICam GigE cameras:
Update the ETCD_HOST key with the current system’s IP in the .env([WORK_DIR]/IEdgeInsights/build/.env) file.
ETCD_HOST=<HOST_IP>
You need to add root user and network_mode: host in the docker-compose.yml([WORK_DIR]/IEdgeInsights/EdgeVideoAnalyticsMicroservice/eii/docker-compose.yml) file and comment the sections networks and ports.
Make the following changes in the docker-compose.yml([WORK_DIR]/IEdgeInsights/EdgeVideoAnalyticsMicroservice/eii/docker-compose.yml) file.
ia_edge_video_analytics_microservice:
  # Add root user
  user: root
  # Add network mode host
  network_mode: host
  # Please make sure that the above commands are not added under the environment section and also take care about the indentations in the compose file.
  ...
  environment:
  ...
    # Add HOST_IP to no_proxy and ETCD_HOST
    no_proxy: "<eii_no_proxy>,${RTSP_CAMERA_IP},<HOST_IP>"
    ETCD_HOST: ${ETCD_HOST}
  ...
  # Comment networks section will throw an error when network mode host is used.
  # networks:
    # - eii
  # Comment ports section as following
  # ports:
  #   - '65114:65114'
Configure visualizer app’s subscriber interfaces in the Multimodal Data Visualization Streaming’s config.json file as follows.
"interfaces": {
   "Subscribers": [
      {
      "Name": "default",
      "Type": "zmq_tcp",
      "EndPoint": "<HOST_IP>:65114",
      "PublisherAppName": "EdgeVideoAnalyticsMicroservice",
      "Topics": [
          "edge_video_analytics_results"
      ]
      }
   ]
}
Note
Add <HOST_IP> to the no_proxy environment variable in the Multimodal Data Visualization Streaming visualizer’s docker-compose.yml file.
For GenIcam USB3.0 cameras:
Make the following changes to add root user in the docker-compose.yml([WORK_DIR]/IEdgeInsights/EdgeVideoAnalyticsMicroservice/eii/docker-compose.yml) file.
ia_edge_video_analytics_microservice:
  # Add root user
  user: root
  ...
  environment:
    # Refer [GenICam GigE/USB3.0 Camera Support](/4.0/IEdgeInsights/EdgeVideoAnalyticsMicroservice/eii/docs/generic_plugin_doc.html) to install the respective camera SDK
    # Setting GENICAM value to the respective camera/GenTL producer which needs to be used
    GENICAM: "<CAMERA/GenTL>"
  ...
Note
If the GenICam cameras do not get initialized during the runtime, then on the host system, run the
docker system prunecommand. After that, remove the GenICam specific semaphore files from the/dev/shm/path of the host system. Thedocker system prunecommand will remove all the stopped containers, networks that are not used (by at least one container), any dangling images, and build cache which could prevent the plugin from accessing the device.If you get the
Feature not writablemessage while working with the GenICam cameras, then reset the device using the camera software or using the reset property of the Generic Plugin. For more information, refer the README.
Refer the following configuration for configuring the config.json(
[WORK_DIR]/IEdgeInsights/EdgeVideoAnalyticsMicroservice/eii/config.json) file for GenICam GigE/USB3.0 cameras.// "source_parameters": { "element": "gencamsrc", "type": "gst" }, "pipeline": "cameras", "pipeline_version": "camera_source", "publish_frame": true, "model_parameters": {}, //
Make the following changes to the templates section of the pipeline.json(
[WORK_DIR]/IEdgeInsights/EdgeVideoAnalyticsMicroservice/eii/pipelines/cameras/camera_source/pipeline.json)."type": "GStreamer", "template": [ "gencamsrc serial=<DEVICE_SERIAL_NUMBER> pixel-format=<PIXEL_FORMAT> width=<IMAGE_WIDTH> height=<IMAGE_HEIGHT> name=source", " ! videoconvert", " ! video/x-raw,format=BGR", " ! appsink name=destination" ],
Refer to the docs/basler_doc.md for more information/configuration on Basler camera.
Note:
Generic Plugin can work only with GenICam compliant cameras and only with gstreamer ingestor.
The above gstreamer pipeline was tested with Basler and IDS GigE cameras.
If
serialis not provided, then the first connected camera in the device list will be used.If
pixel-formatis not provided then the defaultmono8pixel format will be used.If
widthandheightproperties are not set then gencamsrc plugin will set the maximum resolution supported by the camera.By default,
exposure-autoproperty is set to on. If the camera is not placed under sufficient light then with auto exposure,exposure-timecan be set to very large value which will increase the time taken to grab frame. This can lead toNo frame received error. Hence it is recommended to manually set exposure as in the following sample pipeline when the camera is not placed under good lighting conditions.throughput-limitis the bandwidth limit for streaming out data from the camera(in bytes per second). Setting this property to a higher value might result in better FPS but make sure that the system and the application can handle the data load otherwise it might lead to memory bloat. Refer the below example pipeline to use the above mentioned properties:"type": "GStreamer", "template": [ "gencamsrc serial=<DEVICE_SERIAL_NUMBER> pixel-format=ycbcr422_8 width=1920 height=1080 exposure-time=5000 exposure-mode=timed exposure-auto=off throughput-limit=100000000 name=source", " ! videoconvert", " ! video/x-raw,format=BGR", " ! appsink name=destination" ],
While using the basler USB3.0 camera, ensure that the USBFS limit is set to atleast 256MB or more. You can verify this value by using command
cat /sys/module/usbcore/parameters/usbfs_memory_mb. If it is less than 256MB, then follow these steps to increase the USBFS value.
RTSP Cameras
Update the RTSP camera IP or the simulated source IP to the RTSP_CAMERA_IP variable in the .env([WORK_DIR]/IEdgeInsights/build/.env) file. Refer to the docs/rtsp_doc.md for information/configuration on RTSP camera.
Refer the following configuration for configuring the config.json(
[WORK_DIR]/IEdgeInsights/EdgeVideoAnalyticsMicroservice/eii/config.json) file for RTSP camera.// "source_parameters": { "element": "rtspsrc", "type": "gst" }, "pipeline": "cameras", "pipeline_version": "camera_source", "publish_frame": true, "model_parameters": {}, //
Make the following changes to the templates section of the pipeline.json(
[WORK_DIR]/IEdgeInsights/EdgeVideoAnalyticsMicroservice/eii/pipelines/cameras/camera_source/pipeline.json)."type": "GStreamer", "template": [ "rtspsrc location=\"rtsp://<USERNAME>:<PASSWORD>@<RTSP_CAMERA_IP>:<PORT>/<FEED>\" latency=100 name=source", " ! rtph264depay", " ! h264parse", " ! vaapih264dec", " ! vaapipostproc format=bgrx", " ! videoconvert ! video/x-raw,format=BGR", " ! appsink name=destination" ],
Note
The RTSP URI of the physical camera depends on how it is configured using the camera software. You can use VLC Network Stream to verify the RTSP URI to confirm the RTSP source.
USB v4l2 Cameras
For information or configurations details on the USB cameras, refer to docs/usb_doc.md.
Refer the following configuration for configuring the config.json(
[WORK_DIR]/IEdgeInsights/EdgeVideoAnalyticsMicroservice/eii/config.json) file for USB v4l2 camera.// "source_parameters": { "element": "v4l2src", "type": "gst" }, "pipeline": "cameras", "pipeline_version": "camera_source", "publish_frame": true, "model_parameters": {}, //
Make the following changes to the templates section of the pipeline.json(
[WORK_DIR]/IEdgeInsights/EdgeVideoAnalyticsMicroservice/eii/pipelines/cameras/camera_source/pipeline.json)."type": "GStreamer", "template": [ "v4l2src device=/dev/<DEVICE_VIDEO_NODE> name=source", " ! video/x-raw,format=YUY2", " ! videoconvert ! video/x-raw,format=BGR", " ! appsink name=destination" ],
Image Ingestion
The Image ingestion feature is responsible for ingesting the images coming from a directory into the EII stack for further processing. Image ingestion supports the following image formats:
Jpg
Jpeg
Jpe
Bmp
Png
Volume mount the image directory present on the host system. To do this, provide the absolute path of the images directory in the docker-compose file.
Refer the following snippet of the ia_edge_video_analytics_microservice service to add the required changes in the docker-compose.yml([WORK_DIR]/IEdgeInsights/EdgeVideoAnalyticsMicroservice/eii/docker-compose.yml) file. After making the changes, ensure that the builder.py([WORK_DIR]/IEdgeInsights/build/builder.py) is executed before you build and run the services.
ia_edge_video_analytics_microservice:
  ...
  volume:
    - "/tmp:/tmp"
    # volume mount the udev database with read-only permission,so the USB3 Vision interfaces can be enumerated correctly in the container
    - "/run/udev:/run/udev:ro"
    # Volume mount the directory in host system where the images are stored onto the container directory system.
    # Eg: -"home/directory_1/images_directory:/home/pipeline-server/img_dir"
    - "<relative or absolute path to images directory>:/home/pipeline-server/img_dir"
    ...
Refer the following snippet for configuring the config.json([WORK_DIR]/IEdgeInsights/EdgeVideoAnalyticsMicroservice/eii/config.json) file for enabling the image ingestion feature for Jpg and Png images.
{
 //
  "model_parameters": {},
      "pipeline": "cameras",
      "pipeline_version": "camera_source",
      "publish_frame": true,
      "source": "gstreamer",
      "source_parameters": {
          "element": "multifilesrc",
          "type": "gst"
      },
}
For JPG Images
Refer to the following pipeline while using jpg,jpeg and jpe images and make changes to the pipeline.json(
[WORK_DIR]/IEdgeInsights/EdgeVideoAnalyticsMicroservice/eii/pipelines/cameras/camera_source/pipeline.json) file."type": "GStreamer", "template": [ "multifilesrc location=\"/home/pipeline-server/img_dir/<image_filename>%02d.jpg\" index=1 name=source", " ! jpegdec ! decodebin", " ! videoconvert ! video/x-raw,format=BGR", " ! appsink name=destination" ],
For example: If the images are named in the format
frame_01,frame_02and so on, then use the following pipeline."type": "GStreamer", "template": [ "multifilesrc location=\"/home/pipeline-server/img_dir/frame_%02d.jpg\" index=1 name=source", " ! jpegdec ! decodebin", " ! videoconvert ! video/x-raw,format=BGR", " ! appsink name=destination" ],
Note
The images should follow a naming convention and should be named in the format characters followed by digits in the sequential order. For eg.
frame_001,frame_002,frame_003and so on.Make use of the
%dformat specifier to specify the total digits present in the image filename. For Eg. If the images are named in the formatframe_0001,frame_0002, then it has total 4 digits in the filename. Use%04dwhile providing the image name<image_filename>%04d.jpgin the pipeline.json([WORK_DIR]/IEdgeInsights/EdgeVideoAnalyticsMicroservice/eii/pipelines/cameras/camera_source/pipeline.json) file.The ingestion will stop if it does not find the required image name. For eg. If directory contains images
frame_01,frame_02andframe_04, then the ingestion will stop after readingframe_02sinceframe_03is not present in the directory.Make use of images having resolution -
720×480,1280×720,1920×1080,3840×2160and1920×1200. If a different resolution image is used then the EdgeVideoAnalytics service might fail withreshapeerror as gstreamer does zero padding to that image.Make sure that the images directory is having the required read and execute permission. If not use the following command to add the permissions.
sudo chmod -R 755 <path to images directory>
For PNG Images
Refer to the follwoing pipeline while using png images and make changes to the pipeline.json(
[WORK_DIR]/IEdgeInsights/EdgeVideoAnalyticsMicroservice/eii/pipelines/cameras/camera_source/pipeline.json) file."type": "GStreamer", "template": [ "multifilesrc location=\"/home/pipeline-server/img_dir/<image_filename>%03d.png\" index=1 name=source", " ! pngdec ! decodebin", " ! videoconvert ! video/x-raw,format=BGR", " ! appsink name=destination" ],
Note
It is recommended to set the loop property of the multifilesrc element to false loop=FALSE to avoid memory leak issues.
For BMP Images
Refer to the following snippet for configuring the config.json([WORK_DIR]/IEdgeInsights/EdgeVideoAnalyticsMicroservice/eii/config.json) file for enabling the image ingestion feature for bmp image.
{
 //
  "model_parameters": {},
      "pipeline": "cameras",
      "pipeline_version": "camera_source",
      "publish_frame": true,
      "source": "gstreamer",
      "source_parameters": {
          "element": "imagesequencesrc",
          "type": "gst"
      },
}
Refer to the following pipeline while using bmp images and make changes to the pipeline.json([WORK_DIR]/IEdgeInsights/EdgeVideoAnalyticsMicroservice/eii/pipelines/cameras/camera_source/pipeline.json) file.
"type": "GStreamer",
    "template": [
        "imagesequencesrc location=/home/pipeline-server/img_dir/<image_filename>%03d.bmp start-index=1 framerate=1/1",
        " ! decodebin",
        " ! videoconvert ! video/x-raw,format=BGR",
        " ! appsink name=destination"
    ],
Path Specification for images:
Considering folder name as ‘images’ where the images are stored.
Relative Path: "./images:/home/pipeline-server/img_dir" (or) "${PWD}/images:/home/pipeline-server/img_dir"
Absolute Path: "/home/ubuntu/images:/home/pipeline-server/img_dir"
Integrate Python UDF with EdgeVideoAnalyticsMicroservice Service
You can integrate any python UDF with EdgeVideoAnalyticsMicroservice using the volume mount method. You can follow the steps to integrate the python UDF:
- Volume mount the python UDF.
You need to provide absolute or relative path to the python UDF and the video file in the
docker-compose.ymlfile. Refer the following snippet to volume mount the python UDF using the docker-compose.yml([WORK_DIR]/IEdgeInsights/EdgeVideoAnalyticsMicroservice/eii/docker-compose.yml) file.
   ia_edge_video_analytics_microservice:
     ...
     volumes:
     - ../EdgeVideoAnalyticsMicroservice/eii/pipelines:/home/pipeline-server/pipelines/
     - ../EdgeVideoAnalyticsMicroservice/resources:/home/pipeline-server/resources/
     - <absolute or relative path to the python_udf>:/home/pipeline-server/eva_udfs/<python_udf>
     ...

For example. If you want to use the safety_gear(\ ``[WORK_DIR]/IEdgeInsights/CustomUdfs/PySafetyGearAnalytics/safety_gear``\ ) UDF, then you need to volume mount this UDF.
The structure of safety_gear UDF is as show:
   safety_gear/
   |-- __init__.py
   |-- ref
   |   |-- frozen_inference_graph.bin
   |   |-- frozen_inference_graph.xml
   |   |-- frozen_inference_graph_fp16.bin
   |   `-- frozen_inference_graph_fp16.xml
   `-- safety_classifier.py

Refer to the following snippet to volume mount the safety_gear UDF.
ia_edge_video_analytics_microservice:
  ...
  volumes:
  - ../EdgeVideoAnalyticsMicroservice/eii/pipelines:/home/pipeline-server/pipelines/
  - ../EdgeVideoAnalyticsMicroservice/resources:/home/pipeline-server/resources/
  - /home/IEdgeInsights/CustomUdfs/PySafetyGearAnalytics/safety_gear:/home/pipeline-server/eva_udfs/safety_gear
  ...
Start cvlc based RTSP stream
Install VLC if not installed already:
sudo apt install vlcIn order to use the RTSP stream from cvlc, the RTSP server must be started using VLC with the following command:
cvlc -vvv file://<absolute_path_to_video_file> --sout '#gather:rtp{sdp=rtsp://<SOURCE_IP>:<PORT>/<FEED>}' --loop --sout-keep
Note
<FEED> in the cvlc command can be live.sdp or it can also be avoided. But make sure the same RTSP URI given here is used in the ingestor pipeline config.
For example, Refer to the command to start a cvlc based RTSP stream for safety gear video file([WORK_DIR]/IEdgeInsights/CustomUdfs/PySafetyGearIngestion/Safety_Full_Hat_and_Vest.avi).
cvlc -vvv file:///home/IEdgeInsights/CustomUdfs/PySafetyGearIngestion/Safety_Full_Hat_and_Vest.avi --sout '#gather:rtp{sdp=rtsp://<SOURCE_IP>:8554/live.sdp}' --loop --sout-keep
- Configure the pipeline.json(
[WORK_DIR]/IEdgeInsights/pipeline.json) You need to update the
templatessection and provide the path to the video file in the pipeline.json([WORK_DIR]/IEdgeInsights/pipeline.json). Refer to the example to configure the pipeline.json file.
   {
     "type": "GStreamer",
     "template": [
     "rtspsrc location=\"rtsp://<SOURCE_IP>:<PORT>/<FEED>\" latency=100 name=source",
     " ! rtph264depay",
     " ! h264parse",
     " ! vaapih264dec",
     " ! vaapipostproc format=bgrx",
     " ! videoconvert ! video/x-raw,format=BGR",
     " ! udfloader name=udfloader",
     " ! appsink name=destination"
     ],
     "description": "EII UDF pipeline",
     "parameters": {
         "type": "object",
         "properties": {
             "udfloader": {
                 "element": {
                     "name": "udfloader",
                     "property": "config",
                     "format": "json"
                 },
                 "type": "object"
             }
          }
       }
   }

**Note:** Make sure ``parameters`` tag is added while using udfloader element.
- Configure the pipeline.json(
Configure the config.json(
[WORK_DIR]/IEdgeInsights/EdgeVideoAnalyticsMicroservice/eii/config.json) file.You need to configure the
udfssection in theconfig.jsonfile as shown:You need to configure the
source_parameterssection and theudfssection in theconfig.jsonfile as shown below.main
   {
       "source_parameters": {
           "element": "rtspsrc",
           "type": "gst"
       },
       //
       "udfs": [
           {
               "name": "<path to python udf>",
               "type": "python",
               "device": "CPU",
               "model_xml": "<path to model xml file>",
               "model_bin": "<path to model bin file>"
           }
       ]
       //
   }

The following example shows the configuration for safety_gear UDF.
{
    "source_parameters": {
        "element": "rtspsrc",
        "type": "gst"
    },
    //
    "udfs": [
        {
            "name": "eva_udfs.safety_gear.safety_classifier",
            "type": "python",
            "device": "CPU",
            "model_xml": "./eva_udfs/safety_gear/ref/frozen_inference_graph.xml",
            "model_bin": "./eva_udfs/safety_gear/ref/frozen_inference_graph.bin"
        }
    ]
    //
}
**Note:**
- One can add custom udfs to eva_udfs(`[WORK_DIR]/IEdgeInsights/EdgeVideoAnalyticsMicroservice/eva_udfs`) directory as this path is volume mounted to the EVAM service. Refer the above example to add a custom udf.
- Geti udf takes the path of the deployment directory as the input for deploying a project for local inference. Refer the below example to see how the path of the deployment directory is specified in the udf config. As mentioned in the above steps make sure all the required resources are volume mounted to the EVAM service.

The following example shows the configuration for geti UDF.

```javascript
{
    "source_parameters": {
        "element": "rtspsrc",
        "type": "gst"
    },
    //
    "udfs": [
        {
            "type": "python",
            "name": "<path to python geti udf>",
            "device": "CPU",
            "visualize": "true",
            "deployment": "<path to geti deployment directory>"

        }
    ]
    //
}
```
Refer [geti udf readme](/4.0/IEdgeInsights/EdgeVideoAnalyticsMicroservice/eva_udfs/geti_udf/README.html) for more details.

After making the changes, ensure that the builder.py(`[WORK_DIR]/IEdgeInsights/build/builder.py`) script is executed before you build and run the services.
Running EdgeVideoAnalyticsMicroservice with multi-instance
EdgeVideoAnalyticsMicroservice supports running multi-instance with EII stack, you can run the following command to generate the multi-instance boiler plate config for any number of streams of video-streaming-evam use case:
python3 builder.py -f usecases/video-streaming-evam.yml -v <number_of_streams_required>
A sample example config on how to connect Multimodal Data Visualization and Multimodal Data Visualization Streaming with EdgeVideoAnalyticsMicroservice is given below. Please ensure to update both the configs of Multimodal Data Visualization and Multimodal Data Visualization Streaming services with these changes:
{
    "interfaces": {
        "Subscribers": [
            {
                "Name": "default",
                "Type": "zmq_tcp",
                "EndPoint": "ia_edge_video_analytics_microservice:65114",
                "PublisherAppName": "EdgeVideoAnalyticsMicroservice",
                "Topics": [
                    "edge_video_analytics_results"
                ]
            }
        ]
    }
}
Note
While using multi-instance feature, you need to update the config.json files and docker-compose files in the [WORK_DIR]/IEdgeInsights/build/multi_instance directory and the pipeline.json files present in the pipelines([WORK_DIR]/IEdgeInsights/EdgeVideoAnalyticsMicroservice/eii/pipelines/) directory.
Running EdgeVideoAnalyticsMicroservice with EII helm usecase
Please refer to README
Running EdgeVideoAnalyticsMicroservice on a GPU device
EdgeVideoAnalyticsMicroservice supports running inference only on CPU and GPU devices by accepting the device value (“CPU”|”GPU”), part of the udf object configuration in the udfs key.
The device field in the UDF config of udfs key in the EdgeVideoAnalyticsMicroservice configs([WORK_DIR]/IEdgeInsights/EdgeVideoAnalyticsMicroservice/eii/config.json) needs to be updated.
To Run on Intel(R) Processor Graphics (GPU/iGPU)
At runtime, use the root user permissions to run inference on a GPU device. To enable root user at runtime in ia_edge_video_analytics_microservice, add user: root in the docker-compose.yml([WORK_DIR]/IEdgeInsights/EdgeVideoAnalyticsMicroservice/eii/docker-compose.yml) file.
Refer the following example:
ia_edge_video_analytics_microservice:
  ...
  user: root
Note
EdgeVideoAnalyticsMicroservice does not support running inference on VPU -
MYRIAD (NCS2)andHDDLdevices.If you get a
Failed to create plugin for device GPU/ clGetPlatformIDs errormessage, then check if the host system supports GPU device. Install the required drivers from OpenVINO-steps-for-GPU. Certain platforms like TGL can have compatibility issues with the Ubuntu kernel version. Ensure the compatible kernel version is installed.“EdgeVideoAnalyticsMicroservice by default runs the video ingestion and analytics pipeline in a single micro-service for which the interface connection configuration is as below.
"Publishers": [
          {
              "Name": "default",
              "Type": "zmq_tcp",
              "EndPoint": "0.0.0.0:65114",
              "Topics": [
                  "edge_video_analytics_results"
              ],
              "AllowedClients": [
                  "*"
              ]
          }
“EdgeVideoAnalyticsMicroservice” can be configured to: run only with video ingestion capability by just adding the below Publisher section (The publisher config remains same as above) :
"Publishers": [
      {
          "Name": "default",
          "Type": "zmq_tcp",
          "EndPoint": "0.0.0.0:65114",
          "Topics": [
              "camera1_stream"
          ],
          "AllowedClients": [
              "*"
          ]
      }
“EdgeVideoAnalyticsMicroservice” can be configured to: run only with video analytics capability by just adding the below Subscriber section.
"Subscribers": [
    {
        "Name": "default",
        "Type": "zmq_ipc",
        "EndPoint": "/EII/sockets",
        "PublisherAppName": "VideoIngestion",
        "Topics": [
            "camera1_stream_results"
        ],
        "zmq_recv_hwm": 50
    }
]
The “source” parameter in the config.json needs to be updated to EII Messagebus since “EdgeVideoAnalyticsMicroservice” when running with video analytics capability need to get its data from the EII messagebus.
{
    "config": {
        "source": "msgbus",
Use Human Pose Estimation UDF with EdgeVideoAnalyticsMicroservice
To use the Human Pose Estimation([WORK_DIR]/IEdgeInsights/) UDF, make the following changes to the config.json([WORK_DIR]/IEdgeInsights/EdgeVideoAnalyticsMicroservice/eii/config.json) and docker-compose([WORK_DIR]/IEdgeInsights/EdgeVideoAnalyticsMicroservice/eii/docker-compose.yml) file.
Configure the config.json(
[WORK_DIR]/IEdgeInsights/EdgeVideoAnalyticsMicroservice/eii/config.json) and make changes to thepipelineandpipeline_version.
"pipeline": "object_detection",
"pipeline_version": "human_pose_estimation",
"publish_frame": true,
Volume mount the Human Pose Estimation UDF in the docker-compose.yml(
[WORK_DIR]/IEdgeInsights/EdgeVideoAnalyticsMicroservice/eii/docker-compose.yml) file.
volumes:
  - ../EdgeVideoAnalyticsMicroservice/resources:/home/pipeline-server/resources/
  - ../EdgeVideoAnalyticsMicroservice/models_list/human_pose_estimation:/home/pipeline-server/models/human_pose_estimation
Note
Use the following volume mount path in docker-compose.yml([WORK_DIR]/IEdgeInsights/EdgeVideoAnalyticsMicroservice/eii/docker-compose.yml) file while independently deploying EdgeVideoAnalyticsMicroservice.
../models_list/human_pose_estimation:/home/pipeline-server/models/human_pose_estimation
EII UDFLoader Overview
UDFLoader is a library providing APIs for loading and executing native and python UDFs.
Dependency Installation
UDFLoader depends on the following libraries. Follow the documentation to install the libraries:
OpenCV - Run
source /opt/intel/openvino/bin/setupvars.shcommandPython3 Numpy package
Compilation
Utilizes CMake as the build tool for compiling the library. The simplest sequence of commands for building the library are shown below.
mkdir build
cd build
cmake ..
make
If you wish to compile in debug mode, then you can set the CMAKE_BUILD_TYPE to Debug when executing the cmake command (as shown below).
cmake -DCMAKE_BUILD_TYPE=Debug ..
Installation
Note
This is a mandatory step to use this library in C/C++ EII modules.
If you wish to install this library on your system, execute the following command after building the library:
sudo make install
By default, this command will install the udfloader library into
/usr/local/lib/. On some platforms this is not included in the LD_LIBRARY_PATH
by default. As a result, you must add this directory to you LD_LIBRARY_PATH. This can
be accomplished with the following export:
export LD_LIBRARY_PATH=$LD_LIBRARY_PATH:/usr/local/lib/
Note
You can also specify a different library prefix to CMake through
the CMAKE_INSTALL_PREFIX flag.
Running Unit Tests
Note
The unit tests will only be compiled if the WITH_TESTS=ON option
is specified when running CMake.
Run the following commands from the build/tests folder to cover the unit
tests.
# First, source the source.sh file to setup the PYTHONPATH environment
source ./source.sh

# Execute frame abstraction unit tests
./frame-tests

# Execute UDF loader unit tests
./udfloader-tests
EII Sample UDFs
Edge Insights for Industrial (EII) supports the loading and executing of native (C++) and python UDFs. In here, you can find the sample native and python User Defined Functions (UDFs) to be used with EII components like VideoIngestion and VideoAnalytics. The UDFs can modify the frame, drop the frame and generate meta-data from the frame.
User Defined Function (UDF)
An UDF is a chunk of user code that acts as a filter, preprocessor, or classifier for a given data input coming from the EII. The User Defined Function (UDF) Loader Library provides a common API for loading C++ and Python UDFs.
The library itself is written in C++ and provides an abstraction layer for loading and calling UDFs. Additionally, the library defines a common interface inheritable by all UDFs (whether written in C++ or Python).
The overall block diagram for the library is shown in the following figure.
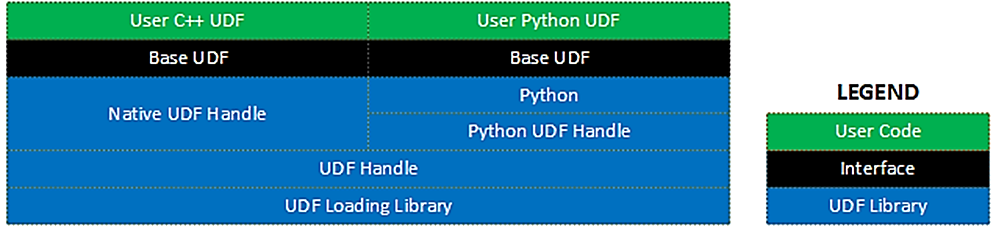
In this case, the VideoIngestion component is also able to execute the video data classifier algorithm by including the classifier UDF into the VideoIngestion configuration. By defining the Classifier UDF in the VideoIngestion component, the VideoAnalytics component become optional
Multimodal Data Visualization Microservice Overview
The Multimodal Data Visualization microservice provides functionality to represent the data graphically. Using this service, you can visualize the video streaming and Time Series data. The following containers run as a part of the Multimodal Data Visualization microservice:
multimodal-data-visualization
multimodal-data-visualization-streaming
The multimodal-data-visualization-streaming container gets the ingested frames and the inference results from the MsgBus subscriber and it then renders the video to a webpage. This webpage is embedded in Grafana* to visualize the video stream and the Time Series data on the same dashboard.
This directory provides a Docker compose and config file to use the Multimodal Data Visualization microservice with the Edge Insights for Industrial software stack.
Prerequisites
As a prerequisite for the Multimodal Data Visualization microservice, complete the following steps:
EII when downloaded from ESH would be available at the installed location
cd [EII installed location]/IEdgeInsights
Complete the prerequisite for provisioning the EII stack. For more information, refer to the README.md.
Run the following commands to set the environment and build the
ia_configmgr_agentcontainer:cd [WORK_DIR]/IEdgeInsights/build # Execute the builder.py script python3 builder.py -f usecases/video-streaming.yml
Run the Containers
To pull the prebuilt EII container images and Multimodal Data Visualization microservice images from Docker Hub and run the containers in the detached mode, run the following command:
# Start the docker containers
docker-compose up -d
Note
The prebuilt container image for the Multimodal Data Visualization microservice
gets downloaded when you run the docker-compose up -d command, if the image is not already present on the host system.
Interfaces Section
In the EII mode, the endpoint details for the EII service you need to subscribe from are to be provided in the Subscribers section in the config([WORK_DIR]/IEdgeInsights/Visualizer/config.json) file.
For more details on the structure, refer to the EII documentation.
Grafana Overview
Grafana supports various storage backends for the Time Series data (data source). EII uses InfluxDB as the data source. Grafana connects to the InfluxDB data source that is preconfigured as a part of the Grafana setup. The ia_influxdbconnector and ia_webservice service must be running for Grafana to be able to collect the Time Series data and stream the video respectively. After the data source starts working, you can use the preconfigured dashboard to visualize the incoming data. You can also edit the dashboard as required.
After the Multimodal Data Visualization microservice is up, you can access Grafana at http://<HOST_IP>:3000
Grafana Configuration
The following are the configuration details for Grafana:
dashboard.json(
[WORK_DIR]/IEdgeInsights/Visualizer/multimodal-data-visualization/eii/dashboard.json): This is the dashboard json file that is loaded when Grafana starts. It is preconfigured to display the Time Series data.dashboards.yml(
[WORK_DIR]/IEdgeInsights/Visualizer/multimodal-data-visualization/eii/dashboards.yml): This is the config file for all the dashboards. It specifies the path to locate all the dashboard json files.datasources.yml(
[WORK_DIR]/IEdgeInsights/Visualizer/multimodal-data-visualization/eii/datasources.yml): This is the config file for setting up the data source. It has various fields for data source configuration.grafana.ini(
[WORK_DIR]/IEdgeInsights/Visualizer/multimodal-data-visualization/eii/grafana.ini): This is the config file for Grafana. It specifies how Grafana should start after it is configured.
Note
You can edit the contents of these files based on your requirement.
Run Grafana in the PROD Mode
Note
Skip this section, if you are running Grafana in the DEV mode.
To run Grafana in the PROD mode, import cacert.pem from the build/Certificates/rootca/ directory to the browser certificates. Complete the following steps to import certificates:
In Chrome browser, go to Settings.
In Search settings, enter Manage certificates.
In Privacy and security, click Security.
On the Advanced section, click Manage certificates.
On the Certificates window, click the Trusted Root Certification Authorities tab.
Click Import.
On the Certificate Import Wizard, click Next.
Click Browse.
Go to the
IEdgeInsights/build/Certificates/rootca/directory.Select the cacert.pem file, and provide the necessary permissions, if required.
Select all checkboxes and then, click Import.
Run Grafana for a Video Use Case
Complete the following steps to run Grafana for a video use case:
Ensure that the endpoint of the publisher, that you want to subscribe to, is mentioned in the Subscribers section of the config(
[WORK_DIR]/IEdgeInsights/Visualizer/config.json) file.Use root as the Username and eii123 Password both for first login, password can be changed if required when prompted after logging in.
On the Home Dashboard page, on the left corner, click the Dashboards icon.
Click the Manage Dashboards tab, to view the list of all the preconfigured dashboards.
Select EII Video and Time Series Dashboard, to view multiple panels with topic names of the subscriber as the panel names along with a time-series panel named
Time Series.Hover over the topic name. The panel title will display multiple options.
Click View to view the subscribed frames for each topic.
Note
Changing gridPos for the video frame panels is prohibited since these values are altered internally to support multi-instance.
Grafana does not support visualization for GVA and CustomUDF streams.
Multimodal Data Visualization Streaming
Multimodal Data Visualization Streaming is part of Multimodal Data Visualization microservice which helps in streaming the processed video to the Webpage. This URL where the streaming is happening is used in Grafana based Visualization service for Visualization. For e.g., in EVAM mode, it uses WebRTC framework to get the processed video from Edge Video Analytics service and stream it to the Web Page. This Web page is embedded in Grafana Dashboard using the AJAX panel to visualize the stream along with the other metrics related to Video Processing. Similarly, in EII mode, the Webservice gets the ingested frames and inference results from the MsgBus subscriber and render the video to the webpage. This webpage is then used in Grafana for Visualization.
Steps to Independently Build and Deploy “Multimodal Data Visualization Streaming” Service
Note
For running 2 or more microservices, we recommend users to try the use case-driven approach for building and deploying as mentioned in Generate Consolidated Files for a Subset of Edge Insights for Industrial Services.
Steps to Independently Build “Multimodal Data Visualization Streaming” Service
Note
When switching between independent deployment of the service with and without config manager agent service dependency, one would run into issues with docker-compose build w.r.t Certificates folder existence. As a workaround, please run command sudo rm -rf Certificates to proceed with docker-compose build.
To independently build “Multimodal Data Visualization Streaming” service, complete the following steps:
The downloaded source code should have a directory named Visualizer:
cd IEdgeInsights/Visualizer/multimodal-data-visualization-streaming/eii
Copy the IEdgeInsights/build/.env file using the following command in the current folder
cp ../../../build/.env .
NOTE: Update the HOST_IP and ETCD_HOST variables in the .env file with your system IP.
# Source the .env using the following command:
set -a && source .env && set +a
Independently build
docker-compose build
Steps to Independently Deploy “Multimodal Data Visualization Streaming” Service
You can deploy the “Multimodal Data Visualization Streaming” service in any of the following two ways:
Deploy “Multimodal Data Visualization Streaming” Service without Config Manager Agent Dependency
Run the following commands to deploy “Multimodal Data Visualization Streaming” service without Config Manager Agent dependency:
# Enter the multimodal-data-visualization-streaming directory
cd IEdgeInsights/Visualizer/multimodal-data-visualization-streaming/eii
Copy the IEdgeInsights/build/.env file using the following command in the current folder, if not already present.
cp ../../../build/.env .Note: Ensure that
docker psis clean anddocker network lsmust not have EII bridge network.
Update .env file for the following:
1. HOST_IP and ETCD_HOST variables with your system IP.
2. `READ_CONFIG_FROM_FILE_ENV` value to `true` and `DEV_MODE` value to `true`.

Source the .env using the following command:
set -a && source .env && set +a
# Run the service
docker-compose -f docker-compose.yml -f docker-compose-dev.override.yml up -d
Deploy “Multimodal Data Visualization Streaming” Service with Config Manager Agent Dependency
Run the following commands to deploy “Multimodal Data Visualization Streaming” service with Config Manager Agent dependency:
Note
Ensure that the Config Manager Agent image present in the system. If not, build the Config Manager Agent locally when independently deploying the service with Config Manager Agent dependency.
# Enter the multimodal-data-visualization directory
cd IEdgeInsights/Visualizer/multimodal-data-visualization/eii
Copy the IEdgeInsights/build/.env file using the following command in the current folder, if not already present.
cp ../../../build/.env .Note: Ensure that
docker psis clean anddocker network lsdoesn’t have EII bridge networks.
Update .env file for following:
1. HOST_IP and ETCD_HOST variables with your system IP.
2. `READ_CONFIG_FROM_FILE_ENV` value is set to `false`.
Copy the docker-compose.yml from IEdgeInsights/ConfigMgrAgent as docker-compose.override.yml
cp ../../../ConfigMgrAgent/docker-compose.yml docker-compose.override.yml
Copy the builder.py with standalone mode changes from IEdgeInsights/build directory
cp ../../../build/builder.py .Run the builder.py in standalone mode, this will generate eii_config.json and update docker-compose.override.yml
python3 builder.py -s trueBuilding the service (This step is optional for building the service if not already done in the
Independently buildablestep above)docker-compose buildFor running the service in PROD mode, run the below command:
NOTE: Make sure to update
DEV_MODEtofalsein .env while running in PROD mode and source the .env using the commandset -a && source .env && set +a.docker-compose up -dFor running the service in DEV mode, run the below command:
NOTE: Make sure to update
DEV_MODEtotruein .env while running in DEV mode and source the .env using the commandset -a && source .env && set +a.docker-compose -f docker-compose.yml -f docker-compose-dev.override.yml -f docker-compose.override.yml up -dNOTE: When running in DEV mode, use the following link
http://<IP>:5004/<SUBSCRIBER TOPIC NAME>to view output.
Run Multimodal Data Visualization Streaming Service with EdgeVideoAnalyticsMicroservice
For running Multimodal Data Visualization Streaming with EdgeVideoAnalyticsMicroservice as a publisher, the config can be updated to subscribe to the EndPoint and topic of EdgeVideoAnalyticsMicroservice in the following way:
{
    "interfaces": {
        "Subscribers": [
            {
                "Name": "default",
                "Type": "zmq_tcp",
                "EndPoint": "ia_edge_video_analytics_microservice:65114",
                "PublisherAppName": "EdgeVideoAnalyticsMicroservice",
                "Topics": [
                    "edge_video_analytics_results"
                ]
            }
        ]
    }
}
DataStore
For more details see the DataStore Microservice section.
Time Series Analytics
For time series data, a sample analytics flow uses Telegraf for ingestion, Influx DB for storage, and Kapacitor for classification. This is demonstrated with an MQTT-based ingestion of sample temperature sensor data and analytics with a Kapacitor UDF that detects threshold for the input values.
The services mentioned in the build/usecases/time-series.yml([WORK_DIR]/IEdgeInsights/build/usecases/time-series.yml) file will be available in the consolidated docker-compose.yml and consolidated build/eii_config.json of the EII stack for the time series use case when built via builder.py as called out in previous steps.
This will enable building of the Telegraf and the Kapacitor based analytics containers.
For more details on enabling this mode, refer to the Kapacitor/README.md
The sample temperature sensor can be simulated using the MQTT publisher. For more information, refer to the tools/mqtt/README.md.
Telegraf Overview
Telegraf is a part of the TICKstack. It is a plugin-based agent that has many input and output plugins. In EII’s basic configuration, it’s being used for data ingestion and sending data to influxDB. However, the EII framework does not restrict any features of Telegraf.
Plugins
The plugin subscribes to a configured topic or topic prefixes. The plugin has a component called a subscriber, which receives the data from the EII message bus. After receiving the data, depending on the configuration, the plugin processes the data, either synchronously or asynchronously.
In synchronous processing**, the receiver thread (the thread that receives the data from the message bus) is also responsible for processing the data (JSON parsing). After processing the previous data only, the receiver thread processes the next data available on the message bus.
In asynchronous processing the receiver thread receives the data and put it into the queue. A pool of threads will be dequeuing the data from the queue and processing it.
Guidelines for choosing the data processing options are as follows:
Synchronous option:When the ingestion rate is consistent
Asynchronous options:There are two options
Topic-specific queue+threadpool:Frequent spike in ingestion rate for a specific topic
Global queue+threadpool:Sometimes spike in ingestion rate for a specific topic
Steps to Independently Build and Deploy the Telegraf Service
Note
For running 2 or more microservices, we recommend users to try the use case-driven approach for building and deploying as mentioned in Generate Consolidated Files for a Subset of Edge Insights for Industrial Services.
Steps to Independently Build the Telegraf Service
Note
When switching between independent deployment of the service with and without config manager agent service dependency, one would run into issues with docker-compose build w.r.t Certificates folder existence. As a workaround, run the command sudo rm -rf Certificates to proceed with docker-compose build.
To independently build Telegraf service, complete the following steps:
The downloaded source code should have a directory named Telegraf:
cd IEdgeInsights/Telegraf
Copy the IEdgeInsights/build/.env file using the following command in the current folder
cp ../build/.env .
NOTE: Update the HOST_IP and ETCD_HOST variables in the .env file with your system IP.
# Source the .env using the following command:
set -a && source .env && set +a
Independently build
docker-compose build
Steps to Independently Deploy the Telegraf Service
You can deploy the Telegraf service in any of the following two ways:
Deploy the Telegraf Service withoutthe Config Manager Agent Dependency
Run the following commands to deploy Telegraf service without Config Manager Agent dependency:
# Enter the Telegraf directory
cd IEdgeInsights/Telegraf
Copy the IEdgeInsights/build/.env file using the following command in the current folder, if not already present.
cp ../build/.env .Note: Ensure that
docker psis clean anddocker network lsdoesn’t have EII bridge network.
Update .env file for following:
1. HOST_IP and ETCD_HOST variables with your system IP.
2. `READ_CONFIG_FROM_FILE_ENV` value to `true` and `DEV_MODE` value to `true`.

Source the .env using the following command:
set -a && source .env && set +a
# Run the service
docker-compose -f docker-compose.yml -f docker-compose-dev.override.yml up -d
Note
Telegraf container restarts automatically when its config is modified in config.json file.
If user is updating the config.json file using vi or vim editor, it is required to append the set backupcopy=yes in ~/.vimrc so that the changes done on the host machine config.json gets reflected inside the container mount point.
Deploy The Telegraf Service with the Config Manager Agent Dependency
Run the following commands to deploy the Telegraf service with the Config Manager Agent dependency:
Note
Ensure that the Config Manager Agent image present in the system. If not, build the Config Manager Agent locally when independently deploying the service with Config Manager Agent dependency.
# Enter the Telegraf directory
cd IEdgeInsights/Telegraf
Copy the IEdgeInsights/build/.env file using the following command in the current folder, if not already present.
cp ../build/.env .
Note
Ensure that docker ps is clean and docker network ls does not have EII bridge network.
Update .env file for following:
1. HOST_IP and ETCD_HOST variables with your system IP.
2. `READ_CONFIG_FROM_FILE_ENV` value is set to `false`.
Copy the docker-compose.yml from IEdgeInsights/ConfigMgrAgent as docker-compose.override.yml in IEdgeInsights/Telegraf.
cp ../ConfigMgrAgent/docker-compose.yml docker-compose.override.yml
Copy the builder.py with standalone mode changes from IEdgeInsights/build directory
cp ../build/builder.py .Run the builder.py in standalone mode, this will generate eii_config.json and update docker-compose.override.yml
python3 builder.py -s trueBuilding the service (This step is optional for building the service if not already done in the
Independently buildablestep above)docker-compose buildFor running the service in PROD mode, run the below command:
NOTE: Make sure to update
DEV_MODEtofalsein .env while running in PROD mode and source the .env using the commandset -a && source .env && set +a.docker-compose up -dFor running the service in DEV mode, run the below command:
NOTE: Make sure to update
DEV_MODEtotruein .env while running in DEV mode and source the .env using the commandset -a && source .env && set +a.docker-compose -f docker-compose.yml -f docker-compose-dev.override.yml -f docker-compose.override.yml up -d
Telegraf’s Default Configuration
Telegraf starts with the default configuration which is present at config/Telegraf/Telegraf.conf(
[WORK_DIR]/IEdgeInsights/Telegraf/config/Telegraf/Telegraf.conf) (for the dev mode the name is ‘Telegraf_devmode.conf’). By default the below plugins are enabled:
MQTT input plugin ([[inputs.mqtt_consumer]])
EII message bus input plugin ([[inputs.eii_msgbus]])
Influxdb output plugin ([[outputs.influxdb]])
Telegraf will be started using script ‘telegraf_start.py. This script will get the configuration from ETCD first and then it will start the Telegraf service by picking the right configuration depending on the developer/production mode. By default, only a single instance of the Telegraf container runs (named ‘ia_telegraf’).
Volume Mounting of Telegraf Configuration Files
In the DEV mode (DEV_MODE=true in [WORK_DIR]/IEdgeInsights/build/.env), telegraf conf files are being volume mounted inside the Telegraf container image as can be seen in it’s docker-compose-dev.override.yml. This gives the flexibility for the developers to update the conf file on the host machine and see the changes being reflected in Telegraf, this can be done by just restarting the Telegraf container without the need to rebuilding the telegraf container image.
Note
If Telegraf is being run as Multi Telegraf, then make sure that the same file path is volume mounted. Ex: If volume mount Telegraf1 instance, the volume mount would look like:
volumes:
   - ./config/Telegraf1/:/etc/Telegraf/Telegraf1
MQTT Sample Configuration and the Testing Tool
To test with MQTT publisher in k8s helm environment, update ‘MQTT_BROKER_HOST’ Environment Variables in values.yaml(
[WORK_DIR]/IEdgeInsights/Telegraf/helm/values.yaml) with HOST IP address of the system where MQTT Broker is running.To test with remote MQTT broker in docker environment, update ‘MQTT_BROKER_HOST’ Environment Variables in docker-compose.yml(
[WORK_DIR]/IEdgeInsights/Telegraf/docker-compose.yml) with HOST IP address of the system where MQTT Broker is running.
ia_telegraf:
  environment:
    ...
    MQTT_BROKER_HOST: '<HOST IP address of the system where MQTT Broker is running>'
Telegraf instance can be configured with pressure point data ingestion. In the following example, the MQTT input plugin of Telegraf is configured to read pressure point data and stored into the ‘point_pressure_data’ measurement.
# # Read metrics from MQTT topic(s)
[[inputs.mqtt_consumer]]
#   ## MQTT broker URLs to be used. The format should be scheme://host:port,
#   ## schema can be tcp, ssl, or ws.
servers = ["tcp://localhost:1883"]
#
#   ## MQTT QoS, must be 0, 1, or 2
#   qos = 0
#   ## Connection timeout for initial connection in seconds
#   connection_timeout = "30s"
#
#   ## Topics to subscribe to
topics = [
"pressure/simulated/0",
]
name_override = "point_pressure_data"
data_format = "json"
#
#   # if true, messages that can't be delivered while the subscriber is offline
#   # will be delivered when it comes back (such as on service restart).
#   # NOTE: if true, client_id MUST be set
persistent_session = false
#   # If empty, a random client ID will be generated.
client_id = ""
#
#   ## username and password to connect MQTT server.
username = ""
password = ""
To start the MQTT-Publisher with pressure data,
cd ../tools/mqtt/publisher/
Change the command option in docker-compose.yml(
[WORK_DIR]/IEdgeInsights/tools/mqtt/publisher/docker-compose.yml) to:["--pressure", "10:30"]
Build and Run MQTT Publisher:
docker-compose up --build -d
Refer to the tools/mqtt/publisher/README.md
Enable Message Bus Input Plugin in Telegraf
The purpose of this enablement is to allow Telegraf to receive data from the message bus and store it into influxdb which is scalable.
Plugin Configuration
Configuration of the plugin is divided as follows:
ETCD configuration
Configuration in Telegraf.conf file config/Telegraf/Telegraf.conf(
[WORK_DIR]/IEdgeInsights/Telegraf/config/Telegraf/Telegraf.conf)
ETCD Configuration
As an EII message bus plugin and part of the EII framework, the message bus configuration and plugin’s topic specific configuration is kept in ETCD.
Following is the sample configuration:
{
    "config": {
        "influxdb": {
            "username": "admin",
            "password": "admin123",
            "dbname": "datain"
        },
        "default": {
            "topics_info": [
                "topic-pfx1:temperature:10:2",
                "topic-pfx2:pressure::",
                "topic-pfx3:humidity"
            ],
            "queue_len": 10,
            "num_worker": 2,
            "profiling": "false"
        }
    },
    "interfaces": {
        "Subscribers": [
            {
                "Name": "default",
                "Type": "zmq_tcp",
                "EndPoint": "ia_zmq_broker:60515",
                "Topics": [
                    "*"
                ],
                "PublisherAppName": "ZmqBroker"
            }
        ]
    }
}
Brief Description of the Configuration.
EII’s Telegraf has ‘config’ and ‘interfaces’ sections, where:
“interfaces” are the EII interface details. “config” are:
config:Contains the configuration of the influxdb (“influxdb”) and EII message bus input plugin (“default”). In the above sample configuration, the ” default” is an instance name. This instance name is referenced from the Telegraf’s configuration file config/Telegraf/Telegraf.conf(
[WORK_DIR]/IEdgeInsights/Telegraf/config/Telegraf/Telegraf.conf).topics_info:This is an array of topic prefix configuration, where the user specifies, how the data from the topic prefix should be processed. Following is the interpretation of topic information in every line:
“topic-pfx1:temperature:10:2”:Process data from the topic prefix ‘topic-pfx1’ asynchronously using the dedicated queue of length 10 and dedicated thread pool of size 2. And the processed data will be stored at a measurement named ‘temperature’ in influxdb.
“topic-pfx2:pressure::”:Process data from the topic prefix ‘topic-pfx2’ asynchronously using the global queue and global thread pool. And the processed data will be stored at a measurement named ‘pressure’ in influxdb.
“topic-pfx3:humidity” : Process data synchronously. And the processed data will be stored at a measurement named ‘humidity’ in influxdb.
Note: If topic specific configuration is not mentioned, then by default, data is processed synchronously and the measurement name would be the same as the topic name.
queue_len:Global queue length.
num_worker: Global thread pool size.
profiling: This is to enable the profiling mode of this plugin (value can be either “true” or “false”). In profiling mode, every point will get the following information and will be kept in the same measurement:
Total time spent in plugin (time in ns)
Time spent in queue (in case of asynchronous processing only and time in ns)
Time spend in JSON processing (time in ns)
The name of the thread pool and the thread id which processed the point.
Note
: The name of the global thread pool is “GLOBAL”. For a topic specific thread pool, the name is “for-$topic-name”.*
Configuration at Telegraf.conf File
The plugin instance name is an additional key, kept in the plugin configuration section. This key is used to fetch the configuration from ETCD. The following is the minimum sample configuration with a single plugin instance:
[[inputs.eii_msgbus]]
**instance_name = "default"**
data_format = "json"
json_strict = true
Here, the value default acts as a key in the file config. json([WORK_DIR]/IEdgeInsights/Telegraf/config.json). For this key, there is a configuration in the interfaces and config sections of the file config. json([WORK_DIR]/IEdgeInsights/Telegraf/config.json). So the value of instance_name acts as a connect/glue between the Telegraf configuration config/Telegraf/Telegraf.conf([WORK_DIR]/IEdgeInsights/Telegraf/config/Telegraf/Telegraf.conf) and the ETCD configuration config.json([WORK_DIR]/IEdgeInsights/Telegraf/config.json).
Note
: As it is a Telegraf input plugin, Telegraf’s parser configuration must be in Telegraf. conf file. More information on the telegraf JSON parser plugin can be found at https://github.com/influxdata/telegraf/tree/master/plugins/parsers/json. If there are multiple Telegraf instances, then the location of the Telegraf configuration files would be different. For more details, refer to the Optional: Adding multiple Telegraf instance section.
Advanced: Multiple Plugin Sections of EII Message Bus Input Plugin
Multiple configuration sections of the message bus input plugin is kept in the config/Telegraf/Telegraf.conf(``[WORK_DIR]/IEdgeInsights/Telegraf/config/Telegraf/Telegraf.conf``) file.
Following is an example:
Assume there are two EII apps, one with the AppName “EII_APP1” and another with the AppName “EII_APP2”, which are publishing the data to EII message bus.
The Telegraf’s ETCD configuration:
{
   "config":{
      "subscriber1":{
         "topics_info":[
            "topic-pfx1:temperature:10:2",
            "topic-pfx2:pressure::",
            "topic-pfx3:humidity"
         ],
         "queue_len":100,
         "num_worker":5,
         "profiling":"true"
      },
      "subscriber2":{
         "topics_info":[
            "topic-pfx21:temperature2:10:2",
            "topic-pfx22:pressure2::",
            "topic-pfx23:humidity2"
         ],
         "queue_len":100,
         "num_worker":10,
         "profiling":"true"
      }
   },
   "interfaces":{
      "Subscribers":[
         {
            "Name":"subscriber1",
            "EndPoint":"EII_APP1_container_name:5569",
            "Topics":[
               "*"
            ],
            "Type":"zmq_tcp",
            "PublisherAppName": "EII_APP1"
         },
         {
            "Name":"subscriber2",
            "EndPoint":"EII_APP2_container_name:5570",
            "Topics":[
               "topic-pfx21",
               "topic-pfx22",
               "topic-pfx23"
            ],
            "Type":"zmq_tcp",
            "PublisherAppName": "EII_APP2"
         }
      ]
   }
}
The Telegraf.conf configuration sections:
[[inputs.eii_msgbus]]
instance_name = "subscriber1"
data_format = "json"
json_strict = true

[[inputs.eii_msgbus]]
instance_name = "subscriber2"
data_format = "json"
json_strict = true
Using Input Plugins
By default, the message bus input plugin is disabled. To configure the EII input plugin, uncomment the following lines in config/Telegraf/Telegraf.conf(``[WORK_DIR]/IEdgeInsights/Telegraf/config/Telegraf/Telegraf.conf``) and config/Telegraf/Telegraf_devmode.conf(``[WORK_DIR]/IEdgeInsights/Telegraf/config/Telegraf/Telegraf_devmode.conf``)
```sh
[[inputs.eii_msgbus]]
instance_name = "default"
data_format = "json"
json_strict = true
tag_keys = [
  "my_tag_1",
  "my_tag_2"
]
json_string_fields = [
  "field1",
  "field2"
]
json_name_key = ""
```
Edit config.json(
[WORK_DIR]/IEdgeInsights/Telegraf/config.json) to add message bus input plugin.{ "config": { ... "default": { "topics_info": [ "topic-pfx1:temperature:10:2", "topic-pfx2:pressure::", "topic-pfx3:humidity" ], "queue_len": 10, "num_worker": 2, "profiling": "false" }, ... }, "interfaces": { "Subscribers": [ { "Name": "default", "Type": "zmq_tcp", "EndPoint": "ia_zmq_broker:60515", "Topics": [ "*" ], "PublisherAppName": "ZmqBroker" } ], ... } }
Enable Message Bus Output Plugin in Telegraf
Purpose
To receive the data from Telegraf Input Plugin and publish the data to EII msgbus.
Configuration of the Plugin
Configuration of the plugin is divided into two parts:
ETCD configuration
Configuration in Telegraf.conf file config/Telegraf/Telegraf.conf(
[WORK_DIR]/IEdgeInsights/Telegraf/config/Telegraf/Telegraf.conf)
ETCD configuration
As an EII message bus plugin and part of the EII framework, the message bus configuration and plugin’s topic specific configuration is kept in ETCD.
Following is the sample configuration:
{
    "config": {
        "publisher": {
            "measurements": ["*"],
            "profiling": "false"
        }
    },
    "interfaces": {
        "Publishers": [
            {
                "Name": "publisher",
                "Type": "zmq_tcp",
                "EndPoint": "0.0.0.0:65077",
                "Topics": [
                    "*"
                ],
                "AllowedClients": [
                    "*"
                ]
            }
        ]
    }
}
Brief Description of the Configuration
EII’s Telegraf has ‘config’ and ‘interfaces’ sections, where:
“interfaces” are the EII interface details. “config” are:
config:Contains EII message bus output plugin (“publisher”). In the above sample configuration, the “publisher” is an instance name. This instance name is referenced from the Telegraf’s configuration file config/Telegraf/Telegraf.conf(
[WORK_DIR]/IEdgeInsights/Telegraf/config/Telegraf/Telegraf.conf)measurements:This is an array of measurements configuration, where user specifies, which measurement data should be published in message bus.
profiling:This is to enable the profiling mode of this plugin (value can be either “true” or “false”).
Configuration in Telegraf.conf File
The plugin instance name is an additional key, kept in the plugin configuration section. This key is used to fetch the configuration from ETCD. Following is the minimum, sample configuration with a single plugin instance:
[[outputs.eii_msgbus]]
instance_name = "publisher"
Here, the value ‘publisher’ acts as a key in the file config.json(``[WORK_DIR]/IEdgeInsights/Telegraf/config.json``). The configuration in the ‘interfaces’ and ‘config’ sections of the file config.json(``[WORK_DIR]/IEdgeInsights/Telegraf/config.json``) has this key. Here the value of ‘instance_name’ acts as a connect/glue between the Telegraf configuration config/Telegraf/Telegraf.conf(``[WORK_DIR]/IEdgeInsights/Telegraf/config/Telegraf/Telegraf.conf``) and the ETCD configuration config.json(``[WORK_DIR]/IEdgeInsights/Telegraf/config.json``)
Advanced: Multiple Plugin Sections of Message Bus Output Plugin
Multiple configuration sections of the message bus output plugin is kept in the config/Telegraf/Telegraf.conf(``[WORK_DIR]/IEdgeInsights/Telegraf/config/Telegraf/Telegraf.conf``) file.
The Telegraf’s ETCD configuration:
{
    "config": {
        "publisher1": {
            "measurements": ["*"],
            "profiling": "false"
        },
        "publisher2": {
            "measurements": ["*"],
            "profiling": "false"
        }
    },
    "interfaces": {
        "Publishers": [
            {
                "Name": "publisher1",
                "Type": "zmq_tcp",
                "EndPoint": "0.0.0.0:65077",
                "Topics": [
                    "*"
                ],
                "AllowedClients": [
                    "*"
                ]
            },
            {
                "Name": "publisher2",
                "Type": "zmq_tcp",
                "EndPoint": "0.0.0.0:65078",
                "Topics": [
                    "*"
                ],
                "AllowedClients": [
                    "*"
                ]
            }
        ]
    }
}
The Telegraf.conf configuration:
[[outputs.eii_msgbus]]
instance_name = "publisher1"

[[outputs.eii_msgbus]]
instance_name = "publisher2"
Run Telegraf Input Output Plugin in IPC Mode
Modify the interfaces section of config.json(``[WORK_DIR]/IEdgeInsights/Telegraf/config.json``) to run in IPC mode:
"interfaces": {
    "Subscribers": [
        {
            "Name": "default",
            "Type": "zmq_ipc",
            "EndPoint": {
              "SocketDir": "/EII/sockets",
              "SocketFile": "backend-socket"
            },

            "Topics": [
                "*"
            ],
            "PublisherAppName": "ZmqBroker"
        }
    ],
    "Publishers": [
        {
            "Name": "publisher",
            "Type": "zmq_ipc",
            "EndPoint": {
              "SocketDir": "/EII/sockets",
              "SocketFile": "telegraf-out"
            },
            "Topics": [
                "*"
            ],
            "AllowedClients": [
                "*"
            ]
        }
    ]
}
To Add Multiple Telegraf Instances (Optional)
Users can add multiple instances of Telegarf. To do this, user needs to add environment variable named ‘ConfigInstance’ in the docker-compose.yml file. For every additional telegraf instance, there must be an additional compose section in the docker-compose.yml file.
The configuration for every instance must be in the telegraf image. Following are the standard instances:
For instance named $ConfigInstance the telegraf configuration has to be kept in the repository at config(
[WORK_DIR]/IEdgeInsights/Telegraf/config)/$ConfigInstance/$ConfigInstance.conf (for production mode) and config([WORK_DIR]/IEdgeInsights/Telegraf/config)/$ConfigInstance/$ConfigInstance_devmode.conf (for developer mode).The same files will be available inside the respective container at ‘/etc/Telegraf/$ConfigInstance/$ConfigInstance.conf’ (for production mode) ‘/etc/Telegraf/$ConfigInstance/$ConfigInstance_devmode.conf’ (for developer mode)
Following are some examples:
Example: For $ConfigInstance = ‘Telegraf1’
The location of the Telegraf configuration is config(
[WORK_DIR]/IEdgeInsights/Telegraf/config)/Telegraf1/Telegraf1.conf (for production mode) and config([WORK_DIR]/IEdgeInsights/Telegraf/config)/Telegraf1/Telegraf1_devmode.conf (for developer mode) -The additional docker compose section, which is manually added in the file ‘docker-compose.yml’ is:
ia_telegraf1:
  build:
    context: $PWD/../Telegraf
    dockerfile: $PWD/../Telegraf/Dockerfile
    args:
      EII_VERSION: ${EII_VERSION}
      EII_UID: ${EII_UID}
      EII_USER_NAME: ${EII_USER_NAME}
      TELEGRAF_SOURCE_TAG: ${TELEGRAF_SOURCE_TAG}
      TELEGRAF_GO_VERSION: ${TELEGRAF_GO_VERSION}
      UBUNTU_IMAGE_VERSION: ${UBUNTU_IMAGE_VERSION}
      CMAKE_INSTALL_PREFIX: ${EII_INSTALL_PATH}
  container_name: ia_telegraf1
  hostname: ia_telegraf1
  image: ${DOCKER_REGISTRY}edgeinsights/ia_telegraf:${EII_VERSION}
  restart: unless-stopped
  ipc: "none"
  security_opt:
  - no-new-privileges
  read_only: true
  healthcheck:
    test: ["CMD-SHELL", "exit", "0"]
    interval: 5m
  environment:
    AppName: "Telegraf"
    ConfigInstance: "Telegraf1"
    CertType: "pem,zmq"
    DEV_MODE: ${DEV_MODE}
    no_proxy: "${ETCD_HOST},ia_influxdbconnector"
    NO_PROXY: "${ETCD_HOST},ia_influxdbconnector"
    ETCD_HOST: ${ETCD_HOST}
    ETCD_CLIENT_PORT: ${ETCD_CLIENT_PORT}
    MQTT_BROKER_HOST: ${HOST_IP}
    INFLUX_SERVER: ${HOST_IP}
    INFLUXDB_PORT: $INFLUXDB_PORT
    ETCD_PREFIX: ${ETCD_PREFIX}
  ports:
    - 65078:65078
  networks:
    - eii
  volumes:
    - "vol_temp_telegraf:/tmp/"
    - "vol_eii_socket:${SOCKET_DIR}"
    - ./Certificates/Telegraf:/run/secrets/Telegraf
    - ./Certificates/rootca:/run/secrets/rootca
Note
: If user wants to add Telegraf output plugin in Telegraf instance, modify config.json([WORK_DIR]/IEdgeInsights/Telegraf/config.json), docker-compose.yml([WORK_DIR]/IEdgeInsights/Telegraf/docker-compose.yml) and Telegraf configuration(.conf) files.
Add publisher configuration in config.json(
[WORK_DIR]/IEdgeInsights/Telegraf/config.json):
{
    "config": {

        ...,
        "<output plugin instance_name>": {
            "measurements": ["*"],
            "profiling": "true"
        }
    },
    "interfaces": {
        ...,
        "Publishers": [
            ...,
            {
                "Name": "<output plugin instance_name>",
                "Type": "zmq_tcp",
                "EndPoint": "0.0.0.0:<publisher port>",
                "Topics": [
                    "*"
                ],
                "AllowedClients": [
                    "*"
                ]
            }

        ]
    }
}
Example:
{
    "config": {

        ...,
        "publisher1": {
            "measurements": ["*"],
            "profiling": "true"
        }
    },
    "interfaces": {
        ...,
        "Publishers": [
            ...,
            {
                "Name": "publisher1",
                "Type": "zmq_tcp",
                "EndPoint": "0.0.0.0:65078",
                "Topics": [
                    "*"
                ],
                "AllowedClients": [
                    "*"
                ]
            }

        ]
    }
}
Expose “publisher port” in docker-compose.yml(
[WORK_DIR]/IEdgeInsights/Telegraf/docker-compose.yml) file:ia_telegraf<ConfigInstance number>: ... ports: - <publisher port>:<publisher port>
Example:
ia_telegraf<ConfigInstance number>:
  ...
  ports:
    - 65078:65078
Add eii_msgbus output plugin in Telegraf instance configuration file config(
[WORK_DIR]/IEdgeInsights/Telegraf/config)/$ConfigInstance/$ConfigInstance.conf (for production mode) and config([WORK_DIR]/IEdgeInsights/Telegraf/config)/$ConfigInstance/$ConfigInstance_devmode.conf (for developer mode).[[outputs.eii_msgbus]] instance_name = “
“
Example:
For $ConfigInstance = ‘Telegraf1’
User needs to add the following section in config(
[WORK_DIR]/IEdgeInsights/Telegraf/config)/Telegraf1/Telegraf1.conf (for production mode) and config([WORK_DIR]/IEdgeInsights/Telegraf/config)/Telegraf1/Telegraf1_devmode.conf (for developer mode):[[outputs.eii_msgbus]] instance_name = “publisher1”
To allow the changes to the docker file to take place, run the builder.py script command.
cd [WORK_DIR]/IEdgeInsights/build
python3 builder.py
Following are the commands to provision, build and bring up all the containers:
cd [WORK_DIR]/IEdgeInsights/build/
docker-compose build
docker-compose up -d
Based on the previous example, the user can check that the Telegraf service will have multiple containers using the docker ps command.
Note: The additional configuration is kept in Telegraf/config/$ConfigInstance/telegraf.d in a modular way. For example, create a directory telegraf.d in Telegraf/config/config/$ConfigInstance.
mkdir config/$ConfigInstance/telegraf.d
cd config/$ConfigInstance/telegraf.d
Additional configuration files are kept inside the directory and the following command is used to start the Telegraf in the docker-compose.yml file:
command: ["telegraf -config=/etc/Telegraf/$ConfigInstance/$ConfigInstance.conf -config-directory=/etc/Telegraf/$ConfigInstance/telegraf.d"]
Overview of the Kapacitor
Introduction to the Point-Data Analytics(Time Series Data)
Any integral value that gets generated over time is point data. For examples:
Temperature at a different time in a day.
Number of oil barrels processed per minute.
By doing the analytics over point data, the factory can have an anomaly detection mechanism where PointDataAnalytics is considered.
IEdgeInsights uses the TICK stack to do point data analytics.
It has temperature anomaly detection, an example for demonstrating the time-series data analytics flow.
The high-level flow of the data is:
MQTT-temp-sensor–>Telegraf–>Influx–>Kapacitor–>Influx.
MQTT-temp-sensor simulator sends the data to the Telegraf. Telegraf sends the same data to Influx and Influx sends it to Kapacitor. Kapacitor does anomaly detection and publishes the results back to Influx.
Here, Telegraf is the TICK stack component and supports the number of input plug-ins for data ingestion. Influx is a time-series database. Kapacitor is an analytics engine where users can write custom analytics plug-ins (TICK scripts).
Starting the Example
To start the mqtt-temp-sensor, refer to tools/mqtt-publisher/README.md.
If System Integrator (SI) wants to use the IEdgeInsights only for point data analytics, then analyze Video use case containers ia_video_ingestion and ia_video_analytics in
../build/docker-compose.ymlStarting the EII.
To start the EII in production mode, provisioning must be done. Following are the commands to be executed after provisioning:
cd build
docker-compose build
docker-compose up -d
To start the EII in developer mode, refer to README.
To verify the output, check the output of the following commands:
docker logs -f ia_influxdbconnector
Following is the snapshot of sample output of the ia_influxdbconnector command.
I0822 09:03:01.705940       1 pubManager.go:111] Published message: map[data:point_classifier_results,host=ia_telegraf,topic=temperature/simulated/0 temperature=19.29358085726703,ts=1566464581.6201317 1566464581621377117]
I0822 09:03:01.927094       1 pubManager.go:111] Published message: map[data:point_classifier_results,host=ia_telegraf,topic=temperature/simulated/0 temperature=19.29358085726703,ts=1566464581.6201317 1566464581621377117]
I0822 09:03:02.704000       1 pubManager.go:111] Published message: map[data:point_data,host=ia_telegraf,topic=temperature/simulated/0 ts=1566464582.6218634,temperature=27.353740759929877 1566464582622771952]
Purpose of the Telegraf
Telegraf is a data entry point for IEdgeInsights. It supports many input plugins, which is used for point data ingestion. In the previous example, the MQ Telemetry Transport (MQTT) input plugin of Telegraf is used. Following are the configurations of the plugins:
# # Read metrics from MQTT topic(s)
[[inputs.mqtt_consumer]]
#   ## MQTT broker URLs to be used. The format should be scheme://host:port,
#   ## schema can be tcp, ssl, or ws.
    servers = ["tcp://localhost:1883"]
#
#   ## MQTT QoS, must be 0, 1, or 2
#   qos = 0
#   ## Connection timeout for initial connection in seconds
#   connection_timeout = "30s"
#
#   ## Topics to subscribe to
    topics = [
    "temperature/simulated/0",
    ]
    name_override = "point_data"
    data_format = "json"
#
#   # if true, messages that can't be delivered while the subscriber is offline
#   # will be delivered when it comes back (such as on service restart).
#   # NOTE: If true, client_id MUST be set
    persistent_session = false
#   # If empty, a random client ID will be generated.
    client_id = ""
#
#   ## username and password to connect MQTT server.
    username = ""
    password = ""
In the production mode, the Telegraf configuration file is
Telegraf/config/telegraf.conf([WORK_DIR]/IEdgeInsights/Telegraf/config/Telegraf/Telegraf.conf) and in developer mode,
the Telegraf configuration file is
Telegraf/config/telegraf_devmode.conf([WORK_DIR]/IEdgeInsights/Telegraf/config/Telegraf/Telegraf_devmode.conf).
For more information on the supported input and output plugins refer to https://docs.influxdata.com/telegraf/v1.10/plugins/
Purpose of the Kapacitor
About Kapacitor and UDF
You can write the custom anomaly detection algorithm in PYTHON/GOLANG. And these algorithms are called as UDF (user-defined function). These algorithms follow certain API standards for the Kapacitor to call these UDFs at run time.
IEdgeInsights has the sample UDF (user-defined function) written in GOLANG. Kapacitor is subscribed to the InfluxDB, and gets the temperature data. After fetching this data, Kapacitor calls the UDF, which detects the anomaly in the temperature and sends back the results to Influx.
The sample Go UDF is at go_classifier.go(
[WORK_DIR]/IEdgeInsights/Kapacitor/udfs/go_classifier.go) and the TICKscript is at go_point_classifier.tick([WORK_DIR]/IEdgeInsights/Kapacitor/tick_scripts/go_point_classifier.tick)The sample Python UDF is at py_classifier.py(
[WORK_DIR]/IEdgeInsights/Kapacitor/udfs/py_classifier.py) and the TICKscript is at py_point_classifier.tick([WORK_DIR]/IEdgeInsights/Kapacitor/tick_scripts/py_point_classifier.tick)For more details, on Kapacitor and UDF, refer to the following links:
Writing a sample UDF at anomaly detection
UDF and kapacitor interaction socket_udf
In production mode, the Kapacitor configuration file is Kapacitor/config/kapacitor.conf(
[WORK_DIR]/IEdgeInsights/Kapacitor/config/kapacitor.conf) and in developer mode, the Kapacitor configuration file is Kapacitor/config/kapacitor_devmode.conf([WORK_DIR]/IEdgeInsights/Kapacitor/config/kapacitor_devmode.conf).
Custom UDFs available in the UDF([WORK_DIR]/IEdgeInsights/Kapacitor/udfs) Directory
UNIX Socket based UDFs
go_classifier.go:Filters the points based on temperature (data >20 and <25 filtered out).
py_classifier.py:Filters the points based on temperature (data >20 and <25 filtered out).
profiling_udf.go:Add the profiling (time taken to process the data) data in the points.
temperature_classifier.go:Filter the points based on temperature (data <25 filtered out).
humidity_classifier.py:Filter the points based on humidity (data <25 filtered out).
Process based UDFs
rfc_classifier.py:Random Forest Classification algo sample. This UDF is used for profiling udf as well.
Steps to Configure the UDFs in the Kapacitor
Keep the custom UDFs in the udfs(
[WORK_DIR]/IEdgeInsights/Kapacitor/udfs) directory and the TICKscript in the tick_scripts([WORK_DIR]/IEdgeInsights/Kapacitor/tick_scripts) directory.Keep the training data set (if any) required for the custom UDFs in the training_data_sets(
[WORK_DIR]/IEdgeInsights/Kapacitor/training_data_sets) directory.For python UDFs, any external python package dependency needs to be installed. To install the python package using pip, it can be added in the requirements.txt(
[WORK_DIR]/IEdgeInsights/Kapacitor/requirements.txt) file and to install the python package using conda, it can be added in the conda_requirements.txt([WORK_DIR]/IEdgeInsights/Kapacitor/conda_requirements.txt) file.Modify the UDF section in the kapacitor.conf(
[WORK_DIR]/IEdgeInsights/Kapacitor/config/kapacitor.conf) and in the kapacitor_devmode.conf([WORK_DIR]/IEdgeInsights/Kapacitor/config/kapacitor_devmode.conf). Mention the custom UDF in the configuration, for example:[udf.functions.customUDF] socket = "/tmp/socket_file" timeout = "20s"
For go or python based UDF, update the values of keys named “type”, “name”, “tick_script”, “task_name”, in the config.json(
[WORK_DIR]/IEdgeInsights/Kapacitor/config.json)file, for example:"task": [{ "tick_script": "py_point_classifier.tick", "task_name": "py_point_classifier", "udfs": [{ "type": "python", "name": "py_classifier" }] }]
For TICKscript only UDF, update the values of keys named “tick_script”, “task_name”, in the config.json(
[WORK_DIR]/IEdgeInsights/Kapacitor/config.json)file, for example:"task": [{ "tick_script": "simple_logging.tick", "task_name": "simple_logging" }]
Note:
By default, go_classifier and rfc_classifier is configured.
Mention the TICKscript UDF function same as configured in the Kapacitor configuration file. For example, UDF Node in the TICKscript:
@py_point_classifier()should be same as
[udf.functions.py_point_classifier]
   socket = "/tmp/socket_file"
   timeout = "20s"
go or python based UDF should listen on the same socket file as mentioned in the the UDF section in the kapacitor.conf(
[WORK_DIR]/IEdgeInsights/Kapacitor/config/kapacitor.conf) and in the kapacitor_devmode.conf([WORK_DIR]/IEdgeInsights/Kapacitor/config/kapacitor_devmode.conf). For example:[udf.functions.customUDF] socket = "/tmp/socket_file" timeout = "20s"
For a process based UDFs, provide the correct path of the code within the container in the kapacitor.conf(
[WORK_DIR]/IEdgeInsights/Kapacitor/config/kapacitor.conf) and in the kapacitor_devmode.conf([WORK_DIR]/IEdgeInsights/Kapacitor/config/kapacitor_devmode.conf). By default, the files and directories will be copied into the container under the “/OpenEII” directory. It is recommended to keep the custom UDFs in the udfs([WORK_DIR]/IEdgeInsights/Kapacitor/udfs) directory, the path of the custom UDF will be “/OpenEII/udfs/customUDF_name” as shown in below example. If the UDF is kept in different path, modify the path in the args accordingly.The PYTHONPATH of the Kapacitor agent directory is “/OpenEII/go/src/github.com/influxdata/kapacitor/udf/agent/py/”. Following example shows how to pass:
[udf.functions.customUDF]
   prog = "python3.7"
   args = ["-u", "/EII/udfs/customUDF"]
   timeout = "60s"
   [udf.functions.customUDF.env]
      PYTHONPATH = "/go/src/github.com/influxdata/kapacitor/udf/agent/py/"
Perform the provisioning and run the EII stack.
Steps to Run the Samples of Multiple UDFs in a Single Task and Multiple Tasks using Single UDF
Refer to the samples/README
Kapacitor Input and Output Plugins
Purpose of Plugins
The plugins allow Kapacitor to interact directly with EII Message Bus. They use message bus publisher or subscriber interface. Using these plugins Kapacitor receives data from various EII publishers and sends data to various EII subscribers. Hence, it’s possible to have a time-series use case without InfluxDB and Kapacitor as independent analytical engine.
A simple use case flow is as follows:
MQTT-temp-sensor–>Telegraf–>Kapacitor–>TimeseriesProfiler
Using Input Plugin
Following are the steps using input Plugins:
Configure the EII input plugin in config/kapacitor.conf(
[WORK_DIR]/IEdgeInsights/Kapacitor/config/kapacitor.conf) and config/kapacitor_devmode.conf([WORK_DIR]/IEdgeInsights/Kapacitor/config/kapacitor_devmode.conf)
For example:
[eii]
  enabled = true
Edit config.json(
[WORK_DIR]/IEdgeInsights/Kapacitor/config.json) to add a subscriber under interfaces.
For example, to receive data published by Telegraf:
TCP mode
       "Subscribers": [
           {
               "Name": "telegraf_sub",
               "Type": "zmq_tcp",
               "EndPoint": "ia_telegraf:65077",
               "PublisherAppName": "Telegraf",
               "Topics": [
                   "*"
               ]
           }
       ]

**IPC mode**
"Subscribers": [
    {
        "Name": "telegraf_sub",
        "Type": "zmq_ipc",
        "EndPoint": {
            "SocketDir": "/EII/sockets",
            "SocketFile": "telegraf-out"
        },
        "PublisherAppName": "Telegraf",
        "Topics": [
            "*"
        ]
    }
]
Note
For IPC mode, we need to specify the ‘EndPoint’ as a dict of ‘SocketDir’ and ‘SocketFile’, where ‘Topics’ is [*] (as in the previous example). For a single topic the ‘EndPoint’ is [**] (as in the example of Kapacitor output plugin).
    "EndPoint": "/EII/sockets"

The received data is available in the 'EII' storage for the TICKscript.
Create or modify a TICKscript to process the data and configure the same in config.json(
[WORK_DIR]/IEdgeInsights/Kapacitor/config.json). For example, use the stock tick_scripts/eii_input_plugin_logging.tick([WORK_DIR]/IEdgeInsights/Kapacitor/tick_scripts/eii_input_plugin_logging.tick) which logs the data received from ‘EII’ storage onto the kapacitor log file (residing in the container at /mp/log/kapacitor/kapacitor.log)."task": [ { "tick_script": "eii_input_plugin_logging.tick", "task_name": "eii_input_plugin_logging" } ]
Perform the provisioning and run the EII stack.
The subscribed data is available in the previous log file, which is seen by executing the following command:
docker exec ia_kapacitor tail -f /tmp/log/kapacitor/kapacitor.log
Using Output Plugin
Following are the steps using output Plugins:
Create or modify a TICKscript to use ‘eiiOut’ node to send the data using publisher interface. Following is an example to modify the profiling UDF:
dbrp "eii"."autogen"

var data0 = stream
   |from()
           .database('eii')
           .retentionPolicy('autogen')
           .measurement('point_data')
   @profiling_udf()
   |eiiOut()
           .pubname('sample_publisher')
           .topic('sample_topic')
Add a publisher interface to config.json(
[WORK_DIR]/IEdgeInsights/Kapacitor/config.json) with the same publisher name and topic that is ‘sample_publisher’ and ‘sample_topic’ respectively as seen in the previously example.
For example:
TCP mode
       "Publishers": [
           {
               "Name": "sample_publisher",
               "Type": "zmq_tcp",
               "EndPoint": "0.0.0.0:65034",
               "Topics": [
                   "sample_topic"
               ],
               "AllowedClients": [
                   "TimeSeriesProfiler"
               ]
           }
       ]

**IPC mode**
"Publishers": [
    {
        "Name": "sample_publisher",
        "Type": "zmq_ipc",
        "EndPoint": "/EII/sockets",
        "Topics": [
            "sample_topic"
        ],
        "AllowedClients": [
            "TimeSeriesProfiler"
        ]
    }
]
Perform provisioning service and run the EII stack.
Using Input or Output Plugin with RFC UDF
Following are the steps using input or output Plugins with RFC UDF:
Add the RFC task to config.json(
[WORK_DIR]/IEdgeInsights/Kapacitor/config.json):"task": [ { "tick_script": "rfc_task.tick", "task_name": "random_forest_sample", "udfs": [{ "type": "python", "name": "rfc_classifier" }] } ]
Modify the rfc_task.tick(
[WORK_DIR]/IEdgeInsights/Kapacitor/tick_scripts/rfc_task.tick) as seen in the following example:dbrp "eii"."autogen" var data0 = stream |from() .database('eii') .retentionPolicy('autogen') .measurement('ts_data') |window() .period(3s) .every(4s) data0 @rfc() |eiiOut() .pubname('sample_publisher') .topic('sample_topic')
Modify the Kapacitor conf files Kapacitor/config/kapacitor.conf(
[WORK_DIR]/IEdgeInsights/Kapacitor/config/kapacitor.conf) and Kapacitor/config/kapacitor_devmode.conf([WORK_DIR]/IEdgeInsights/Kapacitor/config/kapacitor_devmode.conf) UDF section to remove Go classifier UDF related configurations since this conflicts with the existing python RFC UDF configuration:# Configuration for UDFs (User Defined Functions) [udf.functions] # [udf.functions.go_point_classifier] # socket = "/tmp/point_classifier" # timeout = "20s"
Add a publisher interface to config.json(
[WORK_DIR]/IEdgeInsights/Kapacitor/config.json) with the same publisher name and topic that is ‘sample_publisher’ and ‘sample_topic’ respectively as in the previous example.For example:
TCP mode
"Publishers": [
    {
        "Name": "sample_publisher",
        "Type": "zmq_tcp",
        "EndPoint": "0.0.0.0:65034",
        "Topics": [
            "sample_topic"
        ],
        "AllowedClients": [
            "TimeSeriesProfiler",
            "EmbSubscriber",
            "GoSubscriber"
        ]
    }
]
IPC mode
"Publishers": [
    {
        "Name": "sample_publisher",
        "Type": "zmq_ipc",
        "EndPoint": "/EII/sockets",
        "Topics": [
            "sample_topic"
        ],
        "AllowedClients": [
            "TimeSeriesProfiler",
            "EmbSubscriber",
            "GoSubscriber"
        ]
    }
]
Perform provisioning service, build and run the EII stack.
Steps to Independently Build and Deploy the Kapacitor Service
Note
For running 2 or more microservices, we recommend that users try the use case-driven approach for building and deploying as mentioned in Generate Consolidated Files for a Subset of Edge Insights for Industrial Services
Steps to Independently Build the Kapacitor Service
Note
When switching between independent deployment of the service with and without the configuration manager agent service dependency, one would run into issues with the docker-compose build w.r.t the Certificates folder existence. As a workaround, run the command sudo rm -rf Certificates to proceed with docker-compose build.
To independently build the Kapacitor service, complete the following steps:
The downloaded source code should have a directory named Kapacitor:
cd IEdgeInsights/Kapacitor
Copy the IEdgeInsights/build/.env file using the following command in the current folder
cp ../build/.env .
NOTE: Update the HOST_IP and ETCD_HOST variables in the .env file with your system IP.
# Source the .env using the following command:
set -a && source .env && set +a
Independently build
docker-compose build
Steps to Independently Deploy the Kapacitor Service
You can deploy the Kapacitor service in any of the following two ways:
Deploy the Kapacitor Service without the Config Manager Agent Dependency
Run the following commands to deploy the Kapacitor service without Configuration Manager Agent dependency:
# Enter the Kapacitor directory
cd IEdgeInsights/Kapacitor
Copy the IEdgeInsights/build/.env file using the following command in the current folder, if not already present.
cp ../build/.env .Note: Ensure that
docker psis clean anddocker network lsmust not have EII bridge network.
Update .env file for the following:
1. HOST_IP and ETCD_HOST variables with your system IP.
2. `READ_CONFIG_FROM_FILE_ENV` value to `true` and `DEV_MODE` value to `true`.

Source the .env using the following command:
set -a && source .env && set +a
# Run the service
docker-compose -f docker-compose.yml -f docker-compose-dev.override.yml up -d
Note
Kapacitor container restarts automatically when its config is modified in config.json file.
If user is updating the config.json file using vi or vim editor, it is required to append the set backupcopy=yes in ~/.vimrc so that the changes done on the host machine config.json gets reflected inside the container mount point.
Deploy the Kapacitor Service with the Config Manager Agent Dependency
Run the following commands to deploy the Kapacitor service with the Config Manager Agent dependency:
Note
Ensure that the Config Manager Agent image present in the system. If not, build the Config Manager Agent locally when independently deploying the service with Config Manager Agent dependency.
# Enter the Kapacitor directory
cd IEdgeInsights/Kapacitor
Copy the IEdgeInsights/build/.env file using the following command in the current folder, if not already present.
cp ../build/.env .Note: Ensure that
docker psis clean anddocker network lsdoesn’t have EII bridge networks.
Update .env file for following:
1. HOST_IP and ETCD_HOST variables with your system IP.
2. `READ_CONFIG_FROM_FILE_ENV` value is set to `false`.
Copy the docker-compose.yml from IEdgeInsights/ConfigMgrAgent as docker-compose.override.yml in IEdgeInsights/Kapacitor.
cp ../ConfigMgrAgent/docker-compose.yml docker-compose.override.yml
Copy the builder.py with standalone mode changes from IEdgeInsights/build directory
cp ../build/builder.pyRun the builder.py in standalone mode, this will generate eii_config.json and update docker-compose.override.yml
python3 builder.py -s trueBuilding the service (This step is optional for building the service if not already done in the
Independently buildablestep above)docker-compose buildFor running the service in PROD mode, run the below command:
NOTE: Make sure to update
DEV_MODEtofalsein .env while running in PROD mode and source the .env using the commandset -a && source .env && set +a.docker-compose up -dFor running the service in DEV mode, run the below command:
NOTE: Make sure to update
DEV_MODEtotruein .env while running in DEV mode and source the .env using the commandset -a && source .env && set +a.docker-compose -f docker-compose.yml -f docker-compose-dev.override.yml -f docker-compose.override.yml up -d
Troubleshooting
If Kapacitor build fails with the ‘broken pipe’ related errors then add the following line to the conda_requirements.txt([WORK_DIR]/IEdgeInsights/Kapacitor/conda_requirements.txt) and retry the build:
scikit-learn==1.0.0
Time Series Python UDFs Development
In the DEV mode (DEV_MODE=true in [WORK_DIR]/IEdgeInsights/build/.env), the Python UDFs are being volume mounted inside the Kapacitor container image that is seen in it’s docker-compose-dev.override.yml. This gives the flexibility for the developers to update their UDFs on the host machine and see the changes being reflected in Kapacitor. This is done by just restarting the Kapactior container without the need to rebuild the Kapacitor container image.
DataStore
For more details see the DataStore Microservice section.
Export Services
Edge-to-Cloud Bridge for Microsoft Azure Overview
Note
For the various scripts and commands mentioned in this document to work, place the source code for this project in the
IEdgeInsightsdirectory in the source code for EII.
The Edge-to-Cloud Bridge for Microsoft Azure* service serves as a connector between EII and the Microsoft Azure IoT Edge Runtime ecosystem. It does this by allowing the following forms of bridging:
Publishing of incoming data from EII onto the Azure IoT Edge Runtime bus
Storage of incoming images from the EII video analytics pipeline into a local instance of the Azure Blob Storage service
Translation of configuration for EII from the Azure IoT Hub digital twin for the bridge into ETCD via the EII Configuration Manager APIs
This code base is structured as an Azure IoT Edge Runtime module. It includes the following:
Deployment templates for deploying the EII video analytics pipeline with the bridge on top of the Azure IoT Edge Runtime
The Edge-to-Cloud Bridge for Microsoft Azure* service module
A simple subscriber on top of the Azure IoT Edge Runtime for showcasing the end-to-end transmission of data
Various utilities and helper scripts for deploying and developing on the Edge-to-Cloud Bridge for Microsoft Azure* service
The following sections will cover the configuration/usage of the Edge-to-Cloud Bridge for Microsoft Azure* service, the deployment of EII on the Azure IoT Edge Runtime, as well as the usage of the tools and scripts included in this code base for development.
Note
The following sections assume an understanding of the configuration for EII. It is recommended that you read the main README and User Guide for EII prior to using this service.
Prerequisites and Setup
To use and develop with the Edge-to-Cloud Bridge for Microsoft Azure* service there are a few steps which must be taken to configure your environment. The setup must be done to configure your Azure Cloud account, your development system, and also the node which you are going to deploy the Edge-to-Cloud Bridge for Microsoft Azure* service on.
The following sections cover the setup for the first two environments listed. Setting up your system for a single-node deployment will be covered in the following Single-Node Azure IoT Edge Deployment section.
Note
When you deploy with Azure IoT Hub you will also need to configure the Azure IoT Edge Runtime and EII on your target device.
Azure Cloud Setup
Prior to using the Edge-to-Cloud Bridge for Microsoft Azure* service there are a few cloud services in Azure which must be initialized.
Primarily, you need an Azure Container Registry instance, an Azure IoT Hub, as well as an Azure IoT Device. Additionally, if you wish to use the sample ONNX UDF in EII to download a ML/DL model from AzureML, then you must follow a few steps to get this configured as well. For these steps, refer to following Setting up AzureML
To create these instances, follow the guides provided by Microsoft:
Note
In the quickstart guides, it is recommended that you create an Azure Resource Group. This is a good practice as it makes for easy clean up of your Azure cloud environment.
IMPORTANT: In the previous tutorials, you will receive credentials/connection strings for your Azure Container Registry, Azure IoT Hub, and Azure IoT Device. Save these for later, as they will be important for setting up your development and single node deployment showcased in this README.
All of the tutorials provided above provide options for creating these instances via Visual Studio Code, the Azure Portal, or the Azure CLI. If you wish to use the Azure CLI, it is recommended that you follow the Development System Setup instructions.
Setting up AzureML
To use the sample EII ONNX UDF, you must do the following:
Important
During the setup process provided for step 2 above, you will run a command similar to the following:
az ad sp create-for-rbac --sdk-auth --name ml-auth
After executing this command you will see a JSON blob printed to your console
window. Save the clientId, clientSecret, subscriptionId, and tenantId
for configuring the sample ONNX EII UDF later.
If you already have an ONNX model you wish to push to your AzureML Workspace, then follow these instructions to push your model.
If you do not have a model, and want an easy model to use, follow this notebook provided my Microsoft to train a simple model to push to your AzureML Workspace.
Also, you can find pre-trained models in the ONNX Model Zoo.
Development System Setup
Note
: It is recommended to have this development setup done on a system connected with open network as it is been observed that some of the azure core modules may not be able to connect to azure portal due to firewall blocking ports when running behind corporate proxy
The development system will be used for the following actions:
Building and pushing the EII containers (including the bridge) to your Azure Container Registry
Creating your Azure IoT Hub deployment manifest
Deploying your manifest to a single node
For testing purposes, your development system can serve to do the actions detailed above, as well as being the device you use for your single-node deployment. This should not be done in a production environment, but it can be helpful when familiarizing yourself with the Edge-to-Cloud Bridge for Microsoft Azure* service.
First, setup your system for building EII. To do this, follow the instructions
detailed in the main EII README and the EII User Guide. At the end, you should
have installed Docker, Docker Compose, and other EII Python dependencies for
the Builder script in the ../build/ directory.
Once this is completed, install the required components to user the Azure CLI
and development tools. The script ./tools/install-dev-tools.sh automates this
process. To run this script, execute the following command:
Note
It is highly recommended that you use a python virtual environment to install the python packages, so that the system python installation doesn’t get altered. Details on setting up and using python virtual environment can be found here: https://www.geeksforgeeks.org/python-virtual-environment/
If one encounter issues with conflicting dependencies between python packages, upgrade the pip version:
pip3 install -U pipand try.
sudo -H -E -u ${USER} ./tools/install-dev-tools.sh
Set the PATH environmental variable as mentioned in the terminal
where you are using iotedgedev and iotedgehubdev commands:
export PATH=~/.local/bin:$PATH
Note
The
-u ${USER}flag above allows the Azure CLI to launch your browser (if it can) so you can login to your Azure account.Occasionally, pip’s local cache can get corrupted. If this happens, pip may
SEGFAULT. In the case that this happens, delete the~/.localdirectory on your system and re-run the script mentioned above. You may consider creating a backup of this directory just in case.
While running this script you will be prompted to sign-in to your Azure account so you can run commands from the Azure CLI that interact with your Azure instance.
This script will install the following tools:
Azure CLI
Azure CLI IoT Edge/Hub Extensions
Azure
iotedgehubdevdevelopment toolAzure
iotedgedevdevelopment tool
Next, login to your Azure Container Registry with the following command:
az acr login --name <ACR Name>
Note
Fill in <ACR Name> with the name of your Azure Container Registry
IMPORTANT NOTE:
Refer to the list of supported services at the end of this README for the services which can be pushed to an ACR instance. Not all EII services are supported by and validated to work with the Edge-to-Cloud Bridge for Microsoft Azure* service.
Build and Push Edge Insights for Industrial Containers
Note
By following the steps, the Edge-to-Cloud Bridge for Microsoft Azure* service and Simple Subscriber Azure IoT Modules will be pushed to your ACR instance as well.
After setting up your development system, build and push the EII containers to your Azure Contianer Registry instance. Note that the Edge-to-Cloud Bridge for Microsoft Azure* service only supports a few of the EII services currently. Before building and pushing your EII containers, be sure to look at the Supported Edge Insights for Industrial Services section, so as to not build/push uneeded containers to your registry.
To do this go to the ../build/ directory in the EII source code, modify the DOCKER_REGISTRY variable in the ../build/.env file to point to your Azure Container Registry.
Next, execute the following commands:
python3 builder.py -f usecases/video-streaming-azure.yml
docker-compose build # OPTIONAL if the docker image is already available in the docker hub
docker-compose push ia_configmgr_agent ia_etcd_ui ia_video_ingestion ia_video_analytics ia_azure_simple_subscriber # OPTIONAL if the docker image is already available in the docker hub
To use Edge Video Analytics Microservice, create a new yml file in usecases folder (evas-azure.yml) :-
AppContexts:
- ConfigMgrAgent
- EdgeVideoAnalyticsMicroservice/eii
- EdgeToAzureBridge
Next, execute the following commands:
python3 builder.py -f usecases/evas-azure.yml
docker-compose build # OPTIONAL if the docker image is already available in the docker hub
docker-compose push # OPTIONAL if the docker image is already available in the docker hub
For more detailed instructions on this process, refer to the EII README and User Guide.
Single-Node Azure IoT Edge Deployment
Note
Outside of the Azure ecosystem, EII can be deployed and communicate
across nodes. In the Azure IoT Edge ecosystem this is not possible with EII.
All EII services must be running on the same edge node. However, you can
deploy EII on multiple nodes, but intercommunication between the nodes will
not work.
Important Note:
If you are using TCP communication between VI or VA and the Edge-to-Cloud Bridge for Microsoft Azure* service,
then you must modify the AllowedClients list under the Publishers section
of the interfaces configuration of VI or VA to include EdgeToAzureBridge.
This must be done prior to provisioning to that the proper certificates will
be generated to encrypt/authenticate connections.
In the Azure IoT ecosystem you can deploy to single-nodes and you can do bulk deployments. This section will cover how to deploy the Edge-to-Cloud Bridge for Microsoft Azure* service and associated EII services to a single Linux edge node. For more details on deploying modules at scale with the Azure IoT Edge Runtime, refer to Deploy IoT Edge modules at scale using the Azure portal
Note that this section will give a high-level overview of how to deploy the modules with the Azure CLI. For more information on developing and deploying Azure modules, refer to Develop IoT Edge modules with Linux containers.
The deloyment of the Azure IoT Edge and the EII modules can be broken down into the following steps:
Provisioning
Configuring EII
Configuring Azure IoT Deployment Manifest
Deployment
Prior to deploying a single Azure IoT Edge node you must have already configured your Azure cloud instance (refer to the instructions in the Azure Cloud Setup section). Additionally, you need to have already built and pushed the EII services to your Azure Container Registry (follow the instructions in the Build and Push Edge Insights for Industrial Containers section).
Provided you have met these two prerequisites, follow the steps to do a single node deployment with the Edge-to-Cloud Bridge for Microsoft Azure* service on the Azure IoT Edge Runtime.
Step 1 - Provisioning
The provisioning must take place on the node you wish to deploy your Azure IoT Edge modules onto.
Note
This may be your development system, which was setup earlier. Keep in mind, however, that having your system setup as a development system and a targeted node for a single-node deployment should never be done in production.
First, you must then install the Azure IoT Edge Runtime on your target deployment system. To do that, follow the instructions provided by Microsoft in this guide.
Next, you must provision on your target deployment system. This provisioning is supported by the configmanager agent azure module itself.
While provisioning on your system, note that you only need to setup the Video Ingesiton and/or the Video Analytics containers. All other services are not supported by the Edge-to-Cloud Bridge for Microsoft Azure* service currently.
Be sure to note down which directory you generate your certificates into, this will be important later. Unless, you are running EII in dev mode, in that case you will have no certificates generated.
IMPORTANT NOTE:
If you previously installed EII outside of Azure on your system, then make sure
that all of the EII containers have been stopped. You can do this by going to
the build/ directory in the EII source code and running the following command:
docker-compose down
This will stop and remove all of the previously running EII containers, allowing the Edge-to-Cloud Bridge for Microsoft Azure* service to run successfully.
Step 2 - Configuring Edge Insights for Industrial
This step should be done from your development system, and not the edge node you are deploying EII onto. The configuration you will do during this setup will allow your system to deploy EII to your edge node. As noted earlier, for development and testing purposes this could be the same system as your targeted edge device, but this is not recommended in a production environment.
To configure EII, modify the build/eii_config.json file. This
should have been generated when the build/builder.py script was executed
when building/pushing the EII containers to your ACR instance. If it does not
exist, run this script based on the instructions provided in the EII README.
Next, configure the build/.env file. You must make sure to modify the following
values in the .env file:
DOCKER_REGISTRY- This should have been set when building/pushing the EIIcontainers to your ACR instance. Make sure it is set to the URL for your ACR instance.
HOST_IP- This must be the IP address of the edge node you are deployingyour containers to
ETCD_HOST- This should be set to the same value as yourHOST_IPaddressDEV_MODE- Set this to the same value you used when provisioning your edge nodein the previous step
Next, in the EdgeToAzureBridge/ source directory, modify the .env file. Make
sure to set the following values:
EII_CERTIFICATES- The directory with the EII certificates on your edge systemAZ_CONTAINER_REGISTY_USERNAME- User name for the container registry login (obtained during creation)AZ_CONTAINER_REGISTY_PASSWORD- Password for the container registry login (obtained during creation)IMPORTANT NOTE: Make sure to surround the password in single quotes, i.e.
', because bash .. code-block:may escape certain characters when the file is read, leading to incorrect configuration
AZ_BLOB_STORAGE_ACCOUNT_NAME- (OPTIONAL) User name for the local Azure Blob Storage instance
IMPORTANT NOTE #1:
It is important to note that for the AZ_CONTAINER_REGISTY_PASSWORD variable you
must wrap the password in single quotes, i.e. '. Otherwise, there may be
characters that get escaped in a weird way when the values are populated into
your deployment manifest leading to configuration errors.
IMPORTANT NOTE #2:
If you wish to use the sample EII ONNX UDF, now is the time to configure the UDF to run. Refer to the Sample Edge Insights for Industrial ONNX UDF configuration section for how to configure the UDF.
Once the following step has been completed, then you should have correctly configured
.env files to deploying EII via Azure. If some of the values were incorrect, then
you will encounter issues in the proceeding steps.
Step 3 - Configuring Azure IoT Deployment Manifest
Once you have your target edge system provisioned and EII configured, you need to create your Azure IoT Hub deployment manifest. The Edge-to-Cloud Bridge for Microsoft Azure* service provides some convenience scripts to ease this process.
Note
These steps should be done from your development system setup in the Development System Setup section. Note, that for testing and development purposes, these could be the same system.
To generate your deployment manifest template for VideoIngestion and VideoAnalytics use case, execute the following command:
# Before running the following command. Replace "edge_video_analytics_results" to "camera1_stream_results"
# in the config/templates/edge_to_azure_bridge.template.json file
./tools/generate-deployment-manifest.sh example ia_configmgr_agent edge_to_azure_bridge SimpleSubscriber ia_video_ingestion ia_video_analytics
To generate the deployment manifest template for Edge Video Analytics microservice, execute te following command.
./tools/generate-deployment-manifest.sh example ia_configmgr_agent edge_to_azure_bridge SimpleSubscriber edge_video_analytics_microservice
Note
If you are using Azure Blob Storage, include
AzureBlobStorageonIoTEdgein the argument list above.When you run the command above, it will pull some values from your EII
build/.envfile. If thebuild/.envfile is configured incorrectly, you may run into issues.
The above command will generate two files: ./example.template.json and config/example.amd64.json. The first is a deployment template, and the second is the fully populated/generated configuration for Azure IoT Hub. In executing the script above, you should have a manifest which includes the Edge-to-Cloud Bridge for Microsoft Azure* service, Simple Subscriber, as well as the EII video ingestion service.
The list of services given to the bash script can be changed if you wish to run different services.
You may want/need to modify your ./example.template.json file after running
this command. This could be because you wish to change the topics that VI/VA use
or because you want to configure the Edge-to-Cloud Bridge for Microsoft Azure* service in some different way. If you modify this file, you must regenerate the ./config/example.amd64.json file. To do this, execute the following command:
iotedgedev genconfig -f example.template.json
If you wish to modify your eii_config.json file after generating your template,
you can re-add this to the Edge-to-Cloud Bridge for Microsoft Azure* service digital twin by running the following
command:
python3 tools/serialize_eii_config.py example.template.json ../build/eii_config.json
If all of the commands above ran correctly, then you will have a valid *.template.json file and a valid config/*.amd64.json file.
If, for some reason, these commands fail, revisit Step 2 and make sure all of your environmental variables are set correctly. And if that does not resolve your issue, verify that your development system is setup correctly by revisiting the Development System Setup section.
Step 4 - Deployment
Now that you have generated your deployment manifest, deploy the modules to your Azure IoT Edge Device using the Azure CLI command is follows:
az iot edge set-modules -n <azure-iot-hub-name> -d <azure-iot-edge-device-name> -k config/<deployment-manifest>
If this command run successfully, then you will see a large JSON string print out on the console with information on the deployment which it just initiated. If it failed, then the Azure CLI will output information on the potential reason for the failure.
Provided all of the setups above ran correctly, your edge node should now be running your Azure IoT Edge modules, the Edge-to-Cloud Bridge for Microsoft Azure* service, and the EII services you selected.
It is possible that for the Edge-to-Cloud Bridge for Microsoft Azure* service (and any Python Azure IoT Edge modules) you will see that the service crashes the first couple of times it attempts to come up on your edge system with an exception similar to the following:
Traceback (most recent call last):
    File "/usr/local/lib/python3.7/site-packages/azure/iot/device/common/mqtt_transport.py", line 340, in connect
        host=self._hostname, port=8883, keepalive=DEFAULT_KEEPALIVE
    File "/usr/local/lib/python3.7/site-packages/paho/mqtt/client.py", line 937, in connect
        return self.reconnect()
    File "/usr/local/lib/python3.7/site-packages/paho/mqtt/client.py", line 1071, in reconnect
        sock = self._create_socket_connection()
    File "/usr/local/lib/python3.7/site-packages/paho/mqtt/client.py", line 3522, in _create_socket_connection
        return socket.create_connection(addr, source_address=source, timeout=self._keepalive)
    File "/usr/local/lib/python3.7/socket.py", line 728, in create_connection
        raise err
    File "/usr/local/lib/python3.7/socket.py", line 716, in create_connection
        sock.connect(sa)
    ConnectionRefusedError: [Errno 111] Connection refused
This occurs because the container is starting before the edgeHub container for
the Azure IoT Edge Runtime has come up, and so it it unable to connect. Once the
edgeHub container is fully launched, then this should go away and the containers
should launch correctly.
If everything is running smoothly, you should see messages being printed in the Simple Subscriber service using the following command:
docker logs -f SimpleSubscriber
For more debugging info, refer to the following section.
Helpful Debugging Commands
If you are encountering issues, the following commands can help with debugging:
Azure IoT Edge Runtime Daemon Logs:
sudo iotedge system logs -- -fContainer Logs:
docker logs -f <CONTAINER-NAME>
Final Notes
When deploying with Azure IoT Edge Runtime there are many security considerations to be taken into account. Consult the following Microsoft resources regarding the security in your deployments.
Configuration
The configuration of the Edge-to-Cloud Bridge for Microsoft Azure* service is a mix of the configuration for the EII services, the Azure Bridge module, and configuration for the other Azure IoT Edge Modules (i.e. the Simple Subscriber, and the Azure Blob Storage modules). All of this configuration is wrapped up into your deployment manifest for Azure IoT Hub.
The following sections cover the configuration of the aforementioned servies and then the generation of your Azure Deployment manifest.
Edge-to-Cloud Bridge for Microsoft Azure* service
The Edge-to-Cloud Bridge for Microsoft Azure* service spans EII and Azure IoT Edge Runtime environments, as such its configuration is a mix of EII configuration and Azure IoT Edge module configuration properties. The configuration of the bridge is split between environmental variables specified in your Azure IoT Hub deployment manifest and the module’s digital twin. Additionally, the digital twin for the Azure Bridge module contains the entire configuration for the EII services running in your edge environment.
The configuration of the EII Message Bus is done in a method similar to that of
the other EII services, such as the Video Analytics service. To provided the
configuration for the topics which the bridge should subscribe to,
you must set the Subscribers list in the config.json([WORK_DIR]/IEdgeInsights/EdgeToAzureBridge/config.json)
file. The list is comprised of JSON objects for every subscription you wish the
Azure Bridge to establish. Here is an example of the configuration for
subscribing to the the publications coming from the Video Analytics container.
{
    "Subscribers": [
        {
            // Specifies that this is the default subscriber
            "Name": "default",

            // Gives the type of connection, i.e. zmq_tcp, this could
            // also be zmq_ipc
            "Type": "zmq_tcp",

            // The EndPoint specifies the details of the connect, for an
            // IPC connection, this would be a JSON object with the
            // SocketDir key pointing to the directory of the IPC sockets
            "EndPoint": "127.0.0.1:65013",

            // Specification of the AppName of the service publishing the
            // messages. This allows the Edge-to-Cloud Bridge for Microsoft Azure* service to get the needed
            // authentication keys to subscribe
            "PublisherAppName": "VideoAnalytics",

            // Specifies the list of all of the topics which the
            // EdgeToAzureBridge  shall subscribe to
            "Topics": [
                "camera1_stream_results"
            ]
        }
    ]
}
There are a few important implications to be aware of for both ZeroMQ TCP and IPC subscribers over the EII Message Bus. Following are specifies implications.
ZeroMQ TCP Subscription Implications
For ZeroMQ TCP subscribers, like the example shown above, the EndPoint in
the subscriber’s configuration object has to be overridden through an
environmental variable. The reason for this, is that the Edge-to-Cloud Bridge for Microsoft Azure* service
service runs attached to a bridged Docker network created by the Azure IoT
Edge Runtime, whereas the other EII services run on the different bridged network.
In order to subscribe, the Edge-to-Cloud Bridge for Microsoft Azure* service must use the host’s IP address to
connect.
If the Edge-to-Cloud Bridge for Microsoft Azure* service is only subscribing to a single service, then the
EndPoint can be overridden by setting the SUBSCRIBER_ENDPOINT environmental
variable. The environmental variable changes if there are multiple subscribers.
For instance, if the configuration example had another object in the Subscribers
list which had the Name key set to example_name, then the environmental
variable name would need to be SUBSCRIBER_example_name_ENDPOINT. Essentially,
for multiple subscribers the Name property must be in the environmental
variable name between the SUBSCRIBER_ and _ENDPOINT. The same holds true for
CLIENT_ENDPOINT and CLIENT_<Name>_ENDPOINT usage of environmental variables too.
In either case, the value of the environmental variable must be set to
$HOST_IP:<PORT> where you must fill in what the desired port is. Note that the
IP address is the variable $HOST_IP. This will be pulled from the .env file
when generating your deployment manifest.
The final implication is on the configuration of the services which the
Edge-to-Cloud Bridge for Microsoft Azure* service is subscribing to. Most EII services publishing over TCP set
their host to 127.0.0.1. This keeps the communication only available to
subscribers which are on the local host network on the system. In order for
the Edge-to-Cloud Bridge for Microsoft Azure* service to subscribe to these publications this must be changed
to 0.0.0.0.
This can be accomplished by overriding the service’s publisher EndPoint
configuration via environmental variables, just like with the Edge-to-Cloud Bridge for Microsoft Azure* service
service. For each service which the Edge-to-Cloud Bridge for Microsoft Azure* service needs to subscribe to over
TCP, add the environmental variable PUBLISHER_ENDPOINT=0.0.0.0:<PORT> to the
environmental variable configuration of the serivce’s module configuration in
your deployment manifest (note: be sure to replace the port). Or if there are
multiple topics being published, use the variable PUBLISHER_<Name>_ENDPOINT.
The same holds true for SERVER_ENDPOINT and SERVER_<Name>_ENDPOINT usage
of environmental variables too.
These variables have already been set for to have the Edge-to-Cloud Bridge for Microsoft Azure* service subscribe to a single instance of the Video Analytics service. This configuration can be seen in your deployment manifest under the, “EdgeToAzureBridge”, and, “ia_video_analytics”, modules. Or, you can see this configuration being set in the, “config/templates/ia_video_analytics.template.json”, and, “config/templates/EdgeToAzureBridge.template.json”, files.
ZeroMQ IPC Subscription Implications
If EdgeToAzureBridge is subscribing to publisher over a ZeroMQ IPC socket, ensure the following:
EdgeToAzureBridge app’s subscriber interfaces configuration matches to that of the publisher app’s publisher interfaces configuration in
build/eii_config.jsonfile. The following is an example of the EdgeToAzureBridge interface configuration subscribing to the publications coming from the VideoIngestion container.{ "Subscribers": [ { // Specifies that this is the default subscriber "Name": "default", // Gives the type of connection, i.e. zmq_tcp/zmq_ipc "Type": "zmq_ipc", // The EndPoint specifies the details of the connect, for an // IPC connection, this would be a JSON object with the // SocketDir key pointing to the directory of the IPC sockets "EndPoint": "/EII/sockets", // Specification of the AppName of the service publishing the // messages. This allows the Edge-to-Cloud Bridge for Microsoft Azure* service to get the needed // authentication keys to subscriber "PublisherAppName": "VideoIngestion", // Specifies the list of all of the topics which the // EdgeToAzureBridge shall subscribe to "Topics": [ "camera1_stream" ] } ] }
Follow
Step 3 - Configuring Azure IoT Deployment Manifestto generate the manifest template file and deployment manifest files. Ensure to remove all thePUBLISHER_ENDPOINTPUBLISHER_<Name>_ENDPOINT,SUBSCRIBER_ENDPOINT, andSUBSCRIBER_<Name>_ENDPOINTenvironmental variables from the generated deployment manifest template file i.e.,example.template.jsonas these ENVs are not applicable for IPC configuration. Additionally, update theexample.template.jsonas per the recommendations mentioned in theImportant Notesection for IPC configuration. Run the following command to regenerate the deployment manifest file i.e.,config/example.amd64.json:iotedgedev genconfig -f example.template.json
Follow Step 4 - Deployment for deployment. The following is an example of digital twin for the Edge-to-Cloud Bridge for Microsoft Azure* service:
{
    "log_level": "DEBUG",
    "topics": {
        "camera1_stream_results": {
            "az_output_topic": "camera1_stream_results"
        }
    },
    "eii_config": "{\"/EdgeToAzureBridge/config\": {}, \"/EdgeToAzureBridge/interfaces\": {\"Subscribers\": [{\"EndPoint\": \"127.0.0.1:65013\", \"Name\": \"default\", \"PublisherAppName\": \"VideoAnalytics\", \"Topics\": [\"camera1_stream_results\"], \"Type\": \"zmq_tcp\"}]}, \"/EtcdUI/config\": {}, \"/EtcdUI/interfaces\": {}, \"/GlobalEnv/\": {\"C_LOG_LEVEL\": \"DEBUG\", \"ETCD_KEEPER_PORT\": \"7070\", \"GO_LOG_LEVEL\": \"INFO\", \"GO_VERBOSE\": \"0\", \"PY_LOG_LEVEL\": \"DEBUG\"}, \"/VideoAnalytics/config\": {\"encoding\": {\"level\": 95, \"type\": \"jpeg\"}, \"max_jobs\": 20, \"max_workers\": 4, \"queue_size\": 10, \"udfs\": [{\"device\": \"CPU\", \"model_bin\": \"common/udfs/python/pcb/ref/model_2.bin\", \"model_xml\": \"common/udfs/python/pcb/ref/model_2.xml\", \"name\": \"pcb.pcb_classifier\", \"ref_config_roi\": \"common/udfs/python/pcb/ref/roi_2.json\", \"ref_img\": \"common/udfs/python/pcb/ref/ref.png\", \"type\": \"python\"}]}, \"/VideoAnalytics/interfaces\": {\"Publishers\": [{\"AllowedClients\": [\"*\"], \"EndPoint\": \"0.0.0.0:65013\", \"Name\": \"default\", \"Topics\": [\"camera1_stream_results\"], \"Type\": \"zmq_tcp\"}], \"Subscribers\": [{\"EndPoint\": \"/EII/sockets\", \"Name\": \"default\", \"PublisherAppName\": \"VideoIngestion\", \"Topics\": [\"camera1_stream\"], \"Type\": \"zmq_ipc\", \"zmq_recv_hwm\": 50}]}, \"/VideoIngestion/config\": {\"encoding\": {\"level\": 95, \"type\": \"jpeg\"}, \"ingestor\": {\"loop_video\": true, \"pipeline\": \"./test_videos/pcb_d2000.avi\", \"poll_interval\": 0.2, \"queue_size\": 10, \"type\": \"opencv\"}, \"max_jobs\": 20, \"max_workers\": 4, \"sw_trigger\": {\"init_state\": \"running\"}, \"udfs\": [{\"n_left_px\": 1000, \"n_right_px\": 1000, \"n_total_px\": 300000, \"name\": \"pcb.pcb_filter\", \"scale_ratio\": 4, \"training_mode\": \"false\", \"type\": \"python\"}]}, \"/VideoIngestion/interfaces\": {\"Publishers\": [{\"AllowedClients\": [\"VideoAnalytics\", \"Visualizer\", \"WebVisualizer\", \"TLSRemoteAgent\", \"RestDataExport\"], \"EndPoint\": \"/EII/sockets\", \"Name\": \"default\", \"Topics\": [\"camera1_stream\"], \"Type\": \"zmq_ipc\"}], \"Servers\": [{\"AllowedClients\": [\"*\"], \"EndPoint\": \"127.0.0.1:66013\", \"Name\": \"default\", \"Type\": \"zmq_tcp\"}]}}"
}
For the full JSON schema, refer to
modules/EdgeToAzureBridge/config_schema.jsonFor the digital twin of theEdge-to-Cloud Bridge for Microsoft Azure* service module.
Each key in the configuration above is described in the table:
Key |
Description |
|---|---|
|
This is the logging level for the Edge-to-Cloud Bridge for Microsoft Azure* service module, must be INFO, DEBUG, WARN, or ERROR |
|
Configuration for the topics to map from the EII Message Bus into the Azure IoT Edge Runtime |
|
Entire serialized configuration for EII; this configuration will be placed in ETCD |
You will notice that the eii_config is a serialized JSON string. This is due to a limitation with the Azure IoT Edge Runtime. Currently, module digital twins do not support arrays; however, the EII configuration requires array support. To workaround this limitation, the EII configuration must be a serialized JSON string in the digital twin for the Edge-to-Cloud Bridge for Microsoft Azure* service module.
The topics value is a JSON object, where each key is a topic from the EII Message Bus which will be re-published onto the Azure IoT Edge Runtime. The value for the topic key will be an additional JSON object, where there is one required key, az_output_topic, which is the topic on Azure IoT Edge Runtime to use and then an optional key, az_blob_container_name.
Sample Edge Insights for Industrial ONNX UDF
EII provides a sample UDF which utilizes the ONNX RT to execute your machine learning or deep learning model. It also supports connecting to an AzureML Workspace to download the model and then run it. The source code for this UDF is in [WORKDIR]/IEdgeInsights/common/video/udfs/python/sample_onnx/, also refer Sample ONNX UDF section in [WORKDIR]/IEdgeInsights/common/video/udfs/README.md for doing the required configuration for running this UDF.
To use this UDF with EII, you need to modify your build/eii_config.jsonconfiguration file to run the UDF in either your Video Ingesiton or Video Analytics instance. Ensure to remove the existing PCB filter or classifier UDFs or any other UDFs in Video Ingestion and Video Analytics config keys in build/eii_config.json aswe are doing some basic pre-processing, inferencing and post-processing in the ONNX UDF itself. Then, you need to modify the environmental variables in the EdgeToAzureBridge/.env file to provide the connection
information to enable the UDF to download your model from AzureML. Make sure to follow the instructions provided in the Setting up AzureML section above to configure your workspace correctly so that the UDF can download your model.
The sample ONNX UDF requires that the following configuration values be set for the UDF in your eii_config.json file:
Key |
Value |
|---|---|
|
AzureML workspace name |
|
|
|
Name of the model in your AzureML workspace |
|
Whether or not to attempt to download the model |
Note
If download_mode is false, then it expects the model_name to where the *.onnx model file is in the container.
This should be added into the udfs list for your Video Ingestion or Video Analytics instance you wish to have run the UDF. The configuration should look similar to the following:
{
    // ... omited rest of EII configuration ...

    "udfs": [
        {
            "name": "sample_onnx.onnx_udf",
            "type": "python",
            "aml_ws": "example-azureml-workspace",
            "aml_subscription_id": "subscription-id",
            "model_name": "example-model-name",
            "download_model": true
        }
    ]

    // ... omited rest of EII configuration ...
}
The following environmental variables must be set in the EdgeToAzureBridge/.env file in order to have the sample ONNX UDF download your model from an AzureML Workspace:
Setting |
Description |
|---|---|
|
The |
|
The |
|
The |
It is important to note that for the AML_PRINCIPAL_PASS variable you must wrap the password in single quotes, i.e. '. Otherwise, there may be characters that get escaped in a weird way when the values are populated into your deployment manifest leading to configuration errors.
The tenantId, clientId, clientSecret, and subscriptionId should all have been obtained when following the instructions in the Setting up AzureML
section.
Run the following steps when the sample_onnx UDF is failing with error like The provided client secret keys are expired. Visit the Azure Portal to create new keys for your app:
az login
az ad app credential reset --id <aml_tenant_id>
The output of above command will be in json format. Update the AML_ env variables in EdgeToAzureBridge/.env as per above table and follow the steps Step 4 and Step 4 to refer to the sample_onnx UDF working fine.
IMPORTANT NOTE:
If your system is behind a proxy, you may run into an issue where the download of your ONNX model from AzureML times out. This may happen even if the proxy is set globally for Docker on your system. To fix this, update your deployment manifest template so that the Video Ingestion and/or Video Analytics containers have the http_proxy and https_proxy values set. The manifest should look something like the following:
{
    // ... omitted ...

    "modules": {
        "ia_video_ingestion": {
            // ... omitted ...

            "settings": {
                "createOptions": {
                    "Env": [
                        // ... omitted ...

                        "http_proxy=<YOUR PROXY>",
                        "https_proxy=<YOUR PROXY>",

                        // ... omitted ...
                    ]
                }
            }

            // ... omitted ...
        }
    }

    // ... omitted ...
}
Simple Subscriber
The Simple Subscriber module provided with the Edge-to-Cloud Bridge for Microsoft Azure* service is a very simple service which only receives messages over the Azure IoT Edge Runtime and prints them to stdout. As such, there is no digital twin required for this module. The only configuration required is that a route be established in the Azure IoT Edge Runtime from the Edge-to-Cloud Bridge for Microsoft Azure* service module to the Simple Subscriber module. This routewill look something like the following in your deployment manifest:
{
    "$schema-template": "2.0.0",
    "modulesContent": {
        // ... omitted for brevity ...

        "$edgeHub": {
            "properties.desired": {
                "schemaVersion": "1.0",
                "routes": {
                    "BridgeToSimpleSubscriber": "FROM /messages/modules/EdgeToAzureBridge/outputs/camera1_stream INTO BrokeredEndpoint(\"/modules/SimpleSubscriber/inputs/input1\")"
                },
                "storeAndForwardConfiguration": {
                    "timeToLiveSecs": 7200
                }
            }
        }

        // ... omitted for brevity ...
    }
}
For more information on establishing routes in the Azure IoT Edge Runtime, Refer to the documentation.
Edge Insights for Industrial ETCD Pre-Load
The configuration for EII is given to the Edge-to-Cloud Bridge for Microsoft Azure* service via the eii_config key in the module’s digital twin. As specified in the Edge-to-Cloud Bridge for Microsoft Azure* service configuration section, this must be a serialized string. For the scripts included with the Edge-to-Cloud Bridge for Microsoft Azure* service for generating your deployment manifest the ETCD pre-load configuration is stored at config/eii_config.json. Refer to the EII documentation for more information on populating this file with your desired EII configuration. The helper scripts will automatically serialize this JSON file and add it to your
deployment manifest.
Azure Blob Storage
The Edge-to-Cloud Bridge for Microsoft Azure* service enables to use of the Azure Blob Storage edge IoT service from Microsoft. This service can be used to save images from EII into the blob storage.
If you wish to have the Azure Blob Storage service save the images to your host filesystem, then you must do the following:
Create the directory to save the data on your host filesystem, it is recommended to use the following commands:
source [WORK_DIR]/IEdgeInsights/build/.env
sudo mkdir -p /opt/intel/eii/data/azure-blob-storage
sudo chown ${EII_UID}:${EII_UID} /opt/intel/eii/data/azure-blob-storage
Next, modify your deployment manifest to alter the bind location which the Azure Blob Storage service uses. To do this, open your
*.template.jsonfile. Provided you have specified the Azure Blob Storage service, view the following in your deployment manifest template:{ "AzureBlobStorageonIoTEdge": { "type": "docker", "status": "running", "restartPolicy": "always", "version": "1.0", "settings": { "image": "mcr.microsoft.com/azure-blob-storage", "createOptions": { "User": "${EII_UID}", "Env": [ "LOCAL_STORAGE_ACCOUNT_NAME=$AZ_BLOB_STORAGE_ACCOUNT_NAME", "LOCAL_STORAGE_ACCOUNT_KEY=$AZ_BLOB_STORAGE_ACCOUNT_KEY" ], "HostConfig": { "Binds": [ "az-blob-storage-volume:/blobroot" ] } } } } }
Change the
Bindslocation to the following:{ "AzureBlobStorageonIoTEdge": { // ... omitted ... "settings": { "createOptions": { // ... omitted ... "HostConfig": { "Binds": [ "/opt/intel/eii/data/azure-blob-storage/:/blobroot" ] } } } } }
Add the
az_blob_container_namekey as inexample.template.jsonfile, this specifies the Azure Blob Storage container to store the images from the EII video analytics pipeline in. If theaz_blob_container_namekey is not specified, then the images will not be saved.{ "EdgeToAzureBridge": { "properties.desired": { // ... "topics": { "camera1_stream_results": { "az_output_topic": "camera1_stream_results", "az_blob_container_name": "camera1streamresults" } }, // ... } } }
Important Notes:
“Container” in the Azure Blob Storage context is not referencing a Docker container, but rather a storage structure within the Azure Blob Storage instance running on your edge device. For more information on the data structure of Azure Blob Storage, refer to the link.
The Azure Blob Storage service places strict requirements on the name of the, “container”, under which it stores blobs. This impacts the value given for the
az_blob_container_nameconfiguration key. According to the Azure documentation, the name must a valid DNS name adhering to the following rules:Container names must start or end with a letter or number, and can contain only letters, numbers, and the dash (-) character.
Every dash (-) character must be immediately preceded and followed by a letter or number; consecutive dashes are not permitted in container names.
All letters in a container name must be lowercase.
Container names must be from 3 through 63 characters long.
For more information on the name conventions/restrictions for Azure Blob Storage container names, refer to the link page of the Azure documentation.
Ensure to run the
iotedgedev genconfig -f example.template.jsoncommand for the changes to be applied to the actual deployment manifest:./config/example.amd64.json/. Follow Step 4 - Deployment to deploy the azure modules. Run the following command to view the images:sudo ls -l /opt/intel/eii/data/azure-blob-storage/BlockBlob/
In that directory, you will see a folder for each container. Inside that directory will be the individually saved images.
(OPTIONAL) For pushing the saved images to Azure portal, update the
properties.desiredkey of AzureBlobStorageonIOTEdge.template.json([WORK_DIR]/IEdgeInsights/EdgeToAzureBridge/config/templates/AzureBlobStorageonIoTEdge.template.json) as shown in the right applicable values:"properties.desired": { "deviceToCloudUploadProperties": { "uploadOn": true, "cloudStorageConnectionString" : "<KEY_IN_THE_REQUIRED_CONNECTION_STRING", "storageContainersForUpload":{ "camera1streamresults": { "target": "camera1streamresults" } } }, "deviceAutoDeleteProperties": { "deleteOn": false, "deleteAfterMinutes": 5 } }
Rerun step 4 to redeploy the Azure Blob storage with the above config.
Note:
For more information on configuring your Azure Blob Storage instance at the edge, refer to the documentation for the service here.
Also refer to How to deploy blob guide.
Azure Deployment Manifest
For more information on creating / modifying Azure IoT Hub deployment manifests, refer to how to deploy modules and establish routes in IoT Edge.
Azure IoT Edge Simulator
Note
We are facing issue with iotedgehubdev Azure IoT edge simulator tool where we aren’t seeing the modules being deployed. An issue on the same is been raised at Issue 370 and is been followed up.
Microsoft provides a simluator for the Azure IoT Edge Runtime. During the setup of your development system (covered in the Development System Setup section), the simulator is automatically installed on your system.
Additionally, the Edge-to-Cloud Bridge for Microsoft Azure* service provides the ./tools/run-simulator.sh script to easily use the simulator with the bridge.
To do this, follow steps 1 - 3 in the Single-Node Azure IoT Edge Deployment section above. Then, instead of step 4, run the following command to setup the simulator:
sudo -E env "PATH=$PATH" iotedgehubdev setup -c "<edge-device-connection-string>"
Note
The env "PATH=$PATH" above ensures that the PATH env variable set in the regular user context gets exported to sudo environment.
Next, start the simulator with your deployment manifest template using the following command:
./tools/run-simulator.sh ./example.template.json
If everything is running smoothly, you should see messages being printed in the Simple Subscriber service using the following command:
docker logs -f SimpleSubscriber
Important Note:
You cannot run both the Azure IoT Edge Runtime and the simulator simultaneously on the same system. If you are using the same system, first stop the Azure IoT Edge Runtime daemon with the following command:
sudo iotedge system stop
Then, run the simulator as specified above.
Supported Edge Insights for Industrial Services
Edge-to-Cloud Bridge for Microsoft Azure* service supports the following services:
Config Manager Agent
Video Ingestion
Video Analytics
Edge Video Analytics Microservice
Note
As
Config Manager Agentresponsible for EII provisioning is deployed as azure module, it becomes essential to have other EII services to be deployed as azure modules to talk to other EII azure modules.Ensure to add the app names to the
SERVICESenvironment key ofConfig Manager Agentmodule template file at ia_configmgr_agent.template.json([WORK_DIR]/IEdgeInsights/EdgeToAzureBridge/config/templates/ia_configmgr_agent.template.json).
Additional Resources
For more resources on Azure IoT Hub and Azure IoT Edge, see the following references:
OpcuaExport
OpcuaExport service serves as OPCUA server subscribring to classified results from message bus and starts publishing meta data to OPCUA clients.
Note
:
OpcuaExport service subscribes classified results from both VideoAnalytics (video) or InfluxDBConnector (time-series) use cases. Ensure that the required service to subscribe is mentioned in the Subscribers configuration in config.json([WORK_DIR]/IEdgeInsights/OpcuaExport/config.json).
Steps to Independently Build and Deploy the OpcuaExport Service
Note
For running two or more microservices, it is recommended that the user tries the use case-driven approach for building and deploying, as mentioned in Generate Consolidated Files for a Subset of Edge Insights for Industrial Services.
Steps to Independently Build the OpcuaExport Service
To independently build OpcuaExport service, complete the following steps:
Note
When switching between independent deployment of the service with and without config manager agent service dependency, user might run into issues with docker-compose build w.r.t Certificates folder existence. As a workaround, run the command sudo rm -rf Certificates to proceed with docker-compose build.
The downloaded source code should have a directory named OpcuaExport:
cd IEdgeInsights/OpcuaExport
Copy the IEdgeInsights/build/.env file using the following command in the current folder
cp ../build/.env .
NOTE: Update the HOST_IP and ETCD_HOST variables in the .env file with your system IP.
# Source the .env using the following command:
set -a && source .env && set +a
Independently build
docker-compose build
Steps to Independently Deploy OpcuaExport Service
User can deploy the OpcuaExport service in any of the following two ways:
Deploy OpcuaExport Service without Config Manager Agent Dependency
Run the following commands to deploy OpcuaExport service without Config Manager Agent dependency:
# Enter the OpcuaExport directory
cd IEdgeInsights/OpcuaExport
Copy the IEdgeInsights/build/.env file using the following command in the current folder, if not already present.
cp ../build/.env .Note: Ensure that
docker psis clean anddocker network lsdoesn’t have EII bridge network.
Update .env file for following:
1. HOST_IP and ETCD_HOST variables with your system IP.
2. `READ_CONFIG_FROM_FILE_ENV` value to `true` and `DEV_MODE` value to `true`.

Source the .env using the following command:
set -a && source .env && set +a
# Run the service
docker-compose -f docker-compose.yml -f docker-compose-dev.override.yml up -d
Note
OpcuaExport container restarts automatically when its config is modified in config.json file.
If user is updating the config.json file using vi or vim editor, it is required to append the set backupcopy=yes in ~/.vimrc so that the changes done on the host machine config.json gets reflected inside the container mount point.
Deploy OpcuaExport Service with Config Manager Agent Dependency
Run the following commands to deploy OpcuaExport service with Config Manager Agent dependency:
Note
Ensure that the Config Manager Agent image present in the system. If not, build the Config Manager Agent locally when independently deploying the service with Config Manager Agent dependency.
# Enter the OpcuaExport directory
cd IEdgeInsights/OpcuaExport
Copy the IEdgeInsights/build/.env file using the following command in the current folder, if not already present.
cp ../build/.env .
Note
Ensure that docker ps is clean and docker network ls does not have EII bridge network.
Update .env file for following:
1. HOST_IP and ETCD_HOST variables with your system IP.
2. `READ_CONFIG_FROM_FILE_ENV` value is set to `false`.
Copy the docker-compose.yml from IEdgeInsights/ConfigMgrAgent as docker-compose.override.yml in IEdgeInsights/OpcuaExport.
cp ../ConfigMgrAgent/docker-compose.yml docker-compose.override.yml
Copy the builder.py with standalone mode changes from IEdgeInsights/build directory
cp ../build/builder.py .Run the builder.py in standalone mode, this will generate eii_config.json and update docker-compose.override.yml
python3 builder.py -s trueBuilding the service (This step is optional for building the service if not already done in the
Independently buildablestep above)docker-compose buildFor running the service in PROD mode, run the below command:
NOTE: Make sure to update
DEV_MODEtofalsein .env while running in PROD mode and source the .env using the commandset -a && source .env && set +adocker-compose up -dFor running the service in DEV mode, run the below command:
NOTE: Make sure to update
DEV_MODEtotruein .env while running in DEV mode and source the .env using the commandset -a && source .env && set +adocker-compose -f docker-compose.yml -f docker-compose-dev.override.yml -f docker-compose.override.yml up -d
Configuration
For more details on ETCD secrets and message bus endpoint configuration, visit Etcd_Secrets_Configuration.md and MessageBus Configuration respectively.
Service Bring Up
Complete the following steps to generate Opcua client certificates before running test client subscriber for production mode.
Refer to the following sections to build and launch OpcuaExport
Update Opcua client certificate access so that sample test program can access the certificates.
sudo chmod -R 755 ../../build/Certificates
Caution: This step will make the certs insecure. Do not do this step on a production machine.
To run a test subscriber follow the README at OpcuaExport/OpcuaBusAbstraction/c/test(
[WORK_DIR]/IEdgeInsights/OpcuaExport/OpcuaBusAbstraction/c/test)
OPCUA Client Apps
OpcuaExport service has been validated with the following third party OPCUA client apps:
OPCUA CTT tool (https://opcfoundation.org/developer-tools/certification-test-tools/opc-ua-compliance-test-tool-uactt/)
UaExpert (https://www.unified-automation.com/downloads/opc-ua-clients.html)
Integrated Objects (https://integrationobjects.com/sioth-opc/sioth-opc-unified-architecture/opc-ua-client/)
Prosys OPCUA client app(https://www.prosysopc.com/products/opc-ua-browser/)
Note
To connect with OPCUA client apps, User needs to take backup opcua_client_certificate.der([WORK_DIR]/IEdgeInsights/opcua_client_certificate.der) and copy OPCUA client apps certificate to it.
sudo chmod -R 755 ../../build/Certificates
cp <OPCUA client apps certificate> ../build/Certificates/opcua/opcua_client_certificate.der
Ensure not to bring down ConfigMgrAgent(ia_configmgr_agent) service, however restart necessary services like ia_opcua_export to reflect the changes.
Running in Kubernetes environment
Install provision and deploy helm chart
cd ../build/helm-eii/
helm install eii-gen-cert eii-gen-cert/
This will generate the Certificates under eii-deploy/Certificates folder.
sudo chmod -R 755 eii-deploy/Certificates
To connect with OPCUA client apps, user needs to copy OPCUA client apps certificate to opcua_client_certificate.der([WORK_DIR]/IEdgeInsights/opcua_client_certificate.der).
Deploy Helm Chart
helm install eii-deploy eii-deploy/
Access Opcua server using “opc.tcp://
RestDataExport Service
RestDataExport (RDE) service is a data service that serves GET and POST APIs. By default, the RDE service subscribes to a topic from the message bus and serves as GET API Server to respond to any GET requests for the required metadata and frames. By enabling the POST API, the RDE service publishs the subscribed metadata to an external HTTP server.
Important:
RestDataExport service subscribes to classified results from the Video Analytics (video) or the InfluxDB Connector (Time Series) use cases. In the subscriber configuration of the config.json(
[WORK_DIR]/IEdgeInsights/RestDataExport/config.json) file, specify the required service to subscribe.
Steps to Independently Build and Deploy RestDataExport Service
Note
For running 2 or more microservices, we recommend users to try the use case-driven approach for building and deploying as mentioned at Generate Consolidated Files for a Subset of Edge Insights for Industrial Services.
Steps to Independently Build RestDataExport Service
Note
When switching between independent deployment of the service with and without config manager agent service dependency, one would run into issues with the docker-compose build w.r.t Certificates folder existence. As a workaround, please run the command sudo rm -rf Certificates to proceed with docker-compose build.
To independently build RestDataExport service, complete the following steps:
The downloaded source code should have a directory named RestDataExport:
cd IEdgeInsights/RestDataExport
Copy the IEdgeInsights/build/.env file using the following command in the current folder
cp ../build/.env .
NOTE: Update the HOST_IP and ETCD_HOST variables in the .env file with your system IP.
# Source the .env using the following command:
set -a && source .env && set +a
Independently build
docker-compose build
Steps to Independently Deploy RestDataExport Service
You can deploy the RestDataExport service in any of the following two ways:
Deploy RestDataExport Service without Config Manager Agent Dependency
Run the following commands to deploy RestDataExport service without Config Manager Agent dependency:
# Enter the RestDataExport directory
cd IEdgeInsights/RestDataExport
Copy the IEdgeInsights/build/.env file using the following command in the current folder, if not already present.
cp ../build/.env .Note: Ensure that
docker psis clean anddocker network lsdoesn’t have EII bridge network.
Update .env file for following:
1. HOST_IP and ETCD_HOST variables with your system IP.
2. `READ_CONFIG_FROM_FILE_ENV` value to `true` and `DEV_MODE` value to `true`.

Source the .env using the following command:
set -a && source .env && set +a
# Run the service
docker-compose -f docker-compose.yml -f docker-compose-dev.override.yml up -d
Note
RestDataExport container restarts automatically when its config is modified in config.json file.
If user is updating the config.json file using vi or vim editor, it is required to append the set backupcopy=yes in ~/.vimrc so that the changes done on the host machine config.json gets reflected inside the container mount point.
Deploy RestDataExport Service with Config Manager Agent Dependency
Run the following commands to deploy RestDataExport service with Config Manager Agent dependency:
Note
Ensure that the Config Manager Agent image present in the system. If not, build the Config Manager Agent locally when independently deploying the service with Config Manager Agent dependency.
# Enter the RestDataExport
cd IEdgeInsights/RestDataExport
Copy the IEdgeInsights/build/.env file using the following command in the current folder, if not already present.
cp ../build/.env .
Note
Ensure that docker ps is clean and docker network ls does not have EII bridge network.
Update .env file for following:
1. HOST_IP and ETCD_HOST variables with your system IP.
2. `READ_CONFIG_FROM_FILE_ENV` value is set to `false`.
Copy the docker-compose.yml from IEdgeInsights/ConfigMgrAgent as docker-compose.override.yml in IEdgeInsights/RestDataExport.
cp ../ConfigMgrAgent/docker-compose.yml docker-compose.override.yml
Copy the builder.py with standalone mode changes from IEdgeInsights/build directory
cp ../build/builder.py .Run the builder.py in standalone mode, this will generate eii_config.json and update docker-compose.override.yml
python3 builder.py -s trueBuilding the service (This step is optional for building the service if not already done in the
Independently buildablestep above)docker-compose buildFor running the service in PROD mode, run the below command:
NOTE: Make sure to update
DEV_MODEtofalsein .env while running in PROD mode and source the .env using the commandset -a && source .env && set +a.docker-compose up -dFor running the service in DEV mode, run the below command:
NOTE: Make sure to update
DEV_MODEtotruein .env while running in DEV mode and source the .env using the commandset -a && source .env && set +a.docker-compose -f docker-compose.yml -f docker-compose-dev.override.yml -f docker-compose.override.yml up -d
Configuration
For more details on the ETCD secrets and message bus endpoint configuration, refer to the following:
HTTP GET API of RDE
The HTTP GET API of RDE allows you to get metadata and images. The following sections provide information about how to request metadata and images using the curl commands.
Get the Classifier Results Metadata
To get the classifier results metadata, refer to the following:
Request to GET Metadata
You can get the metadata for DEV mode and PROD mode.
For the DEV mode:
GET /metadata
Run the following command:
curl -i -H 'Accept: application/json' http://<machine_ip_address>:8087/metadata
Refer to the following example:
curl -i -H 'Accept: application/json' http://localhost:8087/metadata
For the PROD mode:
GET /metadata
Run the following command:
curl --cacert ../build/Certificates/rootca/cacert.pem -i -H 'Accept: application/json' https://<machine_ip_address>:8087/metadata
Refer to the following example:
curl --cacert ../build/Certificates/rootca/cacert.pem -i -H 'Accept: application/json' https://localhost:8087/metadata
Output:
The output for the previous command is as follows:
HTTP/1.1 200 OK
Content-Type: text/json
Date: Fri, 08 Oct 2021 07:51:07 GMT
Content-Length: 175
{"channels":3,"defects":[],"encoding_level":95,"encoding_type":"jpeg","frame_number":558,"height":1200,"img_handle":"21af429f85","topic":"camera1_stream_results","width":1920}
Get Images Using the Image Handle
Note
For the image API, the datastore module is mandatory. From the datastore, the server fetches the data, and returns it over the REST API. Include the datastore module as a part of your use case.
Request to GET Images
GET /image
Run the following command:
curl -i -H 'Accept: image/jpeg' http://<machine_ip_address>:8087/image?img_handle=<imageid>
Refer to the following example to store image to the disk using curl along with img_handle:
curl -i -H 'Accept: application/image' http://localhost:8087/image?img_handle=21af429f85 > img.jpeg

% Total    % Received % Xferd  Average Speed   Time    Time     Time  Current
Dload  Upload   Total   Spent    Left  Speed
100  324k    0  324k    0     0  63.3M      0 --:--:-- --:--:-- --:--:-- 63.3M
Note
You can find the imageid of the image in the metadata API response.
Prerequisites to Run RestDataExport to POST on HTTP Servers
Note
By default, RDE will serve the metadata as GET only request server. By Enabling this, you can get the metadata using the GET request. Also, RDE will post the metadata to an HTTP server.
As a prerequisites, complete the following steps:
Update
[WORKDIR]/IEdgeInsights/build/.envfileHTTP_METHOD_FETCH_METADATAenvironment value as follows.HTTP_METHOD_FETCH_METADATA="POST"
Note: Ensure to rerun builder.py post changes, for generating updated deployment yml files.
If you are using the
HttpTestServerthen ensure that the server’s IP address is added to theno_proxy/NO_PROXYvars in:/etc/environment (Needs restart/relogin)
./docker-compose.yml (Needs to re-run the ‘builder’ step)
environment:
 AppName: "RestDataExport"
 DEV_MODE: ${DEV_MODE}
 no_proxy: ${ETCD_HOST}, <IP of HttpTestServer>
Run the following command to install
python etcd3pip3 install -r requirements.txt
Ensure the topics you subscribe to are also added in the config(
[WORK_DIR]/IEdgeInsights/RestDataExport/config.json) with theHttpServer endpointspecifiedUpdate the
config.jsonfile as follows:{ "camera1_stream_results": "http://IP Address of Test Server:8082", "point_classifier_results": "http://IP Address of Test Server:8082", "http_server_ca": "/opt/intel/eii/cert.pem", "rest_export_server_host": "0.0.0.0", "rest_export_server_port": "8087" }
Build and provision EII.
# Build all containers
docker-compose build
# Provision the EII stack by bringing up ConfigMgrAgent
docker-compose up -d ia_configmgr_agent
Ensure the prerequisites for starting the TestServer application are enabled. For more information, refer to the README.md.
As a prerequisite, before starting RestDataExport service, run the following commands.
Note: RestDataExport is pre-equipped with a python tool(
[WORK_DIR]/IEdgeInsights/RestDataExport/etcd_update.py) to insert data into etcd, which can be used to insert the requiredHttpServer ca certin the config of RestDataExport before running it.set -a && \ source ../build/.env && \ set +a # Required if running in the PROD mode only sudo chmod -R 777 ../build/Certificates/ python3 etcd_update.py --http_cert <path to ca cert of HttpServer> --ca_cert <path to etcd client ca cert> --cert <path to etcd client cert> --key <path to etcd client key> --hostname <IP address of host system> --port <ETCD PORT> Example: # Required if running in the PROD mode python3 etcd_update.py --http_cert "../tools/HttpTestServer/certificates/ca_cert.pem" --ca_cert "../build/Certificates/rootca/cacert.pem" --cert "../build/Certificates/root/root_client_certificate.pem" --key "../build/Certificates/root/root_client_key.pem" --hostname <IP address of host system> --port <ETCD PORT> # Required if running with k8s helm in the PROD mode python3 etcd_update.py --http_cert "../tools/HttpTestServer/certificates/ca_cert.pem" --ca_cert "../build/helm-eii/eii-deploy/Certificates/rootca/cacert.pem" --cert "../build/helm-eii/eii-deploy/Certificates/root/root_client_certificate.pem" --key "../build/helm-eii/eii-deploy/Certificates/root/root_client_key.pem" --hostname <Master Node IP address of ETCD host system> --port 32379
Start the TestServer application. For more information, refer to the README.md.
Ensure that the
DataStoreapplication is running. For more information refer to the README.md.
Launch RestDataExport Service
To build and launch the RestDataExport service, refer to the following:
Configure Environment Proxy Settings
To configure the environment proxy settings for RDE, refer to the following:
To update the host-ip for http, run the following command:
sudo vi /etc/systemd/system/docker.service.d/http-proxy.conf
To update the host-ip for https, run the following command:
sudo vi /etc/systemd/system/docker.service.d/https-proxy.conf (update host-ip)
To check if the proxy settings have been applied, run the following command:
env | grep proxy
To update the
no_proxy envvariable, run the following command:export no_proxy=$no_proxy,<host-ip>
To update docker proxy settings, run the following command:
sudo vi ~/.docker/config.json (update host-ip in no_proxy)
To reload the docker daemon, run the following command:
sudo systemctl daemon-reload
To restart the docker service with the updated proxy configurations, run the following command:
sudo systemctl restart docker
API Documentation
The RestDataExport generates the Open API documentation for all the REST APIs it exposes. This documentation can be accessed at its or documents endpoint.
http://< host ip >:8087/docs
EtcdUI Service
After the EII Configuration Management (a_configmgr_agent) service is successfully up, ETcd web UI is accessed with the following steps. Configuration changes are made for respective EII container services.
Open the browser and enter the address: https://$(HOST_IP):7071/etcdkeeper/ (when EII is running in secure mode). In this case, CA cert has to be imported in the browser. For insecure mode i.e. DEV mode, it can be accessed at https://$(HOST_IP):7071/etcdkeeper/.
Click on the version of the title to select the version of ETcd. By default the version is V3. Reopening will remember user’s choice.
Right-click on the tree node to add or delete.
For secure mode, authentication is required. User name and password needs to be entered in the dialogue box.
Username is the ‘root’ and default password is located at ETCDROOT_PASSWORD key under environment section in docker-compose.yml(
[WORK_DIR]/IEdgeInsights/ConfigMgrAgent/docker-compose.yml)This service is accessed from a remote system at address: https://$(HOST_IP):7071 (when EII is running in secure mode). In this case, CA cert has to be imported in the browser. For insecure mode i.e. DEV mode, it is accessed at http://$(HOST_IP):7071
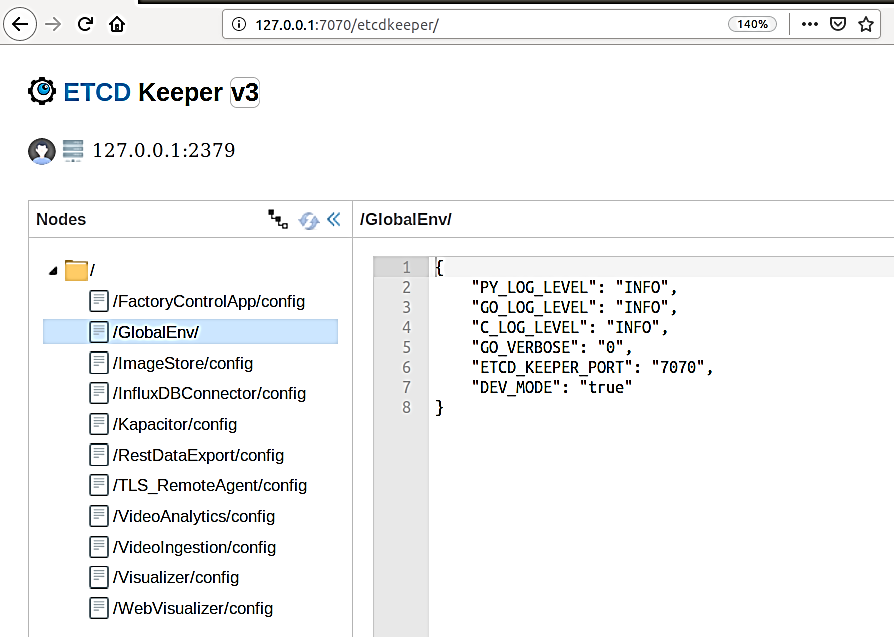
If ETCDROOT_PASSWORD is changed, there must be consolidated docker-compose.yml generated using builder script and EII must to be provisioned again. Run the following commands:
cd [WORKDIR]/IEdgeInsights/build
python3 builder.py -f usecases/<usecase.ml>
docker-compose up -d ia_configmgr_agent
The ETCD watch capability is enabled for video and timeseries services. It will auto-restart microservices when microservices config/interface changes are done via the EtcdUI interface. Any changes done to these keys are reflected at runtime in EII.
For changes done to any other keys, the EII stack needs to be restarted to be effective. Run the following commands in the working directory, to build or restart EII:
cd [WORKDIR]/IEdgeInsights/build
docker-compose down
docker-compose up -d
Refer prerequisites for video accelerators and prerequisities for cameras before changing the configuration dynamically through ETcdUI.
Note
For running two or more microservices, it is recommended that the users try the use case-driven approach for building and deploying as mentioned in Generate Consolidated Files for a Subset of Edge Insights for Industrial Services
Note
When switching between independent deployment of the service with and without config manager agent service dependency, one would run into issues with docker-compose build w.r.t Certificates folder existence. As a workaround, run command sudo rm -rf Certificates to proceed with docker-compose build.
To independently build EtcdUI service, complete the following steps:
The downloaded source code should have a directory named EtcdUI:
cd IEdgeInsights/EtcdUI
Copy the IEdgeInsights/build/.env file using the following command in the current folder
cp ../build/.env .
NOTE: Update the HOST_IP and ETCD_HOST variables in the .env file with your system IP.
# Source the .env using the following command:
set -a && source .env && set +a
Independently build:
docker-compose build
Run the following commands to deploy EtcdUI service with Config Manager Agent dependency:
Note
Ensure that the Config Manager Agent image present in the system. If not, build the Config Manager Agent locally when independently deploying the service with Config Manager Agent dependency.
# Enter the EtcdUI directory
cd IEdgeInsights/EtcdUI
Copy the IEdgeInsights/build/.env file using the following command in the current folder, if not already present.
cp ../build/.env .
Note
Ensure that docker ps is clean and docker network ls must not have EII bridge network.
Update .env file for following:
    1. HOST_IP and ETCD_HOST variables with your system IP.
    2. `READ_CONFIG_FROM_FILE_ENV` value is set to `false`.
Copy the docker-compose.yml of IEdgeInsights/ConfigMgrAgent as docker-compose.override.yml in IEdgeInsights/EtcdUI.
cp ../ConfigMgrAgent/docker-compose.yml docker-compose.override.yml
Copy the builder.py with standalone mode changes in IEdgeInsights/EtcdUI.
cp ../build/builder.py .
Note
: Run the builder.py in standalone mode, this will generate eii_config.json and update docker-compose.override.yml
python3 builder.py -s true
Building the service (This step is optional for building the service if not already done in the
Independently buildablestep previously)
docker-compose build
Running the service
Note: Source the .env using the command
set -a && source .env && set +abefore running the below command.
docker-compose up -d
Go to Build Directory of the repo
cd <workdir>/IEdgeInsights/build/Certificates/EtcdUI/
Download Root CA Cert from the EtcdUI

- Import the RootCA certificates as Trusted Root Certificate in browser
For Chrome Browser, Follow the below steps
Open Chrome settings, scroll to the bottom, and click Privacy and security
Click Manage devices certificates…
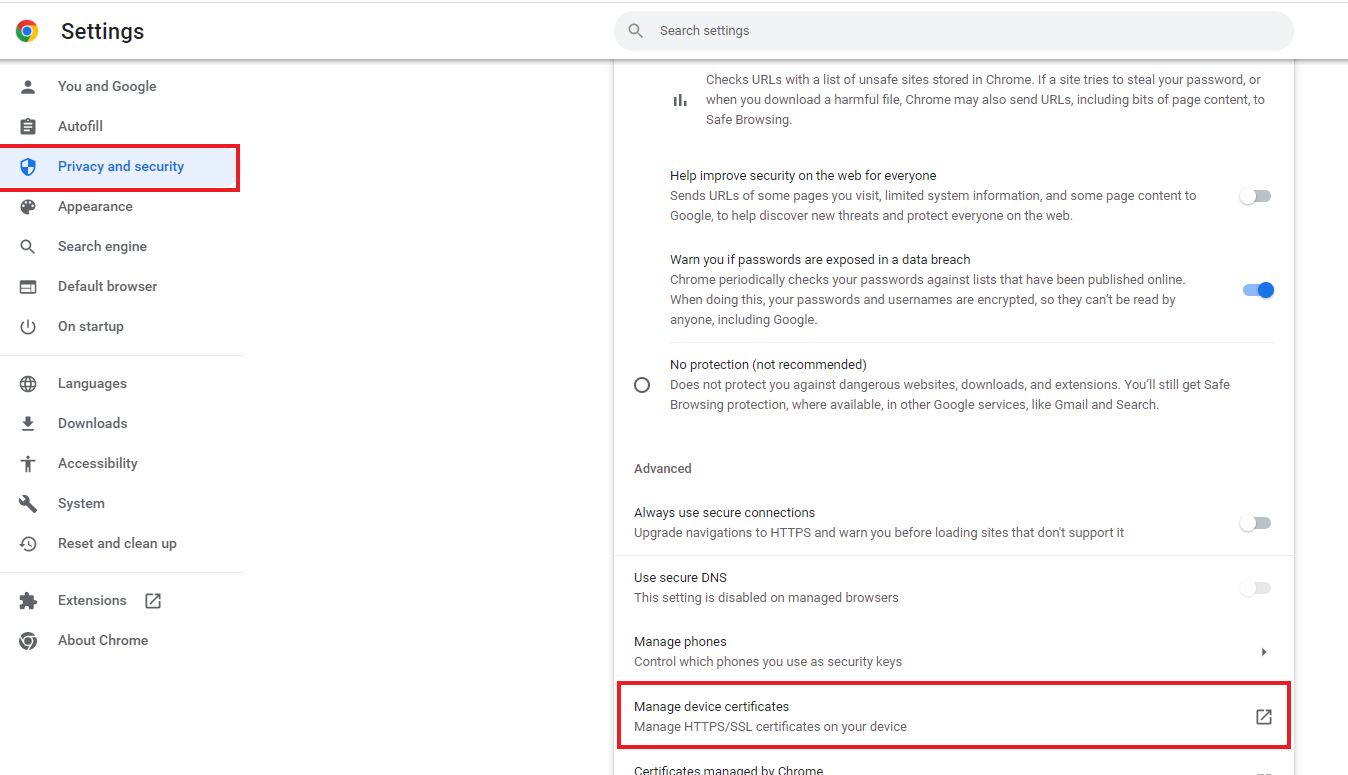
Click the Trusted Root Certification Authorities tab, then click the Import… button. This opens the Certificate Import Wizard. Click Next to get to the File to Import screen.
Click Browse… and under File Type select All Files and select the certificate file you saved earlier, then click Next.

Select Place all certificates in the following store. The selected store should be Trusted Root Certification Authorities. If it isn’t, click Browse… and select it. Click Next and Finish
Click Yes on the security warning.
Restart Chrome.
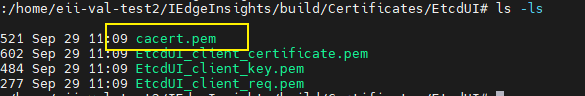

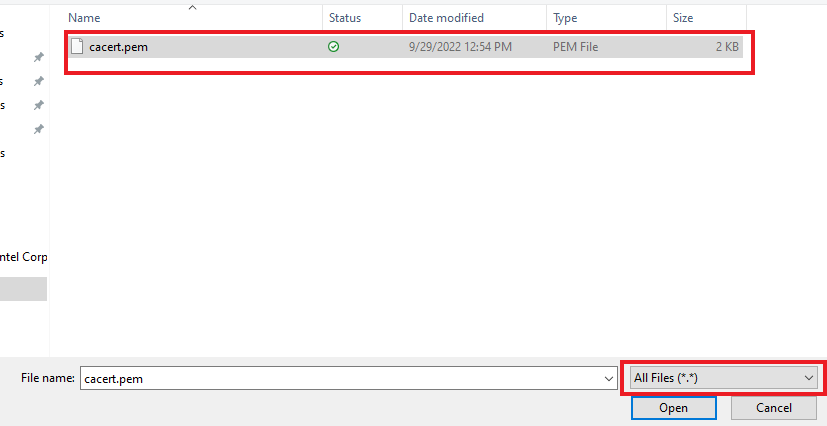
EII Tools
Edge Insights for Industrial (EII) stack has the following set of tools that also run as containers:
Time Series Benchmarking Tool
These scripts are designed to automate the running of benchmarking tests and the collection of the performance data. This performance data includes the Average Stats of each data stream, the CPU %, Memory %, and Memory read/write bandwidth..
The Processor Counter Monitor (PCM) is required for measuring memory read or write bandwidth, which can be downloaded and built here
If you do not have PCM on your system, those values will be blank in the output.ppc
Steps for running a benchmarking test case:
Configure TimeSeriesProfiler config.json(
[WORK_DIR]/IEdgeInsights/tools/TimeSeriesProfiler/config.json) file to recieve rfc_results according to TimeSeriesProfiler README.md.Change the
commandoption in the MQTT publisher docker-compose.yml([WORK_DIR]/IEdgeInsights/tools/mqtt/publisher/docker-compose.yml) to:["--topic", "test/rfc_data", "--json", "./json_files/*.json", "--streams", "<streams>"]
For example:
["--topic", "test/rfc_data", "--json", "./json_files/*.json", "--streams", "1"]
To run the test case for the time series, ensure that “export_to_csv” value in TimeSeriesProfiler config.json(
[WORK_DIR]/IEdgeInsights/tools/TimeSeriesProfiler/config.json) is set to ‘True’ and run the following command:USAGE: ./execute_test.sh TEST_DIR STREAMS SLEEP PCM_HOME [EII_HOME] Where: TEST_DIR-Directory containing services.yml and config files for influx, telegraf, and kapacitor STREAMS-The number of streams i s(1, 2, 4, 8, 16) SLEEP-The number of seconds to wait after the containers come up PCM_HOME-The absolute path to the PCM repository where pcm.x is built [EII_HOME] - [Optional] Absolute path to EII home directory, if running from a non-default location
For example:
sudo -E ./execute_test.sh $PWD/samples 2 10 /opt/intel/pcm /home/intel/IEdgeInsights
To publish the data, ensure the EII containers are up and running. Start the MQTT broker and run the publisher publisher.py(
[WORK_DIR]/IEdgeInsights/tools/mqtt/publisher/publisher.py), following are the steps:### High Level Diagram of Multi Node Setup
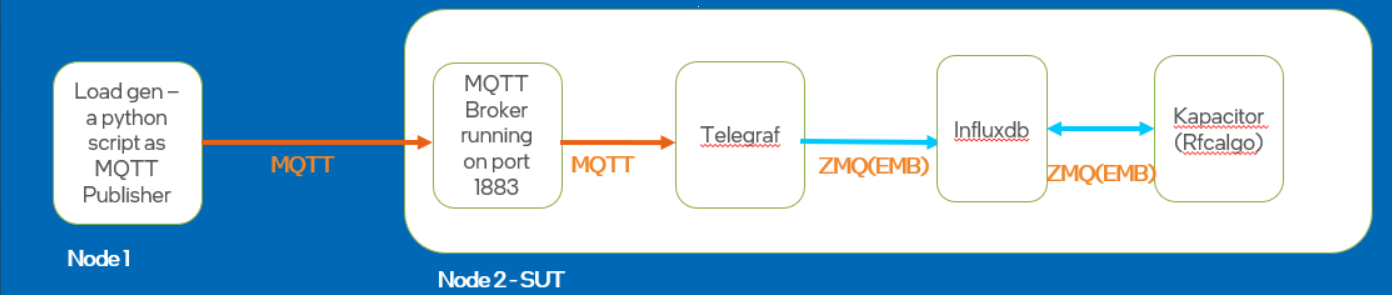
To run in multi node: Add the node IP with “no_proxy” value in the /etc/environment file. Logout and login once env updated. Remove “tools/mqtt/ia_mqtt_broker” from samples/services.yml and run broker in the bare metal.
To run MQTT publisher in single node and multi node: Run the MQTT publisher from publisher.py(
[WORK_DIR]/IEdgeInsights/tools/mqtt/publisher/publisher.py):python3 publisher.py --host <host-ip> --port <port> --topic "test/rfc_data" --json "./json_files/*.json" --streams <number-of-streams> --interval <time-interval> --service <service>
For example:
python3 publisher.py --host localhost --port "1883" --topic "test/rfc_data" --json "./json_files/*.json" --streams 1 --interval 0.1 --service "benchmarking"

5.The execution logs, performance logs, and the output.ppc are saved in TEST_DIR/output/< timestamp >/ so that the same test case is run multiple times without overwriting the output. You can see if the test has any errors in the execution.log, and you can see the results of a successful test in output.ppc.
The time-series profiler output file (named “avg_latency_Results.csv”) is stored in TEST_DIR/output/< timestamp >/.
Note
While running benchmarking tool with more than one stream, run **MQTT broker([WORK_DIR]/IEdgeInsights/tools/mqtt/broker/)* manually with multiple instances and add the MQTT consumers in **Telegraf telegraf.conf([WORK_DIR]/IEdgeInsights/Telegraf/config/Telegraf/config.json)* with ‘n’ number of streams based on the use case.
Video Benchmarking Tool
These scripts are designed to automate the running of benchmarking tests and the collection of the performance data. This performance data includes the FPS of each video stream, and also the CPU %, Memory %, and Memory read/write bandwidth.
The Processor Counter Monitor (PCM) is required for measuring memory read/write bandwidth, which can be downloaded and built here.
If you do not have PCM on your system, those columns will be blank in the output.csv.
Refer README-Using-video-accelerators for using video accelerators and follow the required prerequisites to work with GPU, MYRIAD, and HDDL devices.
Note
To run the gstreamer pipeline mentioned in sample_test/config.json(
[WORK_DIR]/IEdgeInsights/tools/Benchmarking/video-benchmarking-tool/sample_test/config.json), copy the required model files to[WORKDIR]/IEdgeInsights/VideoIngestion/models. For more information, refer to models-readme.In IPC mode, for accelerators:
MYRIAD,GPUand USB 3.0 Vision cameras, adduser: rootin VideoProfiler-docker-compose.yml([WORK_DIR]/IEdgeInsights/tools/VideoProfiler/docker-compose.yml) as the subscriber needs to run asrootif the publisher is running asroot.For
GPUdevice, there is an initial delay while the model is compiled and loaded. This can affect the first benchmarking results especially on low stream count. This will be reduced on subsequent runs using kernel caching. To ensure that the kernel cache files are created, removeread_only: truein thedocker-compose.ymlfile for VI so that files can be generated.The
docker-compose.ymlfiles of VI and VideoProfiler is picked from their respective repos. So any changes needed should be applied in their respective repos.
Steps for running a benchmarking test case:
#. Ensure the VideoProfiler requirements are installed by following the README at README. #.
Start the RTSP server on a separate system on the network:
./stream_rtsp.sh <number-of-streams> <starting-port-number> <bitrate> <width> <height> <framerate>For example:
./stream_rtsp.sh 16 8554 4096 1920 1080 30
Run execute_test.sh with the desired benchmarking config:
USAGE:
    ./execute_test.sh TEST_DIR STREAMS SLEEP PCM_HOME [EII_HOME]

Where:
    TEST_DIR-The absolute path to directory containing services.yml for the services to be tested, and the config.json and docker-compose.yml for VI and VA if applicable.
    STREAMS-The number of streams (1, 2, 4, 8, 16)
    SLEEP-The number of seconds to wait after the containers come up
    PCM_HOME-The absolute path to the PCM repository where pcm.x is built
    EII_HOME-[Optional] The absolute path to EII home directory, if running from a non-default location.
For example:
sudo -E ./execute_test.sh $PWD/sample_test 16 60 /opt/intel/pcm /home/intel/IEdgeInsights
The execution log, performance logs, and the output.csv will be saved in
TEST_DIR/< timestamp >/so that the same test case can be run multiple times without overwriting the output. If any errors occur during the test, you can view its details from the execution.log file. For successful test, you can view the results in final_output.csv.
Run Video Benchmarking Tool with EdgeVideoAnalyticsMicroservice
Pre-requisites:
Please make sure EVAM services are built on the system as the benchmarking tool will only start the services and not build them.
Please update the RTSP camera IP in pipeline.json(
[WORK_DIR]/IEdgeInsights/pipeline.json) and inRTSP_CAMERA_IPfield .env([WORK_DIR]/IEdgeInsights/.env)
Run evam_execute_test.sh with the desired benchmarking config:
```sh
USAGE:
    ./evam_execute_test.sh TEST_DIR STREAMS SLEEP PCM_HOME [EII_HOME]

WHERE:
    TEST_DIR  - The absolute path to directory containing services.yml for the services to be tested, and the config.json and docker-compose.yml for VI and VA if applicable.
    STREAMS   - The number of streams (1, 2, 4, 8, 16)
    SLEEP     - The number of seconds to wait after the containers come up
    PCM_HOME  - The absolute path to the PCM repository where pcm.x is built
    EII_HOME - [Optional] The absolute path to EII home directory, if running from a non-default location
```


For example:
```sh
sudo -E ./evam_execute_test.sh $PWD/evam_sample_test 16 60 /opt/intel/pcm [WORKDIR]/IEdgeInsights
```
DiscoverHistory Tool
You can get history metadata and images from the DataStore container using the DiscoverHistory tool.
Build and Run the DiscoverHistory Tool
This section provides information for building and running DiscoverHistory tool in various modes such as the PROD mode and the DEV mode.
Prerequisites
As a prerequisite to run the DiscoverHistory tool, a set of config, interfaces, public, and private keys should be present in ETCD. To meet the prerequisite, ensure that an entry for the DiscoverHistory tool with its relative path from the [WORK_DIR]/IEdgeInsights] directory is set in the video-streaming-storage.yml file in the [WORK_DIR]/IEdgeInsights/build/usecases/ directory. For more information, see the following example:
AppContexts:
- ConfigMgrAgent
- VideoIngestion
- VideoAnalytics
- Visualizer/multimodal-data-visualization-streaming/eii
- Visualizer/multimodal-data-visualization/eii
- tools/DiscoverHistory
- DataStore
Run the DiscoverHistory Tool in the PROD mode
After completing the prerequisites, perform the following steps to run the DiscoverHistory tool in the PROD mode:
Open the
config.jsonfile.
#. Enter the query for DataStore influxdb. #.
Run the following command to generate the new
docker-compose.ymlthat includes DiscoverHistory:python3 builder.py -f usecases/video-streaming-storage.yml
Provision, build, and run the DiscoverHistory tool along with the EII video-streaming-storage recipe or stack. For more information, refer to the EII README.
Check if the
ia_datastoreservice is running.Locate the
dataand theframesdirectories from the following path:/opt/intel/eii/tools_output. ..Note: The
framesdirectory will be created only ifimg_handleis part of the select statement. If frames directory is not created, restarting the DiscoverHistory service would help to create it as the dependent services would have come up by then.
#. Use the ETCDUI to change the query in the configuration. #.
Run the following command to start the container with new configuration:
docker restart ia_discover_history
Run the DiscoverHistory Tool in the DEV Mode
After completing the prerequisites, perform the following steps to run the DiscoverHistory tool in the DEV mode:
Open the [.env] file from the
[WORK_DIR]/IEdgeInsights/builddirectory.Set the
DEV_MODEvariable astrue.
Run the DiscoverHistory Tool in the zmq_ipc Mode
After completing the prerequisites, to run the DiscoverHistory tool in the zmq_ipc mode, modify the interface section of the config.json file as follows:
{
    "type": "zmq_ipc",
    "EndPoint": "/EII/sockets"
}
Sample Select Queries
The following table shows the samples for the select queries and its details:
Note
Include the following parameters in the query to get the good and the bad frames:
The following examples shows how to include the parameters:
“select img_handle, defects, encoding_level, encoding_type, height, width, channel from camera1_stream_results order by desc limit 10”
“select * from camera1_stream_results order by desc limit 10”
Multi-instance Feature Support for the Builder Script with the DiscoverHistory Tool
The multi-instance feature support of the Builder works only for the video pipeline ([WORK_DIR]/IEdgeInsights/build/usecase/video-streaming.yml). For more details, refer to the EII core Readme
In the following example, you can view how to change the configuration to use the builder.py script -v 2 feature with 2 instances of the DiscoverHistory tool enabled:
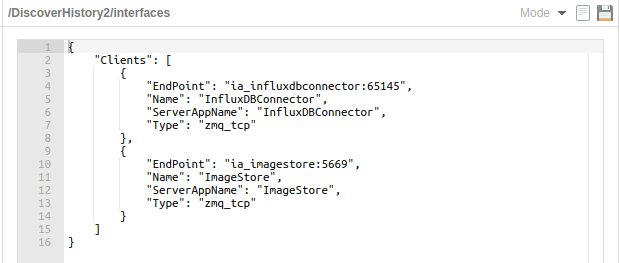
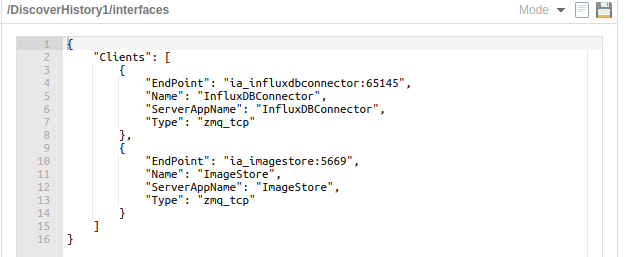
EmbPublisher
This tool acts as a brokered publisher of message bus.
Telegaf’s message bus input plugin acts as a subscriber to the EII broker.
How to Integrate this Tool with Video or Time Series Use Case
In the
time-series.yml/video-streaming.ymlfile, add theZmqBrokerandtools/EmbPublishercomponents.Use the modified
time-series.yml/video-streaming.ymlfile as an argument while generating the docker-compose.yml file using thebuilder.pyutility.Follow usual provisioning and starting process.
Configuration of the Tool
Let us look at the sample configuration:
{
  "config": {
    "pub_name": "TestPub",
    "msg_file": "data1k.json",
    "iteration": 10,
    "interval": "5ms"
  },
  "interfaces": {
    "Publishers": [
      {
        "Name": "TestPub",
        "Type": "zmq_tcp",
        "AllowedClients": [
          "*"
        ],
        "EndPoint": "ia_zmq_broker:60514",
        "Topics": [
          "topic-pfx1",
          "topic-pfx2",
          "topic-pfx3",
          "topic-pfx4"
        ],
        "BrokerAppName" : "ZmqBroker",
        "brokered": true
      }
    ]
  }
}
-pub_name:The name of the publisher in the interface.
-topics:The name of the topics seperated by comma, for which the publisher need to be started.
-msg_file:The file containing the JSON data, which represents the single data point (files should be kept into directory named ‘datafiles’).
-num_itr:The number of iterations.
-int_btw_itr:The interval between any two iterations.
Running the EmbPublisher in IPC Mode
User needs to modify the following interface section of config.json(``[WORK_DIR]/IEdgeInsights/tools/EmbPublisher/config.json``) to run in IPC mode:
"interfaces": {
  "Publishers": [
    {
      "Name": "TestPub",
      "Type": "zmq_ipc",
      "AllowedClients": [
        "*"
      ],
      "EndPoint": {
              "SocketDir": "/EII/sockets",
              "SocketFile": "frontend-socket"
          },
      "Topics": [
        "topic-pfx1",
        "topic-pfx2",
        "topic-pfx3",
        "topic-pfx4"
      ],
      "BrokerAppName" : "ZmqBroker",
      "brokered": true
    }
  ]
}
EmbSubscriber
EmbSubscriber subscribes message coming from the publisher. It subscribes to message bus topic to get the data.
Prerequisites
- EmbSubscriber expects a set of config, interfaces & public private keys to be present in ETCD as a prerequisite.
To achieve this, ensure an entry for the EmbSubscriber with its relative path from the IEdgeInsights(
[WORK_DIR]/IEdgeInsights/) directory is set in the time-series.yml file present in build/usecases([WORK_DIR]/IEdgeInsights/build/usecases) directory.For example:
AppName:
- ConfigMgrAgent
- Visualizer/multimodal-data-visualization/eii
- DataStore
- Kapacitor
- Telegraf
- tools/EmbSubscriber
After completing the previous prerequisites, execute the following command:
cd [WORKDIR]/IEdgeInsights/build
python3 builder.py -f usecases/time-series.yml
Run the EmbSubscriber
Refer to the ../README.md to provision, build and run the tool along with the EII Time Series recipe or stack.
Run the EmbSubscriber in IPC mode
To run EmbSubscriber in the IPC mode, modify the following interfaces section of the config.json([WORK_DIR]/IEdgeInsights/tools/EmbSubscriber/config.json) file:
{
  "config": {},
  "interfaces": {
    "Subscribers": [
      {
        "Name": "TestSub",
        "PublisherAppName": "Telegraf",
        "Type": "zmq_ipc",
        "EndPoint": {
                  "SocketDir": "/EII/sockets",
                  "SocketFile": "telegraf-out"
         },
        "Topics": [
          "*"
        ]
      }
    ]
  }
}
GigEConfig Tool
The GigEConfig tool can be used to read the Basler Camera properties from the Pylon Feature Stream (PFS) file and construct a gstreamer pipeline with the required camera features. The gstreamer pipeline that is generated by the tool can either be printed on the console or be used to update the config manager storage.
Note
This tool has been verified with the Basler camera only as the PFS file, which is a pre-requisite to this tool, is specific to the Basler Pylon Camera Software Suite.
Generating PFS (Pylon Feature Stream) File
In order to execute this tool, the user must provide a PFS file as a prerequisite. The PFS file can be generated using the Pylon Viewer application for the respective Basler camera by the following steps:
- Refer the following link to install and get an overview of the Pylon Viewer application:-
Execute the following steps to run the Pylon Viewer application:
sudo <PATH>/pylon5/bin/PylonViewerAppUsing the Pylon Viewer application, the following are the steps to generate a PFS file for the required camera:
Select the required camera and open it
Configure the camera with the required settings if required
On the application toolbar, select Camera tab-> Save Features
Close the camera
Note
If one needs to configure the camera using Pylon Viewer, ensure the device is not used by another application, as it can be controlled by only one application at a time.
Running GigEConfig Tool
Before executing the tool, execute the following steps:
Refer to GenICam GigE Camera and follow the prerequisities required to work with Basler GenICam GigE cameras and ensure provisioning is completed by referring to Configmgr Readme
Source build/.env to get all the required ENVs
set -a
source [WORKDIR]/IEdgeInsights/build/.env
set +a
Install the dependencies
Note: It is highly recommended that you use a Python virtual environment to install the Python packages so that the system Python installation doesn’t get altered. For details on setting up and using the Python virtual environment, refer https://www.geeksforgeeks.org/python-virtual-environment/
cd [WORKDIR]/IEdgeInsights/tools/GigEConfig
pip3 install -r requirements.txt
If using the GigE tool in PROD mode, make sure to set the required permissions on the certificates.
sudo chmod -R 755 [WORKDIR]/IEdgeInsights/build/Certificates
Note: This step is required every time provisioning is done. Caution: This step will make the certificates insecure, so do not do it on a production machine.
Usage of GigEConfig Tool
Script usage:
python3 GigEConfig.py --help


python3 GigEConfig.py [-h] --pfs_file PFS_FILE [--etcd] [--ca_cert CA_CERT]
                      [--root_key ROOT_KEY] [--root_cert ROOT_CERT]
                      [--app_name APP_NAME] [-host HOSTNAME] [-port PORT]
Tool for updating pipelines based on user input.
optional arguments:
- -h, --help
show this help message and exit
—pfs_file PFS_FILE, -f PFS_FILE To process PFS file generated by PylonViewerApp (default: None)
- --etcd, -e
Set for updating ETCD config (default: False)
—ca_cert CA_CERT, -c CA_CERT Provides path of ca_certificate.pem (default: None)
- –root_key ROOT_KEY, -r_k ROOT_KEY
Provides path of root_client_key.pem (default: None)
—root_cert ROOT_CERT, -r_c ROOT_CERT Provides path of root_client_certificate.pem (default: None)
- --app_name APP_NAME, -a APP_NAME
For providing appname of VideoIngestion instance (default: VideoIngestion)
—hostname HOSTNAME, -host HOSTNAME Etcd hsst IP (default: localhost)
- –port PORT, -port PORT
Etcd host port (default: 2379)
config.json([WORK_DIR]/IEdgeInsights/tools/GigEConfig/config.json) consists of mapping between the PFS file elements and the camera properties. The pipeline constructed will only consist of the elements specified in it.
The user needs to provide the following elements:-
pipeline_constant:Specify the constant gstreamer element of the pipeline.
plugin_name:The name of the gstreamer source plugin used.
device_serial_number:The serial number of the device to which the plugin needs to connect to.
plugin_properties: Properties to be integrated into the pipeline. The keys in here are mapped to respective gstreamer properties.
Execution of GigEConfig
The tool can be executed in the following manner:
cd [WORKDIR]/IEdgeInsights/tools/GigEConfig
Modify config.json(
[WORK_DIR]/IEdgeInsights/tools/GigEConfig/config.json) based on the requirementsIf the ETCD configuration must be updated,
For DEV Mode:
python3 GigEConfig.py --pfs_file <path to pylon's pfs file> -e
For PROD Mode:
Before running in PROD mode, change the permissions of the certificates:
sudo chmod 755 -R [WORDK_DIR]/IEdgeInsights/build/Certificates
python3 GigEConfig.py -f <path to pylon's pfs file> -c [WORK_DIR]/IEdgeInsights/build/Certificates/rootca/cacert.pem -r_k [WORK_DIR]/IEdgeInsights/build/Certificates/root/root_client_key.pem -r_c [WORK_DIR]/IEdgeInsights/build/Certificates/root/root_client_certificate.pem -e
If only the pipeline needs to be printed.
python3 GigEConfig.py --pfs_file <path to pylon's pfs file>
If a host or port is needed to be specified for ETCD.
For DEV Mode:
python3 GigEConfig.py --pfs_file <path to pylon's pfs file> -e -host <etcd_host> -port <etcd_port>
For PROD Mode:
Before running in PROD mode, change the permissions of the certificates:
sudo chmod 755 -R [WORDK_DIR]/IEdgeInsights/build/Certificates
python3 GigEConfig.py -f <path to pylon's pfs file> -c [WORK_DIR]/IEdgeInsights/build/Certificates/rootca/cacert.pem -r_k [WORK_DIR]/IEdgeInsights/build/Certificates/root/root_client_key.pem -r_c [WORK_DIR]/IEdgeInsights/build/Certificates/root/root_client_certificate.pem -e -host <etcd_host> -port <etcd_port>
HttpTestServer
HttpTestServer runs a simple HTTP test server with security being optional.
Prerequisites for Running the HttpTestServer
To install EII libs on bare metal, follow the README of eii_libs_installer.
Generate the certificates required to run the HTTP Test Server using the following command:
./generate_testserver_cert.sh test-server-ipUpdate no_proxy to connect to the RestDataExport server:
export no_proxy=$no_proxy,<HOST_IP>
Starting HttpTestServer
Run the following command to start the HttpTestServer:
cd IEdgeInsights/tools/HttpTestServer
go run TestServer.go --dev_mode false --host <address of test server> --port <port of test server> --rdehost <address of Rest Data Export server> --rdeport <port of Rest Data Export server>
   Eg: go run TestServer.go --dev_mode false --host=0.0.0.0 --port=8082 --rdehost=localhost --rdeport=8087

For Helm Usecase:
Eg: go run TestServer.go --dev_mode false --host=0.0.0.0 --port=8082 --rdehost=<maser_node_ip>--rdeport=31509 --client_ca_path ../../build/helm-eii/eii-deploy/Certificates/rootca/cacert.pem
Note: server_cert.pem is valid for 365 days from the date of generation.
In PROD mode, you might see intermediate logs like this:
http: TLS handshake error from 127.0.0.1:51732: EOF
These logs are because of RestExport trying to check if the server is present by pinging it without using any certificates and can be ignored.
Develop Python User Defined Functions using Jupyter Notebook
Jupyter Notebook is an open-source web application that allows you to create and share documents that contain live code, equations, visualizations, and narrative text. Jupyter Notebook supports the latest versions of browsers such as Chrome, Firefox, Safari, Opera, and Edge. Some of the uses of Jupyter Notebook include:
Data cleaning and transformation
Numerical simulation
Statistical modeling
Data visualization
Machine learning, and so on.
The web-based IDE of Jupyter Notebook allows you to develop User Defined Functions (UDFs) in Python. This tool provides an interface for you to interact with the Jupyter Notebook to write, edit, experiment, and create Python UDFs. It works along with the jupyter_connector([WORK_DIR]/IEdgeInsights/common/video/udfs/python/jupyter_connector.py) UDF for enabling the IDE for UDF development. You can use a web browser or Visual Studio Code (VS Code) to use Jupyter Notebook for UDF development.
For more information on how to write and modify an OpenCV UDF, refer to the opencv_udf_template.ipynb([WORK_DIR]/IEdgeInsights/tools/JupyterNotebook/opencv_udf_template.ipynb) (sample OpenCV UDF template). This sample UDF uses the OpenCV APIs to write a sample text on the frames, which can be visualized in the Visualizer display. While using this UDF, ensure that the encoding is disabled. Enabling the encoding will automatically remove the text that is added to the frames.
Note
Custom UDFs, such as GVASafetyGearIngestion, are only applicable to specific use cases. Do not use Jupyter Notebook with these custom UDFs. Instead, modify the
VideoIngestionpipeline to use theGVA ingestorpipeline and modify the config to use thejupyter_connector UDF.
Prerequisites for using Jupyter Notebook
The following are the prerequisites for using Jupyter Notebook to develop UDFs:
Jupyter Notebook requires a set of configs, interfaces, and the public and private keys to be present in etcd. To meet this prerequisite, ensure that an entry for Jupyter Notebook with its relative path from the
IEdgeInsights([WORK_DIR]/IEdgeInsights/)directory is set in any of the.ymlfiles present in the build/usecases([WORK_DIR]/IEdgeInsights/build/usecases) directory.Refer the following example to add the entry in the video-streaming.yml(
[WORK_DIR]/IEdgeInsights/build/usecases/video-streaming.yml) file.AppContexts: ---snip--- - tools/JupyterNotebook
Ensure that in the config of either
VideoIngestionorVideoAnalyticsthe jupyter_connector([WORK_DIR]/IEdgeInsights/common/video/udfs/python/jupyter_connector.py) UDF is enabled to connect to the Jupyter Notebook. Refer the following example to connectVideoIngestiontoJupyterNotebook. Change the config in the config.json([WORK_DIR]/IEdgeInsights/VideoIngestion/config.json):{ "config": { "encoding": { "type": "jpeg", "level": 95 }, "ingestor": { "type": "opencv", "pipeline": "./test_videos/pcb_d2000.avi", "loop_video": true, "queue_size": 10, "poll_interval": 0.2 }, "sw_trigger": { "init_state": "running" }, "max_workers":4, "udfs": [{ "name": "jupyter_connector", "type": "python", "param1": 1, "param2": 2.0, "param3": "str" }] } }
Run Jupyter Notebook from Web Browser
Perform the following steps to develop UDF using the Jupyter Notebook from a web browser:
In the terminal, execute the following command:
python3 builder.py -f usecases/video-streaming.yml
Refer the IEdgeInsights/README.md to provision, build and run the tool along with the EII recipe or stack.
To see the logs, execute the following command:
docker logs -f ia_jupyter_notebook
In the browser, from the logs, copy and paste the URL along with the token. Refer to the following sample URL:
http://127.0.0.1:8888/?token=5839f4d1425ecf4f4d0dd5971d1d61b7019ff2700804b973Note:
If you are accessing the server remotely, replace the IP address ‘127.0.0.1’ with the host IP.
After launching the
Jupyter Notebookservice in a browser, from the list of available files, select the main.ipynb([WORK_DIR]/IEdgeInsights/tools/JupyterNotebook/main.ipynb) file. Ensure that thePython3.8kernel is selected.Due to some security measures, JupyterNotebook sometimes doesn’t allow what it considers to be untrusted code to be run by shutting down the kernel. Ensure you mark your notebooks as Trusted to avoid this issue by selecting the Trust option in the dialog box that appears after clicking on Not Trusted button.
To experiment and test the UDF, you can modify and rerun the process method of the udf_template.ipynb(
[WORK_DIR]/IEdgeInsights/tools/JupyterNotebook/udf_template.ipynb) file.To send parameters to the custom UDF, add them in the
jupyter_connectorUDF config provided for eitherVideoIngestionorVideoAnalyticsservices. You can access the parameters in the udf_template.ipynb([WORK_DIR]/IEdgeInsights/tools/JupyterNotebook/udf_template.ipynb) constructor in theudf_configparameter.Note:
The
udf_configparameter is a dictionary (dict) that contains all these parameters. For more information, refer to the sample UDF from the pcb_filter.py([WORK_DIR]/IEdgeInsights/common/video/udfs/python/pcb/pcb_filter.py) file. After modifying or creating a new UDF, runmain.ipynband then, restart VideoIngestion or VideoAnalytics for which theJupyter Notebookservice has been enabled.To save or export the UDF, click Download as and then, select (.py).
Note:
To use the downloaded UDF, place it in the ../../common/video/udfs/python(
[WORK_DIR]/IEdgeInsights/common/video/udfs/python) directory or integrate it with theCustom UDFs.
Run Jupyter Notebook using Visual Studio Code
Perform the following steps to use Visual Studio Code (VS Code) to develop a UDF:
In the terminal, execute the following command:
python3 builder.py -f usecases/video-streaming.yml
Refer to the IEdgeInsights/README.md to provision, build and run the tool along with the EII recipe or stack.
To see the logs, execute the following command:
docker logs -f ia_jupyter_notebook
In the consolidated
build/docker-compose.ymlfile, for theia_jupyter_notebookservice, changeread_only: truetoread_only: false.Run the
docker-compose up -d ia_jupyter_notebookcommand.In VS Code, install the
Dev Containersextension.Using the shortcut key combination
(Ctrl+Shift+P)access the Command Palette.In the Command Palette, run the
Dev Containers: Attach to Running Containercommand.Select the
ia_jupyter_notebookcontainer.In the
ia_jupyter_notebookcontainer, install thePythonandJupyterextensions.In the Command Palette, run the
Notebook: Select Notebook Kernelcommand.Choose
Select Another Kernelwhen prompted to select the kernel.Select the
Existing Jupyter Serveroption to connect to an existing Jupyter server when prompted to choose a kernel source.Choose
Enter the URL of the running serverwhen prompted to select a Jupyter server.Enter the server’s URI (hostname) with the authentication token (included with a ?token= URL parameter) when prompted to enter the URI of a Jupyter server. Refer to the sample URL mentioned in the previous procedure.
Select
Python 3(ipykernel)kernel when prompted to choose the kernel from remote.Note:
If
Notebook: Select Notebook Kerneloption is not available, use the following steps to run Jupyter NotebookIn the Command Palette, run the
Jupyter: Specify Jupyter server for connectionscommand.Choose
Existing: Specify the URI of an existing serverwhen prompted to select how to connect to Jupyter Notebook.Enter the server’s URI (hostname) with the authentication token (included with a ?token= URL parameter) when prompted to enter the URI of a Jupyter server. Refer to the sample URL mentioned in the previous procedure.
Open the
/home/eiiuserfolder to update the respective udf_template and the main notebooks and rerun.To create a Jupyter notebook, run the
Jupyter: Create New Jupyter Notebookcommand in the Command Palette.To save the UDF, go to More Actions (…), and then, select Export.
When prompted Export As select Python Script.
From the File menu, click Save As.
Select Show Local.
Enter the name and save the file.
Note
You cannot upload files to the workspace in VS Code due to the limitations of the Jupyter Notebook plugin. To use this functionality, access the Jupyter notebook through a web browser.
MQTT Publisher
The MQTT publisher is a tool to help publish the sample sensor data.
Usage
Note
This assumes you have already installed and configured Docker.
Provision, build and bring up the EII stack by following the steps in the README.
Note: By default, the tool publishes temperature data. If the user wants to publish other data, he or she needs to modify the command option in “ia_mqtt_publisher” service in build/docker-compose.yml([WORK_DIR]/IEdgeInsights/build/docker-compose.yml) accordingly and recreate the container using docker-compose up -d command from the build directory.
To publish temperature data to the default topic, the command option by default is set to:
["--temperature", "10:30"]
To publish temperature and humidity data together, change the command option to:
["--temperature", "10:30", "--humidity", "10:30", "--topic_humd", "temperature/simulated/0"]
To publish multiple sensor data sets (temperature, pressure, humidity) to the default topic (temperature/simulated/0, pressure/simulated/0, humidity/simulated/0), change the command option to:
["--temperature", "10:30", "--pressure", "10:30", "--humidity", "10:30"]
To publish a different topic instead of the default topic, change the command option to:
   ["--temperature", "10:30", "--pressure", "10:30", "--humidity", "10:30", "--topic_temp", <temperature topic>, "--topic_pres", <pressure topic>, "--topic_humd", <humidity topic>]

In a single topic, it is possible to publish more than one sensor data. In that case, the same topic name needs to be given for that sensor data.
For publishing data from csv row by row, change the command option to:
["--csv", "demo_datafile.csv", "--sampling_rate", "10", "--subsample", "1"]
To publish JSON files (to test random forest UDF), change the command option to:
["--topic", "test/rfc_data", "--json", "./json_files/*.json", "--streams", "1"]
If one wishes to see the messages going over MQTT, run the subscriber with the following command:
   ./subscriber.sh <port>

Example:
If Broker runs at port 1883, to run subscriber, use the following command:
./subscriber.sh 1883
NodeRedHttpClientApp
This Node-RED in-built HTTP node-based client app acts as a client for the EII RestDataExport and brings the EII Classifier data to the Node-RED ecosystem.
Configure NodeRed
Node-RED provides various options to install and set up Node-RED in your environment. For more information on installation and setup, refer to the Node-RED documenation.
Note
For quick setup, install using docker
docker run -it -p 1880:1880 --name myNodeRed nodered/node-red
Getting EII UDF Classifier result Data to Node-RED Environment Using Node-RED HTTPClient
Note
: RestDataExport should be running already as a prerequisite.
Refer to the RestDataExport Readme
Drag the
http requestnode from Node-RED’s default nodes to your existing workflow.
Update the
propertiesof the node as follows:For
DEV mode:Refer to the dialog properties for setting up the
DEVmode in the Node-Red dashboard
For
PROD Mode:Refer to the dialog properties for setting up the
PRODmode in the Node-RED dashboard.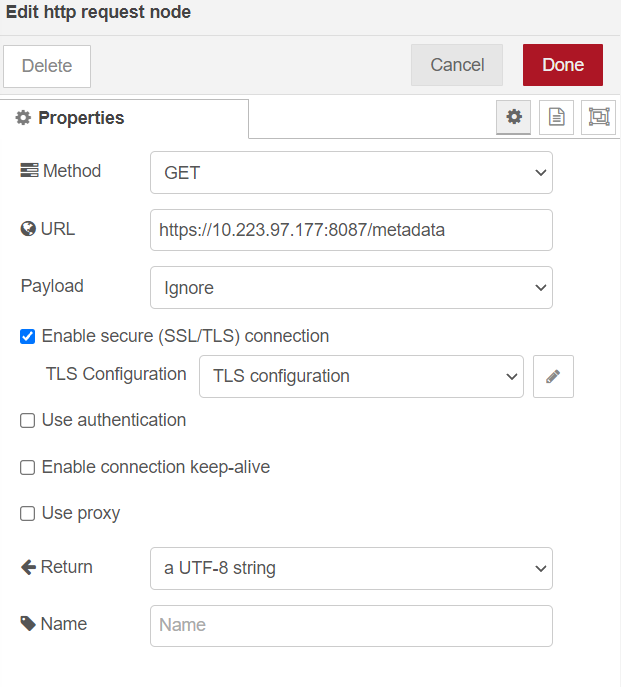
For Prod Mode TLS
ca_cert.pemimport. Note: Thisca_cert.pemwill be part of the EII certificate bundle. Refer to the[WORKDIR]/IEdgeInsights/build/Certificates/directory.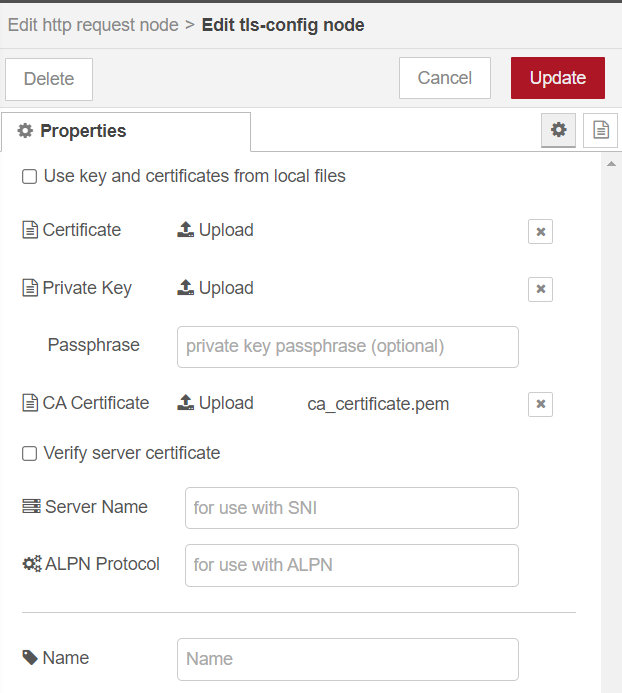
Note:
For the
DEVmode, do not enable or attach the certificates.Update the
IPaddress as per theRestDataExportmodule running on the machine.For more details on Node-RED’s
http requestmodule, refer to Http requset.

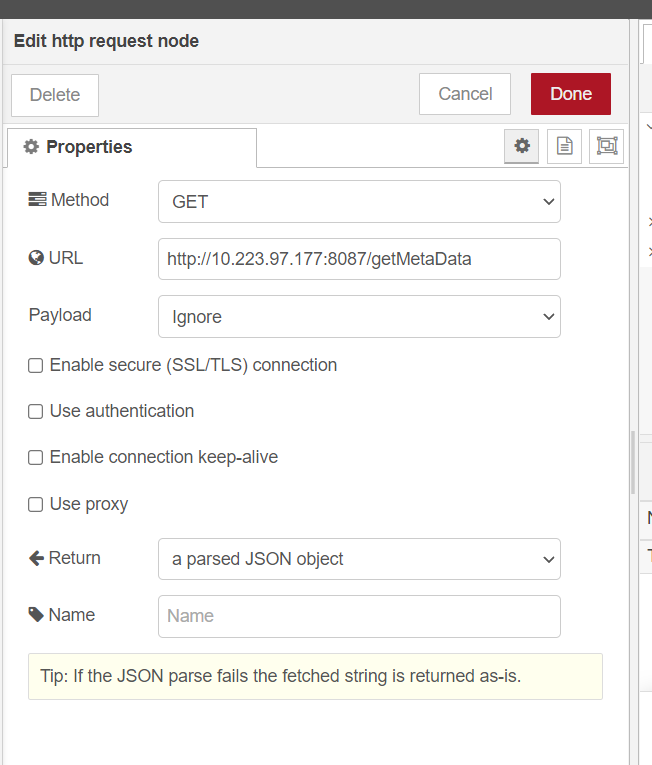


Sample Workflow
The attached workflow document is a sample workflow by updating the RestDataExport IP address in the http request module.
Following is the sample workflow:
Import the Sample Workflow flows.json(
[WORK_DIR]/IEdgeInsights/tools/NodeRedHttpClientApp/flows.json) file to the NodeRed dashboard usingmenuicon in the top right corner as follows:
Click
ImportUpdate the
URLof thehttp requestnode with theRestDataExportmodule running on the machine’s IP addressNote:
For more detail, refer to [import export] (https://nodered.org/docs/user-guide/editor/workspace/import-export)
The classifier results will be logged in the debug window.

Software Trigger Utility for VideoIngestion Module
This utility is used for invoking various software trigger features of VideoIngestion. The currently supported triggers for the VideoIngestion module are:
START INGESTION-to start the ingestor
STOP_INGESTION-to stop the ingestor
SNAPSHOT-to get a frame snapshot, which feeds one frame into the video data pipeline.
Software Trigger Utilily Prerequisites
SWTriggerUtility expects a set of config, interfaces, and public private keys to be present in ETCD as a prerequisite.
To achieve this, ensure an entry for SWTriggerUtility with its relative path from the IEdgeInsights([WORK_DIR]/IEdgeInsights/) directory is set in any of the .yml files present in build/usecases([WORK_DIR]/IEdgeInsights/build/usecases) directory.
An example has been provided below to add the entry in video-streaming.yml(
[WORK_DIR]/IEdgeInsights/build/usecases/video-streaming.yml)AppContexts: ---snip--- - tools/SWTriggerUtility
Configuration File
config.json is the configuration file used for sw_trigger_utility.
Field |
Meaning |
Type of the value |
|---|---|---|
|
|
|
|
|
|
|
|
|
Note
When working with GigE cameras, which requires network_mode: host, update the EndPoint key of the SWTriggerUtility interface in config.json([WORK_DIR]/IEdgeInsights/tools/SWTriggerUtility/config.json) to have the host system IP instead of the service name of the server.
Example: In order to connect to the ia_video_ingestion service, which is configured with a GigE camera refer the following EndPoint change in the SWTriggerUtility interface:
{
    "Clients": [
        {
            "EndPoint": "<HOST_SYSTEM_IP>:64013",
            "Name": "default",
            "ServerAppName": "VideoIngestion",
            "Type": "zmq_tcp"
        }
    ]
}
If one needs to change the values in config.json(
[WORK_DIR]/IEdgeInsights/tools/SWTriggerUtility/config.json), then ensure to re-run the steps mentioned in pre-requisites section to see the updated changes are getting appliedORone can choose to update the config key of SWTriggerUtility app via ETCD UI and then restart the application.
This utility works in both DEV & PROD mode. As a pre-requisite, ensure to turn ON the flag corresponding to “dev_mode” to true or false in the config.json file.
Running Software Trigger Utility
EII services can be run in prod or dev mode by setting
DEV_MODEvalue accordingly in build/.env([WORK_DIR]/IEdgeInsights/build/.env)Execute builder.py script:
cd [WORKDIR]/IEdgeInsights/build/
python3 builder.py -f usecases/video-streaming.yml
NOTE: The same yml file to which the SWTriggerUtility entry was added in pre-requisites must be selected while running the pre-requisites
Usage of Software Trigger Utility
By default, the Software Trigger Utility container will not execute anything, and one needs to interact with the running container to generate the trigger commands. Ensure the video ingestion (VI) service is up and ready to process the commands from the utility.
The software trigger utility can be used in the following ways:
“START INGESTION” -> “allows ingestion for the default time (120 seconds being the default)” -> “STOP INGESTION”
cd [WORKDIR]/IEdgeInsights/build
docker-compose run --rm --entrypoint "./sw_trigger_utility" ia_sw_trigger_utility
“START INGESTION” -> “allows ingestion for a user-defined time (configurable time in seconds)” -> “STOP INGESTION”
cd [WORKDIR]/IEdgeInsights/build
docker-compose run --rm --entrypoint "./sw_trigger_utility 300" ia_sw_trigger_utility
Note: In the previous example, VideoIngestion starts, then does ingestion for 300 seconds, then stops ingestion after 300 seconds, and the cycle repeats for the number of cycles configured in the config.json.
Selectively send the START_INGESTION software trigger:
cd [WORKDIR]/IEdgeInsights/build
docker-compose run --rm --entrypoint "./sw_trigger_utility START_INGESTION" ia_sw_trigger_utility
Selectively send the STOP_INGESTION software trigger:
cd [WORKDIR]/IEdgeInsights/build
docker-compose run --rm --entrypoint "./sw_trigger_utility STOP_INGESTION" ia_sw_trigger_utility
Selectively send the SNAPSHOT software trigger:
cd [WORKDIR]/IEdgeInsights/build
docker-compose run --rm --entrypoint "./sw_trigger_utility SNAPSHOT" ia_sw_trigger_utility
Note
If duplicate START_INGESTION or STOP_INGESTION sw_triggers are sent by mistake, then the VI is capable of catching these duplicates and responding back to the client, conveying that duplicate triggers were sent and requesting to send proper sw_triggers.
In order to send the SNAPSHOT trigger, ensure that the ingestion is stopped. If the START_INGESTION trigger was previously sent, use the STOP_INGESTION trigger to stop the ingestion.
EII TimeSeriesProfiler
This module calculates the SPS (Samples Per Second) of any EII time-series modules based on the stream published by that respective module.
This module calculates the average end-to-end time for every sample of data to be processed and its breakup. The end-to-end is required for a metric from mqtt-publisher to TimeSeriesProfiler (mqtt-publisher->telegraf->influx->kapacitor->influx->datastore->TimeSeriesProfiler).
Prerequisites
TimeSeriesProfiler expects a set of config, interfaces and public or private keys to be present in ETCD as a prerequisite. To achieve this, ensure an entry for TimeSeriesProfiler with its relative path from IEdgeInsights(
[WORK_DIR]/IEdgeInsights/) directory is set in the time-series.yml file present in build/usecases([WORK_DIR]/IEdgeInsights/build/usecases) directory. Following is an example:AppContexts: - ConfigMgrAgent - Visualizer/multimodal-data-visualization-streaming/eii/ - Visualizer/multimodal-data-visualization/eii - DataStore - Kapacitor - Telegraf - tools/TimeSeriesProfiler
With the previous pre-requisite done, please run the following command:
python3 builder.py -f ./usecases/time-series.yml
EII TimeSeriesProfiler Mode
By default, the EII TimeSeriesProfiler supports two modes, which are “sps” and “monitor” mode.
SPS mode
This mode is enabled by setting the “mode” key in config(
[WORK_DIR]/IEdgeInsights/tools/TimeSeriesProfiler/config.json) to “sps”. This mode calculates the samples per second of any EII module by subscribing to that module’s respective stream."mode": "sps"
Monitor mode
This mode is enabled by setting the “mode” key in config(
[WORK_DIR]/IEdgeInsights/tools/TimeSeriesProfiler/config.json) to “monitor”. This mode calculates average and per-sample stats.Refer to the following example config where TimeSeriesProfiler is used in monitor mode:
    "config": {
    "mode": "monitor",
    "monitor_mode_settings": {
                                "display_metadata": false,
                                "per_sample_stats":false,
                                "avg_stats": true
                            },
    "total_number_of_samples" : 5,
    "export_to_csv" : false
}
"mode": "monitor"
The stats to be displayed by the tool in monitor_mode can be set in the monitor_mode_settings key of config.json(
[WORK_DIR]/IEdgeInsights/tools/TimeSeriesProfiler/config.json).‘display_metadata’:It displays the raw meta-data with timestamps associated with every sample.
‘per_sample_stats’:It continuously displays the per-sample metrics of every sample.
‘avg_stats’:It continuously displays the average metrics of every sample.
Note
Running in profiling or monitoring mode requires the following prerequisites: PROFILING_MODE should be set to true in .env(
[WORK_DIR]/IEdgeInsights/build/.env) time series containers.For running TimeSeriesProfiler in SPS mode, it is recommended to keep PROFILING_MODE set to false in .env(
[WORK_DIR]/IEdgeInsights/build/.env) for better performance.
EII TimeSeriesProfiler Configuration
total_number_of_samples
If mode is set to’sps’, the average SPS is calculated for the number of samples set by this variable. If mode is set to ‘monitor’, the average stats are calculated for the number of samples set by this variable. Setting it to (-1) will run the profiler forever unless terminated by stopping the container TimeSeriesProfiler manually. total_number_of_samples should never be set as (-1) for ‘sps’ mode.
export_to_csv
Setting this switch to true exports csv files for the results obtained in TimeSeriesProfiler. For monitor_mode, runtime stats printed in the csv are based on the following precdence: avg_stats, per_sample_stats, display_metadata.
Running TimeSeriesProfiler
Prerequisite:
Profiling UDF returns “ts_kapacitor_udf_entry” and “ts_kapacitor_udf_exit” timestamps.
The following are two examples:
profiling_udf.go(
[WORK_DIR]/IEdgeInsights/Kapacitor/udfs/profiling_udf.go)rfc_classifier.py(
[WORK_DIR]/IEdgeInsights/Kapacitor/udfs/rfc_classifier.py)
Additional: Adding timestamps in ingestion and UDFs:
To enable a user’s own ingestion and UDFs, timestamps must be added to the ingestion and UDFs modules, respectively.The TS Profiler needs three timestamps:
#. “ts” timestamp which is to be filled by the ingestor (done by the mqtt-publisher app). #.
The UDF must give “ts_kapacitor_udf_entry” and “ts_kapacitor_udf_exit” timestamps to profile the UDF execution time.
ts_kapacitor_udf_entry:timestamp in UDF before execution of the algorithm
ts_kapacitor_udf_exit:timestamp in UDF after execution of the algorithm.
The sample profiling UDFs can be referred to at profiling_udf.go(
[WORK_DIR]/IEdgeInsights/Kapacitor/udfs/profiling_udf.go) and rfc_classifier.py([WORK_DIR]/IEdgeInsights/Kapacitor/udfs/rfc_classifier.py).The configuration required to run profiling_udf.go as a profiling UDF
In Kapacitor config.json(``[WORK_DIR]/IEdgeInsights/Kapacitor/config.json``) , update “task” key as follows:
"task": [{ "tick_script": "profiling_udf.tick", "task_name": "profiling_udf", "udfs": [{ "type": "go", "name": "profiling_udf" }] }]
In kapacitor.conf(``[WORK_DIR]/IEdgeInsights/Kapacitor/config/kapacitor.conf``), update udf section:
[udf.functions] [udf.functions.profiling_udf] socket = "/tmp/profiling_udf" timeout = "20s"
The configuration required to run rfc_classifier.py as a profiler UDF is as follows:
In Kapacitor config.json(``[WORK_DIR]/IEdgeInsights/Kapacitor/config.json``) , update “task” key as follows:
"task": [{ { "tick_script": "rfc_task.tick", "task_name": "random_forest_sample" } }]
In kapacitor.conf(``[WORK_DIR]/IEdgeInsights/Kapacitor/config/kapacitor.conf``) update udf section:
[udf.functions.rfc] prog = "python3.7" args = ["-u", "/EII/udfs/rfc_classifier.py"] timeout = "60s" [udf.functions.rfc.env] PYTHONPATH = "/EII/go/src/github.com/influxdata/kapacitor/udf/agent/py/"
Keep the config.json(
[WORK_DIR]/IEdgeInsights/tools/TimeSeriesProfiler/config.json) file as follows:{ "config": { "total_number_of_samples": 10, "export_to_csv": "False" }, "interfaces": { "Subscribers": [ { "Name": "default", "Type": "zmq_tcp", "EndPoint": "ia_datastore:65032", "PublisherAppName": "DataStore", "Topics": [ "rfc_results" ] } ] } }
In .env(
[WORK_DIR]/IEdgeInsights/build/.env): Set the profiling mode to true.
Set environment variables accordingly in config.json(
[WORK_DIR]/IEdgeInsights/tools/TimeSeriesProfiler/config.json).
#. Set the required output stream or streams and the appropriate stream config in the config.json([WORK_DIR]/IEdgeInsights/tools/TimeSeriesProfiler/config.json) file.
#.
To run this tool in IPC mode, the user must make the following changes to the subscribers interface section of [config.json] (./config.json)**:
{ "type": "zmq_ipc", "EndPoint": "/EII/sockets" }
To provision, build, and run the tool along with the EII time-series recipe or stack, see README.md.
Run the following command to see the logs:
docker logs -f ia_timeseries_profiler
EII Video Profiler
This tool can be used to determine the complete metrics involved in the entire video pipeline by measuring the time difference between every component of the pipeline and checking for queue blockages at every component, thereby determining the fast or slow components of the whole pipeline. It can also be used to calculate the FPS of any EII modules based on the stream published by that respective module.
EII Video Profiler Prerequisites
- VideoProfiler expects a set of config, interfaces, and public private keys to be present in ETCD as a prerequisite.
To achieve this, ensure an entry for VideoProfiler with its relative path from IEdgeInsights(
[WORK_DIR]/IEdgeInsights/) directory is set in any of the.yml files present in build/usecases([WORK_DIR]/IEdgeInsights/build/usecases) directory. Following is an example:
AppContexts: - VideoIngestion - VideoAnalytics - tools/VideoProfiler
With the previous prerequisite done, run the following command:
python3 builder.py -f usecases/video-streaming.yml
EII Video Profiler Modes
By default, the EII Video Profiler supports the FPS and the Monitor modes. The following are details for these modes:
FPS mode Enabled by setting the’mode’ key in config(
[WORK_DIR]/IEdgeInsights/tools/VideoProfiler/config.json) to ‘fps’, this mode calculates the frames per second of any EII module by subscribing to that module’s respective stream."mode": "fps"
Note: For running the Video Profiler in the FPS mode, it is recommended to keep PROFILING_MODE set to false in .env(
[WORK_DIR]/IEdgeInsights/build/.env) for better performance.Monitor mode Enabled by setting the ‘mode’ key in config(
[WORK_DIR]/IEdgeInsights/tools/VideoProfiler/config.json) to ‘monitor’, this mode calculates average and per-frame stats for every frame while identifying if the frame was blocked at any queue of any module across the video pipeline, thereby determining the fastest and slowest components in the pipeline. To be performant in profiling scenarios, VideoProfiler is enabled to work when subscribing only to a single topic in monitor mode.
The user must ensure that the ingestion_appname and analytics_appname fields of the monitor_mode_settings need to be set accordingly for monitor mode.
Refer to the following example configuration where VideoProfiler is used in monitor mode to subscribe to PySafetyGearAnalytics CustomUDF results.
"config": {
"mode": "monitor",
"monitor_mode_settings": {
"ingestion_appname": "PySafetyGearIngestion",
"analytics_appname": "PySafetyGearAnalytics",
"display_metadata": false,
"per_frame_stats":false,
"avg_stats": true
},
"total_number_of_frames" : 5,
"export_to_csv" : false
}
"mode": "monitor"
The stats to be displayed by the tool in monitor_mode can be set in the monitor_mode_settings key of config.json([WORK_DIR]/IEdgeInsights/tools/VideoProfiler/config.json).
‘display_metadata’: It displays the raw meta-data with timestamps associated with every frame.
‘per_frame_stats’: It continuously displays the per-frame metrics of every frame.
‘avg_stats’: It continuously displays the average metrics of every frame.
Note
As a prerequisite for running in profiling or monitor mode, VI/VA should be running with the PROFILING_MODE set to true in .env(
[WORK_DIR]/IEdgeInsights/build/.env)It is mandatory to have a UDF to run in monitor mode. For instance, GVASafetyGearIngestion does not have any UDF (since it uses GVA elements), so it will not be supported in monitor mode. The workaround to use GVASafetyGearIngestion in the monitor mode is to add dummy-udf in GVASafetyGearIngestion-config(
[WORK_DIR]/IEdgeInsights/CustomUdfs/GVASafetyGearIngestion/config.json).
EII Video Profiler Configuration
Following are the EII Video Profiler configurations:
dev_mode
Setting this to false enables secure communication with the EII stack. The user must ensure this switch is in sync with DEV_MODE in .env(
[WORK_DIR]/IEdgeInsights/build/.env) with PROD mode enabled, the path for the certs mentioned in config([WORK_DIR]/IEdgeInsights/tools/VideoProfiler/config.json) can be changed by the user to point to the required certs.total_number_of_frames
If mode is set to ‘fps’, the average FPS is calculated for the number of frames set by this variable. If mode is set to “monitor”, the average stats are calculated for the number of frames set by this variable. Setting it to (-1) will run the profiler forever unless terminated by signal interrupts(‘Ctrl+C’).total_number_of_frames should never be set as (-1) for ‘fps’ mode.
export_to_csv
Setting this switch to true exports csv files for the results obtained in VideoProfiler. For monitor_mode, runtime stats printed in the csv are based on the following precdence: avg_stats, per_frame_stats, display_metadata.
Run Video Profiler
Following are the steps to run the video profiler:
Set the environment variables accordingly in config.json(
[WORK_DIR]/IEdgeInsights/tools/VideoProfiler/config.json).Set the required output stream or streams and the appropriate stream config in the config.json(
[WORK_DIR]/IEdgeInsights/tools/VideoProfiler/config.json) file.If VideoProfiler is subscribing to multiple streams, ensure the AppName of VideoProfiler is added to the Clients list of all the publishers.
If using Video Profiler in IPC mode, ensure to set the required permissions to socket file created in SOCKET_DIR in build/.env(
[WORK_DIR]/IEdgeInsights/build/.env).sudo chmod -R 777 /opt/intel/eii/sockets
Note:
This step is required every time the publisher is restarted in IPC mode.
Caution: This step will make the streams insecure. Do not do it on a production machine.
Refer the following VideoProfiler interface example to subscribe to PyMultiClassificationIngestion CustomUDF results in the FPS mode:
"/VideoProfiler/interfaces": { "Subscribers": [ { "EndPoint": "/EII/sockets", "Name": "default", "PublisherAppName": "PyMultiClassificationIngestion", "Topics": [ "py_multi_classification_results_stream" ], "Type": "zmq_ipc" } ] },
If you’re using VideoProfiler with the Helm usecase or trying to subscribe to any external publishers outside the EII network, ensure the correct IP of the publisher is specified in the interfaces section of [config] (config.json) and the correct ETCD host and port are specified in the environment for ETCD_ENDPOINT and ETCD_HOST.
For example, for the helm use case, since the ETCD_HOST and ETCD_PORT are different, run the following commands with the required HOST IP:
export ETCD_HOST="<HOST IP>" export ETCD_ENDPOINT="<HOST IP>:32379"
To provision, build, and run the tool along with the EII video-streaming recipe or stack, see provision/README.md.
Ensure the containers VideoProfiler is subscribing to are up and running before trying to bring up VideoProfiler.
For example, if VideoProfiler is subcribed to VideoAnalytics, use these commands to bring up the entire EII stack and then restart VideoProfiler once the publishing containers are up and running:
docker-compose up -d # Restart VideoProfiler after the publisher is up # by checking the logs docker restart ia_video_profiler
Run the following command to see the logs:
docker logs -f ia_video_profiler
The runtime stats of Video Profiler, if enabled with the export_to_csv switch, can be found at [video_profiler_runtime_stats]. (video_profiler_runtime_stats.csv)
Note:
poll_intervaloption in the VideoIngestion config([WORK_DIR]/IEdgeInsights/VideoIngestion/config.json) sets the delay(in seconds) to be induced after every consecutive frame is read by the opencv ingestor. Not setting it will ingest frames without any delay.videorateelement in the VideoIngestion config([WORK_DIR]/IEdgeInsights/VideoIngestion/config.json) can be used to modify the ingestion rate for gstreamer ingestor. For more information refer to README.ZMQ_RECV_HWMoption specifies the maximum number of inbound messages on the subscriber socket. The high water is a hard limit on the maximum number of outstanding messages ZeroMQ shall queue in memory for any single peer that the specified socket is communicating. If this limit has been reached, the socket shall enter an exeptional state and will reject any incoming messages.If we are running Video Profiler for the GVA use case, we do not display the stats of the algorithm running with GVA since no UDFs are used.
The rate at which the UDFs process the frames can be measured using the FPS UDF and the ingestion rate can be monitored accordingly. If multiple UDFs are used, the FPS UDF is required to be added as the last UDF.
If running this tool with VI and VA in two different nodes, the same time needs to be set in both the nodes.
Run VideoProfiler with EdgeVideoAnalyticsMicroservice
For running VideoProfiler with EdgeVideoAnalyticsMicroservice as a publisher, the config can be updated to subscribe to the EndPoint and topic of EdgeVideoAnalyticsMicroservice in the following way:
{
"interfaces": {
"Subscribers": [
{
"Name": "default",
"Type": "zmq_tcp",
"EndPoint": "ia_edge_video_analytics_microservice:65114",
"PublisherAppName": "EdgeVideoAnalyticsMicroservice",
"Topics": [
"edge_video_analytics_results"
]
}
]
}
}
Run VideoProfiler in Helm Use Case
For running VideoProfiler in the helm use case to subscribe to either VideoIngestion or VideoAnalytics or any other EII service, the etcd endpoint, volume mount for helm certs, and service endpoints are to be updated.
For connecting to the ETCD server running in the helm environment, the endpoint and required volume mounts should be modified in the following manner in the environment and volumes section of docker-compose.yml([WORK_DIR]/IEdgeInsights/tools/VideoProfiler/docker-compose.yml):
ia_video_profiler:
...
environment:
...
ETCD_HOST: ${ETCD_HOST}
ETCD_CLIENT_PORT: ${ETCD_CLIENT_PORT}
# Update this variable referring
# for helm use case
ETCD_ENDPOINT: <HOST_IP>:32379
CONFIGMGR_CERT: "/run/secrets/VideoProfiler/VideoProfiler_client_certificate.pem"
CONFIGMGR_KEY: "/run/secrets/VideoProfiler/VideoProfiler_client_key.pem"
CONFIGMGR_CACERT: "/run/secrets/rootca/cacert.pem"
...
volumes:
- "${EII_INSTALL_PATH}/tools_output:/app/out"
- "${EII_INSTALL_PATH}/sockets:${SOCKET_DIR}"
- ./helm-eii/eii-deploy/Certificates/rootca:/run/secrets/rootca
- ./helm-eii/eii-deploy/Certificates/VideoProfiler:/run/secrets/VideoProfiler
For connecting to any service running in the helm usecase, the container IP associated with the specific service should be updated in the Endpoint section in VideoProfiler config([WORK_DIR]/IEdgeInsights/tools/VideoProfiler/config.json).
The IP associated with the service container can be obtained by checking the container pod IP using docker inspect. Assuming we are connecting to the VideoAnalytics service, execute the following command:
docker inspect <VIDEOANALYTICS CONTAINER ID> | grep VIDEOANALYTICS
The output of the previous command consists of the IP of the VideoAnalytics container that can be updated in the VideoProfiler config using EtcdUI:
"VIDEOANALYTICS_SERVICE_HOST=10.99.204.80"
The config can be updated with the obtained container IP in the following way:
{
"interfaces": {
"Subscribers": [
{
"Name": "default",
"Type": "zmq_tcp",
"EndPoint": "10.99.204.80:65013",
"PublisherAppName": "VideoAnalytics",
"Topics": [
"camera1_stream_results"
]
}
]
}
}
Optimize EII Video Pipeline by Analysing Video Profiler Results
If the VI ingestor/UDF input queue is blocked, consider reducing the ingestion rate.
If this log is displayed by the Video Profiler tool, it indicates that the ingestion rate is too high or that the VideoIngestion UDFs are slow and causing latency throughout the pipeline. As per the log suggests, the user can increase the poll_interval to an optimum value to reduce the blockage of the VideoIngestion ingestor queue, thereby optimizing the video pipeline in the case of using the openCV ingestor. If Gstreamer ingestor is used, the videorate option can be optimized by following the README.
If the VA subs or UDF input queue is blocked, reduce the ZMQ_RECV_HWM value or the ingestion rate.
If this log is displayed by the Video Profiler tool, it indicates that the VideoAnalytics UDFs are slow and causing latency throughout the pipeline. As per the log suggests, the user can consider reducing ZMQ_RECV_HWM to an optimum value to free the VideoAnalytics UDF input or subscriber queue by dropping incoming frames or reducing the ingestion rate to a required value.
If the UDF VI output queue is blocked,
If this log is displayed by the Video Profiler tool, it indicates that the VI to VA message bus transfer is delayed.
Users can consider reducing the ingestion rate to a required value.
The user can increase ZMQ_RECV_HWM to an optimum value so as to not drop the frames when the queue is full or switching to the IPC mode of communication.
If the UDF VA output queue is blocked,
If this log is displayed by the Video Profiler tool, it indicates that the VA to VideoProfiler message bus transfer is delayed.
User can consider reducing the ingestion rate to a required value.
The user can increase ZMQ_RECV_HWM to an optimum value so as to not drop the frames when the queue is full or switching to the IPC mode of communication.
Benchmarking with Multi-instance Config
EII supports multi-instance config generation for benchmarking purposes. This is accomplished by running the builder.py(
[WORK_DIR]/IEdgeInsights/build/builder.py) with specific parameters, refer to the Multi-instance Config Generation section of EII Pre-requisites in the README for more details.For running VideoProfiler for multiple streams, run the builder with the -v flag provided the pre-requisites mentioned previously are done. The following is an example for generating 6 streams config:
python3 builder.py -f usecases/video-streaming.yml -v 6
Note
For multi-instance monitor mode use case, ensure only VideoIngestion and VideoAnalytics are used as AppName for the Publishers.
Running VideoProfiler with CustomUDFs for monitor mode is supported for single stream only. If multiple streams are required, ensure VideoIngestion & VideoAnalytics are used as AppName.
In IPC mode, for accelerators:
MYRIAD,GPU, and USB 3.0 Vision cameras, adduser: rootin VideoProfiler-docker-compose.yml([WORK_DIR]/IEdgeInsights/docker-compose.yml) as the subscriber needs to run asrootif the publisher is running asroot.
EII Samples
Sample Apps
This section provides more information about the Edge Insights for Industrial (EII) sample apps and how to use the core libraries packages like Utils, Message Bus, and ConfigManager in various flavors of Linux such as Ubuntu and Alpine operating systems or docker images for programming languages such as C++, Go, and Python.
The following table shows the details for the supported flavors of Linux operating systems or docker images and programming languages that support sample apps:
Linux Flavor |
Languages |
|---|---|
|
|
|
|
The sample apps are classified as publisher and subscriber apps. For more information, refer to the following:
Run the Samples Apps
For default scenario, the sample custom UDF containers are not the mandatory containers to run. The builder.py script runs the sample-apps.yml from the build/usecases([WORK_DIR]/IEdgeInsights/build/usecases) directory and adds all the sample apps containers. Refer to the following list to view the details of the sample apps containers:
AppContexts:
# CPP sample apps for Ubuntu and Alpine operating systems or docker images
- Samples/publisher/cpp/ubuntu
- Samples/publisher/cpp/alpine
- Samples/subscriber/cpp/ubuntu
- Samples/subscriber/cpp/alpine
# Python sample apps for Ubuntu operating systems or docker images
- Samples/publisher/python/ubuntu
- Samples/subscriber/python/ubuntu
# Go sample apps for Ubuntu and Alpine operating systems or docker images
- Samples/publisher/go/ubuntu
- Samples/publisher/go/alpine
- Samples/subscriber/go/ubuntu
- Samples/subscriber/go/alpine
To run the
sample-apps.ymlfile, execute the following command:cd [WORKDIR]/IEdgeInsights/build python3 builder.py -f ./usecases/sample-apps.yml file used>
Refer to Build EII stack and the Run EII service sections to build and run the sample apps.
Web Deployment Tool
Web Deployment Tool is a GUI tool to facilitate EII configuration and deployment for single and multiple video streams.
Web Deployment Tool features include:
Offers GUI interface to try out EII stack for video use case
Supports multi-instance feature of VI/VA services
Supports an easy way to use or modify existing UDFs or add new UDFs
Supports preview to visualize the analyzed frames
Supports deployment of the tested configuration on other remote nodes via ansible
To learn about launching and using the Web Deployment Tool, refer to the following:
Ansible
Ansible based EII Prequisites setup, provisioning, build and deployment
Ansible is an automation engine which can enable Edge Insights for Industrial (EII) deployment across single nodes. One control node is required where ansible is installed and optional hosts. Control node itself can be used to deploy EII.
Note
In this document, you will find labels of ‘Edge Insights for Industrial (EII)’ for filenames, paths, code snippets, and so on.
Ansible can execute the tasks on control node based on the playbooks defined
There are three types of nodes:
Control node where ansible must be installed.
EII leader node where ETCD server will be running and optional worker nodes, all worker nodes remotely connect to ETCD server running on leader node.
Control node and EII leader node can be the same.
Installing Ansible on Ubuntu {Control node}
Execute the following command in the identified control node machine.
```sh
sudo apt update
sudo apt install software-properties-common
sudo apt-add-repository --yes --update ppa:ansible/ansible
sudo apt install ansible
```
Prerequisite Steps Required for all the Control/Worker Nodes
Generate SSH KEY for all Nodes
Generate the SSH KEY for all nodes using following command (to be executed in the only control node), ignore to run this command if you already have ssh keys generated in your system without id and passphrase,
ssh-keygen
Note
Do not give any passphrase and id, just press Enter for all the prompt which will generate the key.
For Example,
$ ssh-keygen
Generating public/private rsa key pair.
Enter file in which to save the key (/root/.ssh/id_rsa): <ENTER>
Enter passphrase (empty for no passphrase): <ENTER>
Enter same passphrase again: <ENTER>
Your identification has been saved in ~/.ssh/id_rsa.
Your public key has been saved in ~/.ssh/id_rsa.pub.
The key fingerprint is:
SHA256:vlcKVU8Tj8nxdDXTW6AHdAgqaM/35s2doon76uYpNA0 root@host
The key's randomart image is:
+---[RSA 2048]----+
| .oo.==*|
| . . o=oB*|
| o . . ..o=.=|
| . oE. . ... |
| ooS. |
| ooo. . |
| . ...oo |
| . .*o+.. . |
| =O==.o.o |
+----[SHA256]-----+
Updating the Leader Information for Using Remote Hosts
Note
By default both control/leader node ansible_connection will be localhost in single node deployment.
Follow the steps to update the details of leader node for remote node scenario.
Update the hosts information in the inventory file
hosts[group_name] <nodename> ansible_connection=ssh ansible_host=<ipaddress> ansible_user=<machine_user_name> For Example'[targets] leader ansible_connection=ssh ansible_host=192.0.0.1 ansible_user=user1
Note
ansible_connection=sshis mandatory when you are updating any remote hosts, which makes ansible to connect viassh.The above information is used by ansible to establish ssh connection to the nodes.
control node will always be
ansible_connection=local, don’t update the control node’s informationTo deploy EII in single ,
ansible_connection=localandansible_host=localhostTo deploy EII on remote node,
ansible_connection=sshandansible_host=<remote_node_ip>andansible_user=
Updating the EII Source Folder, Usecase and Proxy Settings in Group Variables
Open
group_vars/all.ymlfilevi group_vars/all.ymlUpdate Proxy Settings
enable_system_proxy: true http_proxy: <proxy_server_details> https_proxy: <proxy_server_details> no_proxy: <managed_node ip>,<controller node ip>,<worker nodes ip>,localhost,127.0.0.1
Update the
EII Secretsusername and passwords ingroup_vars/all.ymlrequired to run few EII Services inPRODmode onlyUpdate the
usecasevariable, based on the usecasebuilder.pygenerates the EII deployment and config files.Note
By default it will be
video-streaming, For other usecases refer the../usecasesfolder and update only names without.ymlextensionFor
allusecase, it will bring up alldefaultservices of eii.ia_kapacitorandia_telegrafcontainer images are not distributed via docker hub, so one won’t be able to pull these images for time-series use case upon using ../usecases/time-series.yml([WORK_DIR]/IEdgeInsights/build/usecases/time-series.yml) for deployment. For more details, refer to [../README.md#distribution-of-eii-container-images]> (../README.md#distribution-of-eii-container-images).
For Example, if you want build & deploy for
../usecases/time-series.ymlupdate theusecasekey value astime-seriesusecase: <time-series>Optionally, you can choose number of video pipeline instances to be created by updating
instancesvariableUpdate other optional variables provided if required
Remote Node Deployment
Follwoing configuration changes need to be made for remote node deployment without k8s
#. Single node deployment all the services based on the usecase chosen will be deployed.
#.
Update
dockerregistry details in following section if using a custom/private registrydocker_registry="<regsitry_url>" docker_login_user="<username>" docker_login_passwd="<password>"Note Use of
docker_registryandbuildflags are as follows:
Update the
docker_registrydetails to use docker images from custom registry, optionally setbuild: trueto push docker images to this registryUnset the
docker_registrydetails if you do not want to use custom registry and setbuild: trueto save and load docker images from one node to another node
If you are using images from docker hub, then set
build: falseand unsetdocker_registrydetails
Execute Ansible Playbook from [EII_WORKDIR]/IEdgeInsights/build/ansible {Control node} to deploy EII services in control node/remote node
Note
Updating messagebus endpoints to connect to interfaces is still the manual process. ensure to update Application specific endpoints in
[AppName]/config.jsonAfter
pre-requisitesare successfully installed, Ensure to logout and login to apply the changesIf you are facing issues during installation of docker, remove all
bionicrelated entries of docker from the sources.list and keyring gpg.
For Single Point of Execution
Note
This will execute all the steps of EII as prequisite, build, provision, deploy & setup all nodes for deployement usecase in one shot sequentialy.
ansible-playbook eii.yml
Following Steps are the Individual Execution of Setups.
Load
.envvalues from templateansible-playbook eii.yml --tags "load_env"
For EII Prequisite Setup
ansible-playbook eii.yml --tags "prerequisites"
Note After
pre-requisitesare successfully installed, please do logout and login to apply the changesTo generate builder and config files, build images and push to registry
ansible-playbook eii.yml --tags "build"
To generate eii bundles for deployment
ansible-playbook eii.yml --tags "gen_bundles"
To deploy the eii modules
ansible-playbook eii.yml --tags "deploy"
Deploying EII Using Helm in Kubernetes (k8s) Environment
Note
To Deploy EII using helm in k8s aenvironment,
k8ssetup is a prerequisite.You need update the
k8sleader machine as leader node inhostsfile.Non
k8sleader machine thehelmdeployment will fail.For
k8sdeploymentremote_nodeparameters will not applicable, Since node selection & pod selection will be done byk8sorchestrator.Make sure you are deleting
/opt/intel/eii/datawhen switch fromprodmode todevmode in all yourk8sworkernodes.
Update the
DEPLOYMENT_MODEflag ask8singroup_vars/all.ymlfile:Open
group_vars/all.ymlfilevi group_vars/all.ymlUpdate the
DEPLOYMENT_MODEflag ask8s## Deploy in k8s mode using helm DEPLOYMENT_MODE: "k8s" ## Update "EII_HOME_DIR" to point to EII workspace when `DEPLOYMENT_MODE: "k8s"`. Eg: `EII_HOME_DIR: "/home/username/<dir>/IEdgeInsights/"` EII_HOME_DIR: ""
Save and Close
For Single Point of Execution
Note This will execute all the steps of EII as prequisite, build, provision, deploy for a usecase in one shot sequentialy.
ansible-playbook eii.yml
Note
Below steps are the individual execution of setups.
Load
.envvalues from templateansible-playbook eii.yml --tags "load_env"
For EII Prequisite Setup
ansible-playbook eii.yml --tags "prerequisites"
For building EII containers
ansible-playbook eii.yml --tags "build"
Prerequisites for deploy EII using Ansible helm environment.
ansible-playbook eii.yml --tags "helm_k8s_prerequisites"
Provision and Deploy EII Using Ansible helm environment
ansible-playbook eii.yml --tags "helm_k8s_deploy"
Universal Wellpad Controller
1.0 Introduction
Universal Wellpad Controller is a reference design for a secured management platform that provides third party application developers an easy access to data services including data collection from field devices, control data pathways, and connections to centralized data systems (i.e., SCADA) for Upstream Oil and Gas facilities, including gas well sites.
Universal Wellpad Controller platform will provide a secure, management platform for oil and gas upstream process monitoring and control to support oil and gas installations with various artificial lift methods such as plunger lift, gas lift, gas-assisted plunger lift, rod-beam and electronic submersible pump (ESP). Intel’s primary objective in this market is to move the upstream oil and gas vendors, service providers, and end-users to adopt Intel-based hardware hosting a rich range of open-architecture software-defined platforms. Solution is targeted to address multiple pain areas that the O&G industry is facing in day-to-day operations. These pain areas are further restricting the O&G industry to benefit from technology advancements resulting from cloud-based services and applications for business intelligence (BI), analytics, dashboards, and so on. There is a need to provide a uniform mechanism to connect, monitor and control various devices in an O&G well site adhering to real-time nature of the industry. While the Universal Wellpad Controller software solution described in this User Guide contains a data model specific to a Gas Wellpad, the software is flexible and can be configured for use with other soft-RT process control sites and operating assets.
1.1 Purpose
This document provides information on how to install the Universal Wellpad Controller software framework and configure the device models, data model and data flows for data collection from field devices and reporting such as to Supervisory Control and Data Acquisition (SCADA) at remote process control sites such as an oil or natural gas well (wellpad). The document will help the developer to evaluate the performance of the data collection processes using an applet called the ‘KPI Application’. The document will also help the developer to set up the security and manageability services.
1.2 Scope
This document aims to provide steps to build, deploy, and check if the gateway is up and running all containers. This document also provides steps to set Universal Wellpad Controller containers for communication with Modbus devices.
1.3 System Requirements
The requirements for Universal Wellpad Controller reference middleware are:
Intel® processor family
4 GB system memory
25 GB hard disk space
Ubuntu 20.04 server operating system with RT Patch (Instructions for patching the Ubuntu OS are provided)
Docker version 20.10.6 or above
Docker Compose version 1.29.0 or above
When enabling the Data Persistence recipe (with InfluxDB* and Telegraf*), if data access queries are intensive or desired database size is large, it is recommended to use higher performance and capacity components for CPU, memory, and storage:
Four or more physical or virtual cores
Intel® Core™ processor family
8 GB memory
64 GB hard disk space
Ubuntu 20.04 server operating system with RT Patch (Instructions for patching the Ubuntu OS are provided)
Docker version 20.10.6 or above
Docker Compose version 1.29.0 or above
2.0 Release Notes
Feature list- supported in Universal Wellpad Controller -v4.0
Universal Wellpad Controller codebase is unified and released with Edge Insights for Industrial - v4.0 release.
Universal Wellpad Controller codebase is henceforth released under Intel Proprietary license only.
Universal Wellpad Controller codebase is available for download only from ESH and not from https://github.com/open-edge-insights/uwc.
Universal Wellpad Controller docker images are available for download only from ESH and not from hub.docker.com.
Integrated with “DataStore” micorservice (earlier known as InfluxDB Connector).
Implemented monitoring of change in configuration using ETCDUI for Sparkplug-Beidge, SamplePublisher and SampleSubscriber.
Added a configurable support for reading configuration from module-specific config.json file in DEV mode instead of ETCD.
Added “–configETCD” option to 02_provision_build_UWC.sh script for DEV mode deployment
Feature list- supported in Universal Wellpad Controller -v2.0
All Universal Wellpad Controller microservices and features ported to new design following the “new EMB (Edge Insights Message bus) topic format”.
The backward compatibility with older MQTT topic format is maintained.
Sparkplug-Bridge which historically was compatible with only MQTT-broker (bus) has now been ported to work with EMB (Edge Insights Message bus).
Multi stage build support enabled for all Universal Wellpad Controller services. Hence, reducing the build time & image sizes of all Universal Wellpad Controller service docker images.
Universal Wellpad Controller docker images pushed to remote docker hub (hub.docker.com). Hence, giving an option for developers to either pull pre-built images directly from docker hub or locally build the container images.
Added a use case to have SamplePublisher & SampleSubscriber which can publish and subscribe directly on EMB (Edge Insights Message bus).
Included a use case to have all Universal Wellpad Controller microservices run together.
Repo manifest based cloning enabled instead of git clone method.
Updated instructions related to execution of 05_applyConfigChanges.sh script.
Universal Wellpad Controller codebase rebased on top of latest validated tag of Open Edge Insights for Industrial - v3.0 release. Follow the repo commands as below:
• repo init -u https://github.com/open-edge-insights/eii-manifests.git -b refs/tags/v2.0
• repo init -m uwc.xml
• repo sync
Feature list- supported in Universal Wellpad Controller-v1.5.1 (Hotfix Release)
Universal Wellpad Controller v1.5 rebased & migrated to EII v2.5.2.
Feature list- supported in Universal Wellpad Controller-v1.6.1 (Hotfix Release)
Universal Wellpad Controller migrated to EII v2.6.1
Fixed issue of high number of recursive queries hiting DNS server
Fixed issue related with ESH installer not displaying some prints in Sparkplug use cases
Minor user guide & ReadMe updates
Feature list- supported in Universal Wellpad Controller-v1.6
- Enabled Data Persistence feature in Universal Wellpad Controller
Integrated InfluxDBConnector & Telegraf services of EII’s TICK stack timeseries services with Universal Wellpad Controller.
Data persistence enabled for all 6 operations - ROD (Read on demand), WOD (Write on demand) & Polling in the combinations of both Realtime & non-realtime operations.
Data Retention policy enabled giving flexibility to users to customize the data retention period in InfluxDB.
Universal Wellpad Controller migrated to EII 2.6
Network mode host removed from Universal Wellpad Controller micro-services and services use docker network.
Sample database publisher application use case provided which serves as a reference
Enabled Universal Wellpad Controller on Ubuntu 20.04-LTS Operating system
Note
Build time will increase due to addition of two more components needed for data persistence depending on system configurations.
Feature list- supported in Universal Wellpad Controller-v1.5
Eclipse foundation Sparkplug standard Template feature support * User Defined Template (UDT) definition and instance * Publish –Subscribe interface for third party App for publishing UTD and instances
Seamless edge to cloud connectivity with AWS IoT site wise * UDT publishing * Realtime Tags update
Realtime connection/disconnect update
Data Conversion and transformation
Data ingested by Modbus services is converted to data type defined in the configuration
Data ingested by Modbus services is transformed based on the scale factor defined in the configurations
Universal Wellpad Controller migrated to EII 2.5
Universal Wellpad Controller open source with MIT license on GitHub
Feature list supported in Universal Wellpad Controller-v1.0
Harden Modbus TCP protocol stack and application supporting soft real-time control
Harden Modbus RTU protocol stack and application supporting soft real-time control
User defined System model configuration in YAML format
MQTT Publish-Subscribe interface for process control APP development
Internal EII Data bus with IPC mode
Eclipse Foundation Sparkplug specification compliant SCADA RTU
Sample KPI testing for control loop benchmarking
Device Management with OTA (Over-The-Air) firmware, OS and Docker container update
2.1 Changes to Existing Features in latest release
In 02_provision_build_UWC.sh script, option “–preBuild” is changed to “–preBuilt”.
2.2 Unsupported or Discontinued Features in latest release
Universal Wellpad Controller is not released on https://github.com/open-edge-insights/uwc and under MIT license.
Universal Wellpad Controller images are not available on public docker hub hub.docker.com.
3.0 Before Installation
This section explains various concepts used throughout this document.
3.1 Universal Wellpad Controller for Oil and Gas Site
The Universal Wellpad Controller is a reference design that provides a secure management platform for oil and gas upstream process monitoring and control to support oil and gas installations with various artificial lift methods such as plunger lift, gas lift, and so on. Universal Wellpad Controller is a profile on the Edge Insights for Industrial base platform. Universal Wellpad Controller provides the following:
Soft-real time deterministic control (millisecond level control) in the containerized environment
Configurable user-defined data model describing oil well site
Modularized microservices-based extensible open architecture
Well defined message flow and payload to interact with the vendor application
Policy-based execution of Soft-RT applications
Supports multiple well pads and devices configurations
Polls and controls multiple devices simultaneously
Data Publish Subscribe ZeroMQ and MQTT (Message Queuing Telemetry Transport)
Device Management – System Telemetry, over-the-network also known as over-the-air (OTA), Firmware Update Over the Air (FOTA), Software Over the Air (SOTA), and Application Over the Air (AOTA)
Scalable-down to power-sensitive remote applications
Scalable-up to edge analytics and vision through the Edge Insights for Industrial base
3.2 Upstream Oil and Gas Facilities
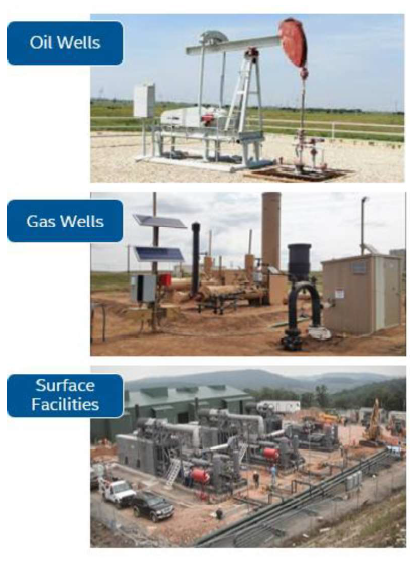
The example provided for Universal Wellpad Controller in this Guide is for a natural gas wellhead with one or more wells. The wellhead will have several field devices often using the Modbus protocols (both TCP and RTU). A Modbus device will have several points to be read and/or written. The table below shows how wellhead, devices, and points are related to each other.
Wellhead |
Device |
Point |
|---|---|---|
Wellhead1 |
flowmeter1 |
keepAlive |
Wellhead1 |
flowmeter1 |
flow |
Wellhead1 |
iou |
AValve |
Wellhead2 |
flowmeter2 |
KeepAlive |
Wellhead3 |
iou |
BValve |
There could be similar devices and similar points in different wellheads. Hence, Universal Wellpad Controller uses this hierarchy to uniquely name a point. A point is identified like “/device/wellhead/point” for example, flowmeter1/Wellhead1/KeepAlive Universal Wellpad Controller defines a data model which can be used to describe the hierarchy of wellhead, device and points.
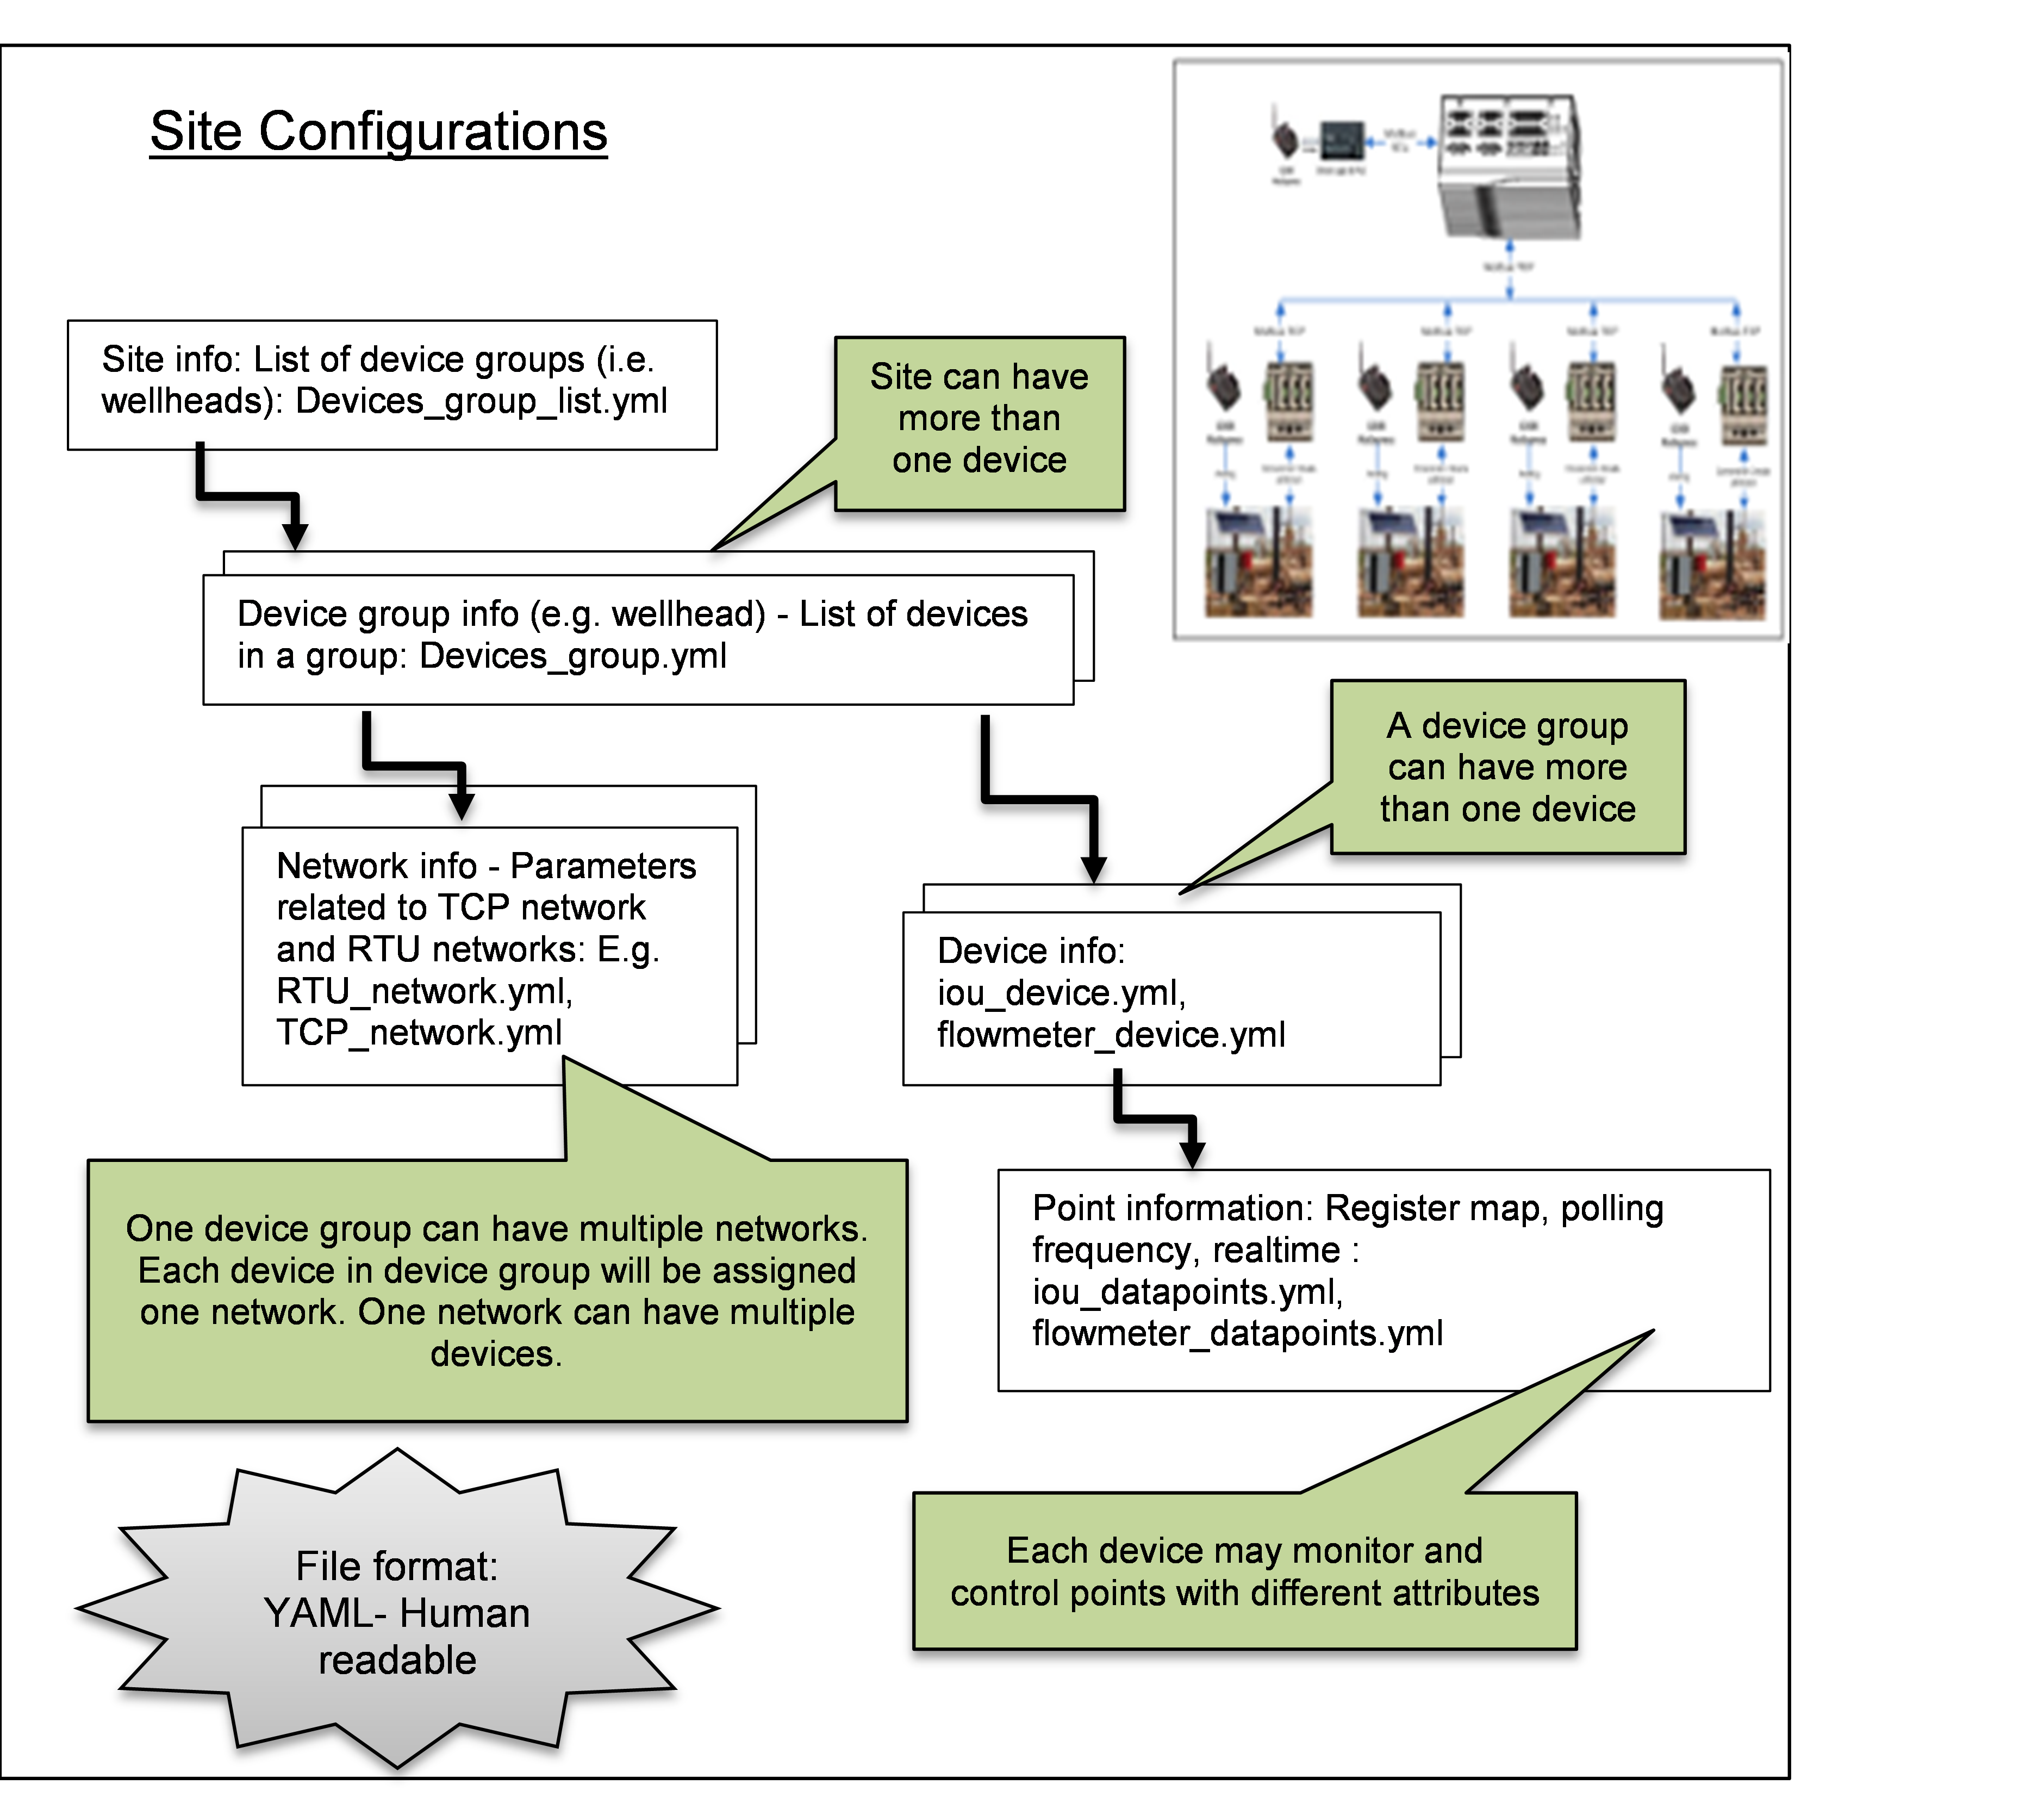
Figure 3.2. Site configurations
3.3 Understanding Universal Wellpad Controller Platform
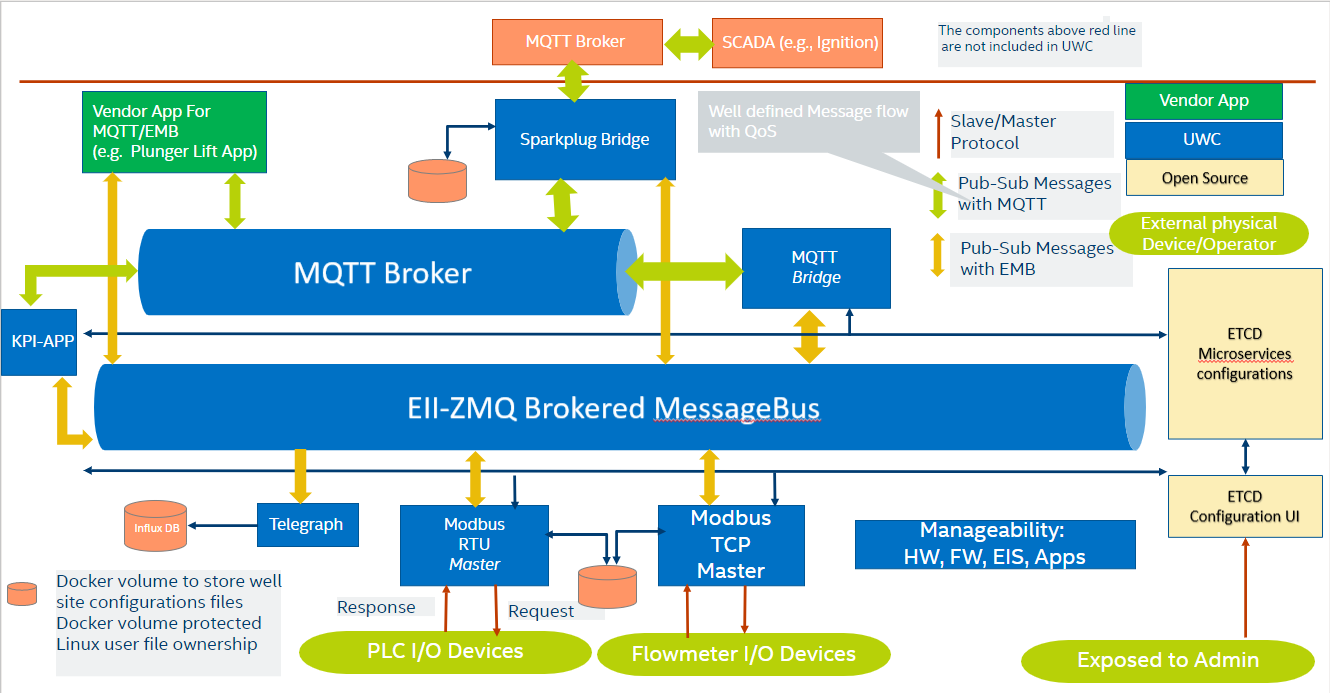
Figure 3.3. High-level block diagram of Universal Wellpad Controller
The application can subscribe to MQTT topics to receive polled data. Similarly, the application can publish data to be written on MQTT. The platform will accordingly publish or subscribe to respective topics. The MQTT topics to be used can be configured. Internally, Universal Wellpad Controller platform uses a message bus (called ZMQ) for which the topics need to be configured. ZMQ is not shown above for ease of understanding.
3.3.1 Modbus containers
Universal Wellpad Controller supports Modbus TCP master and Modbus RTU master for communicating with Modbus slave devices present in a field. These are developed as two separate containers i.e., Modbus TCP container and Modbus RTU container. Please refer to the diagram in section 2.3.
1. Modbus RTU master container
Modbus RTU devices can be connected using RS485 or RS232. Normally, with RS232, only one device is connected at one time. Hence, to communicate with two Modbus RTU devices over RS232, two different serial ports will be needed.
Modbus RTU protocol with RS485 physical transport uses a twisted pair of wires in a daisy-chain shared media for all devices on a chain. The communications parameters of all devices on a chain should be the same. If different devices have different configurations for example, different parity, different baud rate, and so on, then, different Modbus RTU chains can be formed. To communicate with two different Modbus RTU networks, two different serial ports will be needed. It is important to verify the analog signal integrity of the RS-485 chains including the use of termination resistors as per well-known RS-485 best practices. In Universal Wellpad Controller, one Modbus RTU master can be configured to communicate over multiple serial ports. Hence a single Modbus RTU master container handles communication with multiple Modbus RTU networks. The configuration for one Modbus RTU network for example, port, baud rate, and so on can be configured in an RTU network configuration file. The information about this is available in a later section of this document.
3.3.2 MQTT-Bridge container
Modbus containers communicate over ZMQ. The MQTT-Bridge module enables communication with Modbus containers using MQTT. The MQTT- Bridge module reads data on ZMQ received from Modbus containers and publishes that data on MQTT. Similarly, the MQTT- Bridge module reads data from MQTT and publishes it on ZMQ. This module was earlier known as MQTT-Export.
3.3.3 Sparkplug-Bridge container
Universal Wellpad Controller supports Eclipse Foundation’s SparkPlug* standard to expose data to Supervisory Control And Data Acquisition (SCADA) Master over MQTT. Sparkplug-Bridge implements the standard and enables communication with SCADA Master. This module was earlier known as SCADA-RTU. This module exposes the data on the platform to an external, centralized, Master system for the SCADA:
Data from base Universal Wellpad Controller platform i.e., real devices
Mechanism to expose data from Apps running on Universal Wellpad Controller i.e., virtual devices
1. SparkPlug MQTT Topic Namespace
- The following is the topic format
spBv1.0/group_id/message_type/edge_node_id/[device_id]
- Is TLS required for sparkplug-bridge (yes/no):
no
- Enter the external broker address/hostname:
192.164.1.2
- Enter the external broker port number:
11883
- Enter the QOS for scada (between 0 to 2):
2
The group_id element of the Sparkplug* Topic Namespace provides for a logical grouping of MQTT EoN nodes into the MQTT Server and back out to the consuming MQTT Clients. The value should be descriptive but as small as possible.
The value of the group_id can be valid UTF-8 alphanumeric string. The string shall not use the reserved characters of ‘+’ (plus), ‘/’ (forward slash), and ‘#’ (number sign).
The value of this field can be configured in a configuration file, link
message_type:
The message_type elements are defined for the Sparkplug* Topic Namespace. The values could be:
NBIRTH – Birth certificate for MQTT EoN nodes.
NDEATH – Death certificate for MQTT EoN nodes.
DBIRTH – Birth certificate for Devices.
DDEATH – Death certificate for Devices.
NDATA – Node data message.
DDATA – Device data message.
NCMD – Node command message.
DCMD – Device command message.
STATE – Critical application state message.
edge_node_id:
The edge_node_id element of the Sparkplug* Topic Namespace uniquely identifies the MQTT EoN node within the infrastructure. The group_id combined with the edge_node_id element must be unique from any other group_id/edge_node_id assigned in the MQTT infrastructure. The topic element edge_node_id travels with every message published and should be as short as possible.
The value of the edge_node_id can be valid UTF-8 alphanumeric string. The string shall not use the reserved characters of ‘+’ (plus), ‘/’ (forward slash), and ‘#’ (number sign).
The value of this field can be configured in a configuration file, link
device_id:
The device_id element of the Sparkplug* Topic Namespace identifies a device attached (physically or logically) to the MQTT EoN node. The device_id must be unique from other devices connected to the same EoN node. The device_id element travels with every message published and should be as short as possible.
The format of the device_id is a valid UTF-8 alphanumeric String. The string shall not use the reserved characters of ‘+’ (plus), ‘/’ (forward slash), and ‘#’ (number sign).
2. Supported message types
The following message types are supported in the current version of Universal Wellpad Controller:
Message Type |
Support for real devices |
Support for virtual devices (Apps) |
|---|---|---|
NBIRTH |
Supported. This is an edge level message. |
Supported. This is an edge level message. |
NDEATH |
Supported. This is an edge level message. |
Supported. This is an edge level message. |
DBIRTH |
Supported. Data is taken from YML file. |
Supported. Vendor app should publish data on “BIRTH” topic. |
DDATA |
Supported. Data from Poll-update messages is taken to determine change in data for publishing a DDATA message |
Supported using RBE (Report by Exception). Vendor app should publish data on “DATA” topic. |
DCMD |
Supported. A corresponding On-Demand-Write request message is published on internal MQTT for other Universal Wellpad Controller containers to process a request |
Supported. A corresponding CMD message is published on internal MQTT for vendor app. |
DDEATH |
Supported. Data from Poll-update messages is taken to determine change in data for publishing a DDEATH message in case of error scenarios |
Supported. Vendor app should publish data on “DEATH” topic. |
NDATA |
Not Supported |
Not Supported |
NCMD |
Supported “Node Control/Rebirth” control |
Supported “Node Control/Rebirth” control |
STATE |
Not Supported |
Not Supported |
3. Name of edge node
User should properly configure “group_id” and “edge_node_id” for each edge gateway deployed in a site such that each edge node can be uniquely identified.
3.3.4 KPI Application Container
One sample application called “KPI Application” is provided to depict how one can develop an application on the Universal Wellpad Controller platform. This is a simple application that demonstrates how a “single input, single output” control loop can be implemented.
A control loop is executed continuously to monitor certain parameter and adjust other parameters. Thus, a control loop consists of one read operation and one write operation. In this sample application, polling mechanism of the Universal Wellpad Controller platform is used to receive values of parameters as per polling interval. The application uses “on-demand-write” operation on receiving data from polling.
This KPI Application can either be executed based on MQTT communication or based on ZMQ communication. Refer to the configurations for more details.
The KPI Application also logs all data received as a part of the control loop application in a log file. This data can be used for measuring the performance of the system.
3.3.5 Configurations
- Universal Wellpad Controller needs the following configuration to function properly:
Information about device group list which is wellhead, device, and points falling under respective Modbus container
Information about topics for internal message queue, publishers, and subscribers
All these configurations are related and depend on the hierarchy of wellhead, device, and point. The following sections detail the Universal Wellpad Controller installation and configuration process.
4.0 Installation Guide
4.1 How to install Universal Wellpad Controller with Edge Insights for Industrial installer
This section provides steps to install and deploy Universal Wellpad Controller containers using the Edge Insights for Industrial installer.
Prerequisite: As a prerequisite to install the Universal Wellpad Controller, you need an internet connection with correct proxy settings.
Optional: For enabling full security for production deployments, ensure to configure host machine and docker daemon with the following security recommendations. ../build/docker_security_recommendation.md
Steps:
1. Install Ubuntu 20.04 server version on gateway and then, apply the RT Patch. For more information, see section 14.
2. Refer ESH documentation for downloading source code and docker images. The downloaded source code package contains the READMEs for more details.
3. Navigate to the build folder from the following path <working_dir>/IEdgeInsights/build.
4. Based on the proxy settings, run any of the following commands:
For a proxy enabled network, run ./pre_requisites.sh –proxy=<proxy address with port number>
For a non-proxy network, run sudo ./pre_requisites.sh
Note
Rerun the pre_requisite.sh script, if the “Docker CE installation step is failed” error occurs while running the pre-requisite.sh script on a fresh system. This is a known bug in the docker community for Docker CE.
5. Navigate to <working_dir>/IEdgeInsights/uwc/build_scripts.
6. Run the following command:
sudo -E ./01_uwc_pre_requisites.sh
7. Run the following command:
sudo -E ./02_provision_build_UWC.sh
- 8. Select one of the following options based on Dev mode or Prod mode.
Dev
Prod
Note
For “Dev” mode, select source of configuration - whether to read data from ETCD. - yes - no Please select “Yes”, to read configuration from ETCD. Else, select “No”, to read configuration from module-specific local config.json file.
9. Based on the use case (combination of Universal Wellpad Controller services), select one of the following options:
Basic UWC micro-services without KPI-tactic Application & Sparkplug-Bridge - (Modbus-master TCP & RTU, MQTT-Bridge, internal MQTT broker, ETCD server, ETCD UI & other base Edge Insights for Industrial & Universal Wellpad Controller services)
Basic UWC micro-services as in option 1 along with KPI-tactic Application (Without Sparkplug-Bridge)
Basic UWC micro-services & KPI-tactic Application along with Sparkplug-Bridge, SamplePublisher and SampleSubscriber
Basic UWC micro-services with Sparkplug-Bridge, SamplePublisher and SampleSubscriber and no KPI-tactic Application
Basic UWC micro-services with Time series micro-services (Telegraf & DataStore)
Running Basic UWC micro-services with time series services (Telegraf & DataStore) along with KPI-tactic app
Running Basic UWC micro-services with time series services (Telegraf & DataStore) along with Sparkplug service, SamplePublisher and SampleSubscriber
Running the Sample DB publisher with Telegraf, DataStore, ZmqBroker & Etcd container
Basic UWC micro-services with SamplePublisher and SampleSubscriber
All modules: Basic UWC modules, KPI-tactic Application, Sparkplug-Bridge, Telegraf, DataStore, ZmqBroker, Etcd container, SamplePublisher, and SampleSubscriber
- 10. Do you want to use pre-built images ?
Yes
No
Please select “Yes”, if user wants to use the images downloaded locally from ESH.
Else, select “No” if the images are to be built locally.
For the Sparkplug-Bridge-related configuration, refer to the following sample output:
11. Enter the following parameters required for Sparkplug-Bridge container.
- Is TLS required for sparkplug-bridge (yes/no):
yes
- Enter the CA certificate full path including file name (e.g. <Work_Dir>/IEdgeInsights/build/Certificates/rootca/cacert.pem):
<Work_Dir>/root-ca.pem
- Enter the client certificate full path including file name (e.g. <Work_Dir>/IEdgeInsights/build/Certificates/mymqttcerts/mymqttcerts_client_certificate.pem ):
<Work_Dir>/client_crt.pem
- Enter the client key certificate full path including file name (e.g. <Work_Dir>/IEdgeInsights/build/Certificates/mymqttcerts/mymqttcerts_client_key.pem ):
<Work_Dir>/client_key.pem
- Enter the external broker address/hostname (e.g. 192.168.0.5 or dummyhost.com):
192.168.1.11 (This is the IP address of the system, where we have Ignition Software running)
- Enter the external broker port number:
22883 (This is the port no: on which the IP/system with Ignition Software running wants to connect to external MQTT broker).
- Enter the QOS for scada (between 0 to 2):
1
• Enter the following parameters required for sparkplug-bridge container
- Is TLS required for sparkplug-bridge (yes/no):
no
- Enter the external broker address/hostname (e.g. 192.168.0.5 or dummyhost.com):
192.168.1.11
- Enter the external broker port number:
22883
- Enter the QOS for scada (between 0 to 2):
1
12. Run the following command:
sudo -E ./03_Run_UWC.sh
Note
The aforementioned steps are the process for interactive mode. For a non-interactive mode support, refer to the following steps
13. To support non-interactive mode, the following options are added in the 2nd script (02_provision_build_UWC.sh).
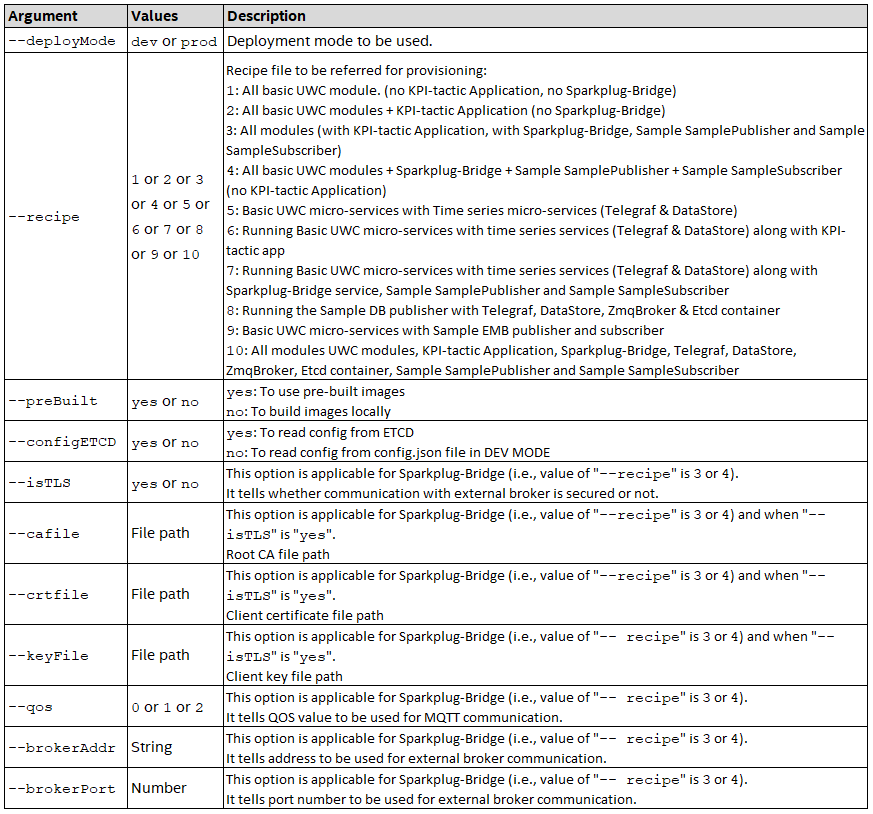
If the required parameters are not available, then in the interactive mode, you need to provide the details for the required parameters.
14. Following are sample commands for the non-interactive mode execution.
For all the Universal Wellpad Controller basic modules (no KPI, no Sparkplug-Bridge) in DEV mode and reading configuration data from ETCD, run the following command:
sudo -E ./02_provision_build_UWC.sh --deployMode=dev --recipe=1 --configETCD=yes
* For all the Universal Wellpad Controller modules (with KPI and with Sparkplug-Bridge) in DEV mode and reading configuration data from ETCD, run the following command:.
sudo -E ./02_provision_build_UWC.sh --deployMode=dev --recipe=3 --configETCD=yes --isTLS=yes --caFile="scada_ext_certs/ca/root-ca.crt" --crtFile="scada_ext_certs/client/client.crt" --keyFile="scada_ext_certs/client/client.key" --brokerAddr="192.168.1.11" --brokerPort=22883 --qos=1
Build scripts descriptions
01_uwc_pre_requisites.sh - This script creates docker volume directory /opt/intel/eii/uwc_data, creates “/opt/intel/eii/container_logs/” for storing log, etc.
- 02_provision_build_UWC.sh - This script runs the builder to generate the consolidated docker-compose.yml. This script performs provisioning per the docker-compose.yml file. Along with this, it generates certs for the MQTT and builds all the microservices of the docker-compose.yml.
It allows you to choose combination of Universal Wellpad Controller services, deployment mode either dev or prod mode, or select whether to use the pre-build images or build images locally.
03_Run_UWC.sh - This script deploys all Universal Wellpad Controller containers.
04_uninstall_UWC.sh – Used for cleanup and uninstalling docker, docker-compose, and installed libraries. This script will bring down all containers and remove all running containers.
05_applyConfigChanges.sh - This script will stop and start all running containers with updated changes.
06_UnitTestRun.sh - This script will generate unit test report and code coverage report.
Rerun the “./02_provision_build_UWC.sh” script to change the use case that is running. This will remove or kill all the containers of the existing use case and recreate the consolidated docker-compose.yml and consolidated eii_config.json file per the new use case selected in the “./02_provision_build_UWC.sh” script. Provisioning and build is also done as part of this script. Run the “03_Run_UWC.sh” script after running the “02_provision_build_UWC.sh” script. This will bring up all the containers of the new use case.
5.0 Deactivate Operating System Updates
5.1 Deactivate Auto Update
Once all the containers are deployed successfully, disable system’s auto update feature as specified in the below sections. Auto update feature is enabled by default in Ubuntu.
These steps are optional. It is needed to switch off auto updates of packages (Package-Lists, periodic etc) when connected to internet.
5.1.1 Deactivate Unattended Upgrades
To deactivate unattended upgrades, we need to edit
/etc/apt/apt.conf.d/20auto-upgrades file and do the following changes.
Disable update package list by changing setting
from APT::Periodic::Update-Package-Lists “1”
to APT::Periodic::Update-Package-Lists “0”
Disable unattended upgrade by changing setting
from APT::Periodic::Unattended-Upgrade “1”
to APT::Periodic::Unattended-Upgrade “0”
5.1.2 Deactivate Periodic Unattended Upgrades
To deactivate periodic unattended upgrades edit the /etc/apt/apt.conf.d/10periodic file and do the following changes:
Disable update package list by changing setting
from APT::Periodic::Update-Package-Lists “1”
to APT::Periodic::Update-Package-Lists “0”
Disable download upgradable packages by changing setting
from APT::Periodic::Download-Upgradeable-Packages “1”
to APT::Periodic::Download-Upgradeable-Packages “0”
Disable auto clean interval by changing setting
from APT::Periodic::AutocleanInterval “1”
to APT::Periodic::AutocleanInterval “0”
5.1.3 Deactivate Scheduled Upgrades
To deactivate scheduled download run the following commands:
sudo systemctl stop apt-daily.timer
sudo systemctl disable apt-daily.timer
sudo systemctl disable apt-daily.service
sudo systemctl daemon-reload
6.0 Container Configuration Settings
This section provides details about configuring the Universal Wellpad Controller containers.
6.1 Containers
- Universal Wellpad Controller consists of the following containers:
Modbus TCP Master
Modbus RTU Master
MQTT-Bridge
MQTT
Sparkplug-Bridge
Vendor Apps (SamplePublisher and SampleSubscriber)
KPI Application
The containers are configured using the docker-compose.yml. The docker-compose.yml is auto-generated based on inputs provided while executing script 02_provision_build_UWC.sh.
For more details, refer to the EII Readme <IEdgeInsights/README.md>.
Universal Wellpad Controller containers Modbus Clients and MQTT-Bridge use ZeroMQ to communicate with each other.
In the current version of Universal Wellpad Controller it is recommended to have only one Modbus-TCP and one Modbus-RTU container. Hence, changes to configuration present in the docker-compose.yml file is not required.
6.1.1 Common Configuration for Modbus Client Containers
Following are configurations, applicable for Modbus Client (TCP and RTU both) containers:
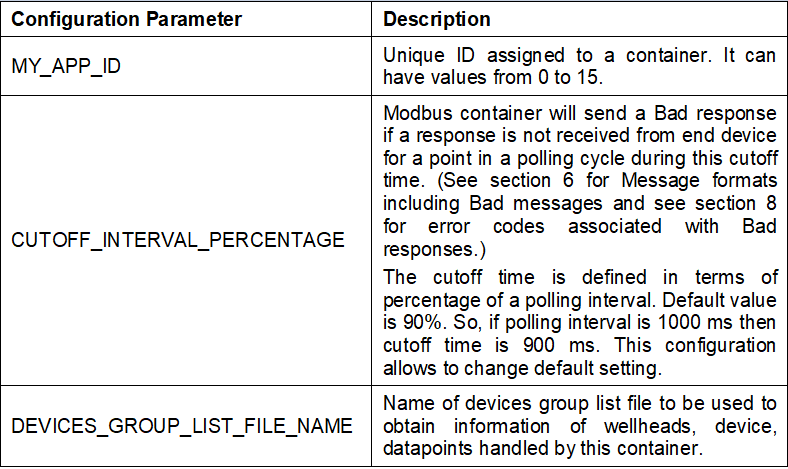
- Example for Modbus-TCP-Master container from docker-compose.yml file:
AppName: “TCP”
ETCD_HOST: ${ETCD_HOST}
ETCD_CLIENT_PORT: ${ETCD_CLIENT_PORT}
ETCD_PREFIX: ${ETCD_PREFIX}
DEV_MODE: ${DEV_MODE}
no_proxy: ${eii_no_proxy}
Log4cppPropsFile: “/opt/intel/config/log4cpp.properties”
MY_APP_ID: 1
CUTOFF_INTERVAL_PERCENTAGE: 90
CertType: “zmq”
PROFILING_MODE: ${PROFILING_MODE}
NETWORK_TYPE: TCP
DEVICES_GROUP_LIST_FILE_NAME: “Devices_group_list.yml”
6.1.2 Configuration Modbus network
A separate network configuration YML file is maintained for each network. For example, if there are 2 RTU and 1 TCP networks, then there will be 3 network configuration files. This file contains following configuration for both TCP and RTU:
Note
inter-frame delay and response timeout values are in Millisecond.
interframe_delay: 1
response_timeout: 80
- For Modbus RTU master, the following additional configurations are needed apart from the parameters mentioned earlier:
baudrate: 9600
parity: “N”
com_port_name: “/dev/ttyS0”
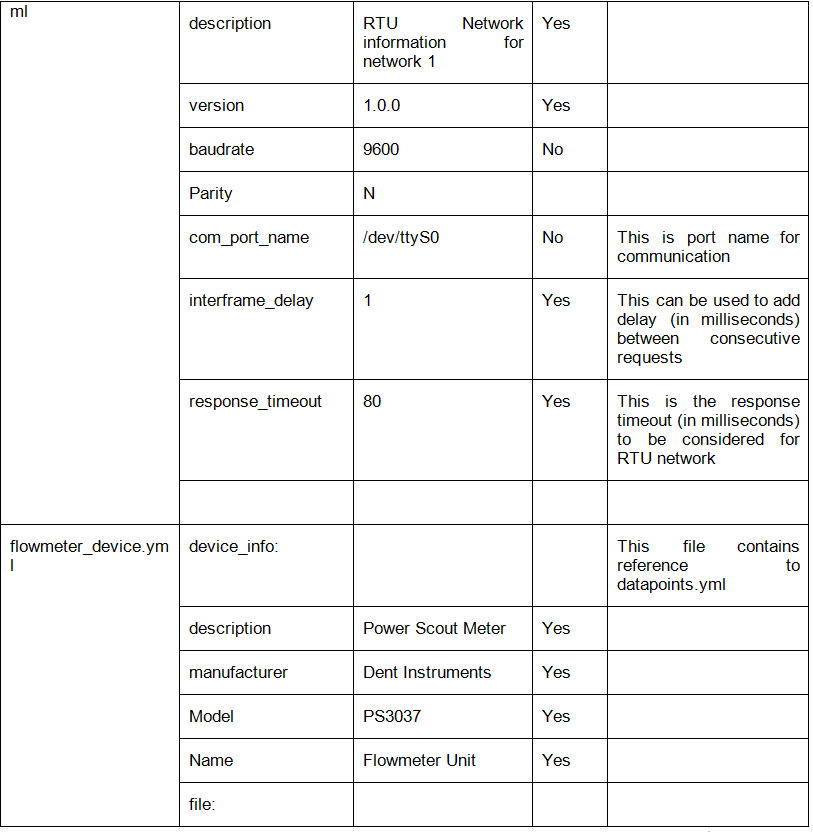
6.2 Modbus TCP Communication
When used in TCP mode, the publisher of a stream will bind to a TCP socket and the subscribers connect to it to receive data. In Request-Response pattern, the responder acts as the server and binds the socket and the requester connects to it.
6.3 Modbus RTU Communication
Modbus RTU is an open serial protocol derived from the Master/Slave architecture. Universal Wellpad Controller Modbus-rtu-container is used as master and slave can be configured.
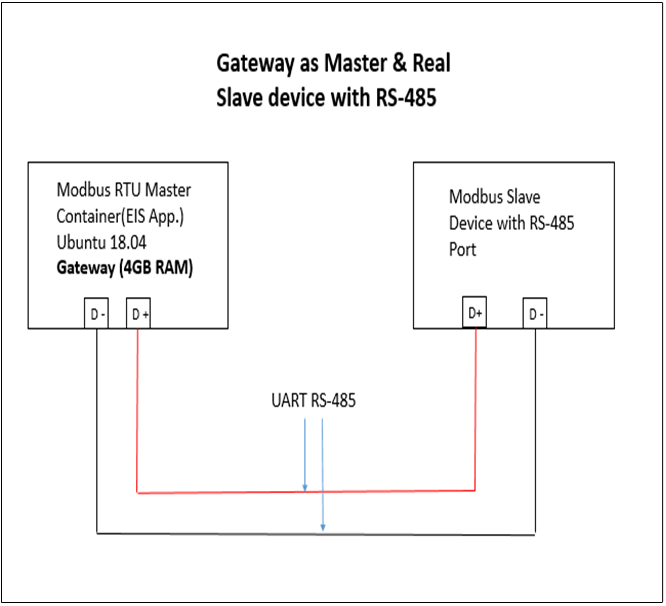
parameters (i.e., baud rate, parity, stop bits) from docker-compose.yml file.
6.4 MQTT Bridge
This container is used to send messages from ZeroMQ to MQTT and vice-versa.
Modbus containers communicate over the internal Edge Insights for Industrial data bus (ZMQ). The MQTT-Bridge module enables communication with Modbus containers using MQTT. The MQTT- Bridge module reads data on ZMQ received from Modbus containers and publishes that data on MQTT. Similarly, the MQTT- Bridge module reads data from MQTT and publishes it on ZMQ.
6.5 MQTT
The MQTT container is a mosquitto broker required for MQTT to publish/subscribe data. MQTT broker use port “11883”.
MQTT clients should use above mentioned port for communication.
6.5.1 Accessing secured MQTT container from an external MQTT client
- Prerequisites:
All Universal Wellpad Controller containers must be deployed-on gateway with DEV_MODE=false (i.e., secured mode).
Steps to follow:
Open a terminal and execute following command to create local directory to keep certificates of MQTT broker, mkdir ~/mqtt_certs && cd ~/mqtt_certs
Copy ca/ and /mymqttcerts directories in local directory i.e., created in script 02_provision_build_UWC.sh from working_dir/IEdgeInsights/build/Certificates/ directory.
Command to copy ca/ and /mymqttcerts/ dir in local dir (i.e., mqtt_certs)
sudo cp -r /<working_dir>/IEdgeInsights/build/Certificates/ca ~/mqtt_certs/
Assign read permission to local certs using following command, sudo chown -R $USER:$USER && sudo chmod +r ca/* mymqttcerts/*
Note: Read permissions are only required for ca/ and /mymqttcerts directories present inside mqtt_certs directory copied in step 2.
Provide right access to certificates directory using below command – sudo chmod +x Certificates in
<working_dir>/IEdgeInsights/build/Certificates
Open MQTT client e.g., MQTT.fx
Open the connection setting and click on SSL/TLS tab.
>> then click on Self Signed certificate option >> select CA file from mqtt_certs/ca directory (file name : ca_certificate.pem) , Client Certificate file from mqtt_certs/mymqttcerts directory (File name : mymqttcerts_client_certificate.pem) and Client key File from mqtt_certs/mymqttcerts directory (File name : mymqttcerts_client_key.pem) copied in step 2
Click on PEM Formatted check box and then save the setting and then connect. Refer below screenshot for more details
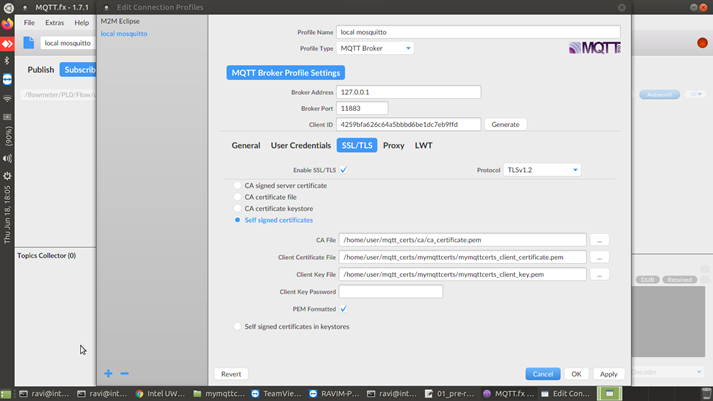
Figure. 4.5.1: Screen capture for mqtt.fx client connection
6.5.2 Accessing secured MQTT container from a client inside a container
Mention following secrets for a new container in docker-compose.yml file.
ca_broker – CA certificate
client_cert – Client certificate
client_key – Client Key
Following sample snippet for docker-compose.yml file
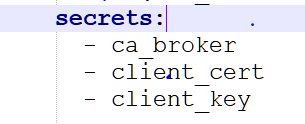
Use certificates mentioned in step 1 inside application to connect with secured MQTT broker which is running as a part of Universal Wellpad Controller.
Following is the sample code snippet in C++ to use certificates in a program,
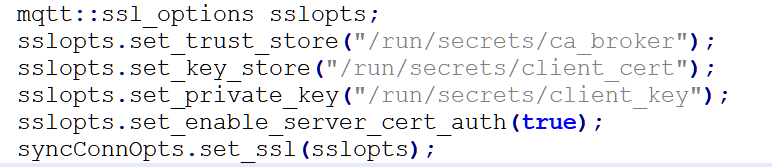
Deploy containers using usual deployment process.
6.6 Sparkplug-Bridge
This container implements Eclipse Foundation’s SparkPlug* standard to expose data to compliant SCADA Master over MQTT.
6.6.1 Prerequisite for running Sparkplug-Bridge
SCADA Master (e.g., Ignition System) shall be installed and configured.
MQTT broker shall be installed and configured in SCADA Master. At present secured connectivity for MQTT is not supported.
Following parameters should be configured for Sparkplug-Bridge in docker-compose.yml file:
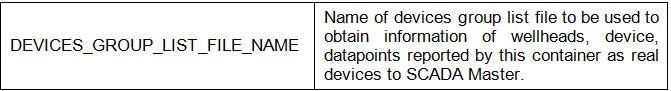
6.7 Vendor Apps
Vendor Apps consist of Sample Publisher and Sample subscriber which are brokered publisher and subscriber for EMB.The EII’s ETCDUI acts as interface for sample publisher for more details on ETCDUI, refer to the `IEdgeInsights/EtcdUI/README.md’.
SparkPlug* can communicate with rest of the Universal Wellpad Controller containers by two ways either:
By MQTT mode (which is sparkplug-bridge -> internal-mqtt-Broker -> mqtt-bridge -> EMB)
By EMB mode (which is sparkplug-bridge -> EMB).
For more details on working of vendor apps ,Please refer Vendor_Apps/README-VA.md
6.8 KPI App
This is a sample application which implements control loops and logs data in a log file named “AnalysisKPIApp.log”. Normally 3 log files are created on rolling basis i.e., once tie set file size limit is exceeded, a new file is created and likewise max 3 files are created. After this, the log files are overwritten.
The log file size can be updated, if required.
File: log4cpp.properties
Path in release package: kpi-tactic/KPIApp/Config
Path after deployment inside container: /opt/intel/config/log4cpp.properties
Log files created are - AnalysisKPIApp.log, AnalysisKpiApp.log1, and AnalysisKpiApp.log2. These files are created in .txt format. Latest data will be available in AnalysisKPIApp.log followed by AnalysisKpiApp.log1, and AnalysisKpiApp.log2
Default log file size is around 34mb.

To change the file size, “log4cpp.properties” needs to be changed. Please change the limit highlighted above. The max file size mentioned here is in bytes. Please identify number of bytes as per file size needed and set the value here.
Please run script 03 Build_Run_UWC.sh after changing “log4cpp.properties”.
6.8.1 Pre-processor flag to be used for enabling/disabling KPI-App on high performance/low performance processor
By default, pre-processor flag UWC_HIGH_PERFORMANCE_PROCESSOR is disabled in Kpi App for debug & release mode.
To enable KPI-App on high performance processor in release mode, go to <Sourcecode> -> kpi-Tactic -> KPIApp -> Release -> src directory and open subdir.mk file. Add the option “-DUWC_HIGH_PERFORMANCE_PROCESSOR” in below line where GCC compiler is invoked.
To enable KPI-App on high performance processor in release mode, go to <Sourcecode> -> kpi-Tactic -> KPIApp -> Debug -> src directory and open subdir.mk file. Add the option “-DUWC_HIGH_PERFORMANCE_PROCESSOR” in below line where GCC compiler is invoked.
To disable the pre-processor flag in the KPI App, remove the option “-DUWC_HIGH_PERFORMANCE_PROCESSOR” added in steps 2 and 3 for both the Release and Debug mode.
High performance processors are Intel® Core™ classes processors and low performance or low power systems are Intel Atom® x processor family.
7.0 Site Configurations
This section provides configurations required to configure the site, wellhead, device, and points for Universal Wellpad Controller containers.
7.1 System Level Global Configuration
This file contains configurations to be used for operations across Universal Wellpad Controller containers for Modbus-TCP, Modbus-RTU, and MQTT-Bridge.
The Global_Config.yml file location is as follows, /opt/intel/eii/uwc_data/common_config
Based on realtime requirement, operations are classified into the following sub-operations:
Polling realtime
Polling non-realtime
On-demand read realtime
On-demand read non-realtime
On-demand write realtime
On-demand write non-realtime
SparkPlug communication for Sparkplug-Bridge
Default scale factor
7.1.1 Settings for Polling and On-Demand Operations
The following is a sample setting for the Polling operation. The settings are similar for the On-demand operations:
- Global:
- Operations:
- Polling:
default_realtime: false
- realtime:
operation_priority: 4
retries: 1
qos: 1
- non-realtime:
operation_priority: 1
retries: 0
qos: 0
The description of each field is as follows:
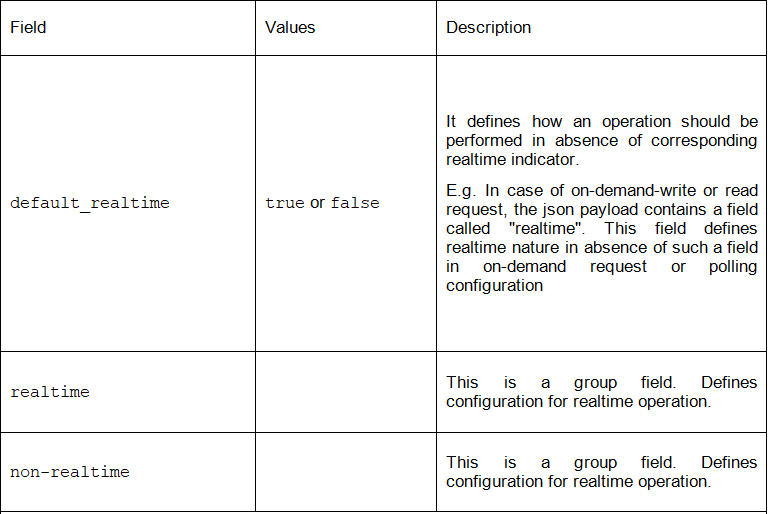
Sub fields for “realtime” and “non-realtime” group are as follow
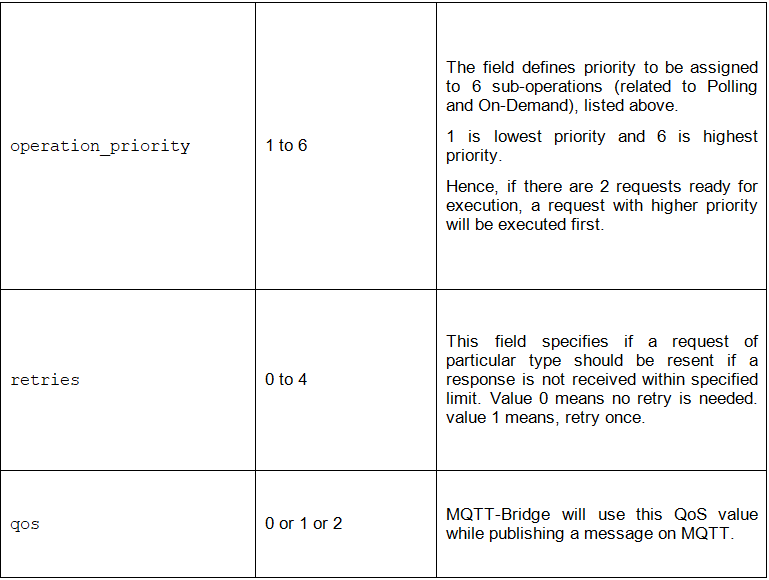
If incorrect value is specified for any of above fields, a default value which is listed below will be used:
default_realtime: false
operation_priority: 1
retries: 0
qos: 0
If configuration parameter or section is missing for any of the sub-operation related to the Polling and On-Demand operations, then default values mentioned above will be used.
7.1.2 Settings for Sparkplug-Bridge – SparkPlug communication operation
The following is a sample setting for Sparkplug-Bridge
- Global:
- Operations:
SparkPlug_Operation:
group_id: “UWC nodes”
edge_node_id: “RBOX510”
The sample also shows the default values for parameters. If a configuration parameter or section is missing for SparkPlug* communication, then default values mentioned in the sample will be used.
The parameters here are used to form SparkPlug formatted topic name.
These values should properly be configured to ensure correct representation of data under SCADA Master.
Following is a description of each field.
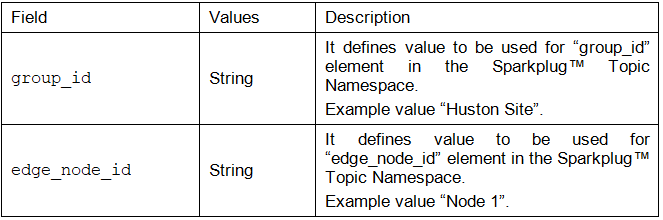
7.1.3 Settings for default scale factor
The sample settings for default scale factor is as follows:
- Global:
Operations: .
.
.
default_scale_factor: 1.0
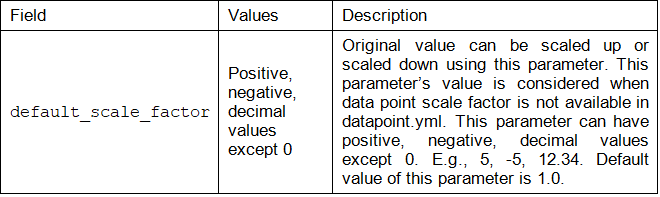
7.2 How to Configure Site and Wellhead
There is one file which lists down reference to device-groups that is wellheads controlled by one Universal Wellpad Controller gateway. Ideally, in one Universal Wellpad Controller gateway there is one TCP and one RTU container. One RTU container can manage communication with multiple RTU networks.
— file:
version: “1.0.0”
author: “Intel”
date: “Sun Sep 1 13:34:13 PDT 2019”
description: “Common device group file for TCP and RTU devices”
devicegrouplist:
- “Device_group1.yml”
- “Device_group2.yml”
Above example shows “Device_group1” and “Device_group2” as a reference to group of devices. “Device_group1.yml” is a separate file listing down all TCP and RTU devices falling under one device-group (e.g. wellhead PL0)
Each device-group file will have information about devices in that group.
— file:
version: “1.0.0”
author: “Intel”
date: “Sun Sep 1 13:34:13 PDT 2019”
description: “Device group 1”
id: “PL0”
description: “Device group 1”
devicelist:
- deviceinfo: “flowmeter_device.yml”
id: “flowmeter”
protocol:
protocol: “PROTOCOL_TCP”
ipaddress: “192.168.0.222”
port: 502
unitid: 1
tcp_master_info: “tcp_master_info.yml”
- deviceinfo: “iou_device.yml”
id: “iou1”
protocol:
protocol: “PROTOCOL_RTU”
slaveid: ‘10’
rtu_master_network_info: “rtu_network1.yml”
Following sections provide details about TCP and RTU device configuration in device-group file.
7.2.1 Configuring TCP device in Device-group
The following is an example for configuring TCP device in a Device-group
devicelist: - deviceinfo: “flowmeter_device.yml”
id: “flowmeter”
protocol:
protocol: “PROTOCOL_TCP”
ipaddress: “192.168.0.222”
port: 502
unitid: 1
tcp_master_info: “tcp_master_info.yml”
The following parameters are needed for each TCP device:
ipaddress – for TCP communication IP address for client device required
port – can be configured as per client device configuration
unitid – id can used to distinguish multiple clients on same IP address
tcp_master_info - tcp_master_info.yml – In this file, interframe delay and response timeout can be configured for TCP network
Sample file for tcp_master_info.yml is as follows:
file:
version: “1.0.0”
author: “Intel”
date: “Sun Sep 1 13:34:13 PDT 2019”
description: “TCP master config parameter file”
Note
The inter-frame delay and response timeout values are in milliseconds
interframe_delay: 1
response_timeout: 80
Note
This reference is unique across TCP devices and needs to be given for each TCP device.
7.2.2 Configuring RTU Device in Device-group
The example for configuring the RTU device in a device-group is as follows:
devicelist:
- deviceinfo: “iou_device.yml”
id: “iou1”
protocol:
protocol: “PROTOCOL_RTU”
slaveid: ‘10’
rtu_master_network_info: “rtu_network1.yml”
The following parameters are required for each RTU device:
slaveid – This is end device id in case of RTU communication
rtu_master_network_info: “rtu_network1.yml” – This file is used to configure RTU configuration for a specific RTU network.
A sample file for rtu_network1.yml is as follows:
— file:
version: “1.0.0”
author: “Intel”
date: “Sun Sep 1 13:34:13 PDT 2019”
description: “RTU Network information for network 1”
baudrate: 9600
parity: “N”
com_port_name: “/dev/ttyS0”
Note
The inter-frame delay and response timeout values are in milliseconds (ms)
interframe_delay: 1
response_timeout: 80
Note
This file needs to be specified for each RTU device. If multiple RTU networks are present (RS485/RS232) then those many files should be created. For each RTU device, an appropriate RTU network reference shall be provided.
7.3 How to Configure Devices
Device contains information of a device. A sample file is as follows:
file:
version: “1.0.0”
author: “Intel”
date: “Sun Sep 1 13:34:13 PDT 2019”
description: “Information for Demo IOUnit”
device_info:
name: “IO Unit”
description: “Power Scout Meter”
manufacturer: “Dent Instruments”
model: “PS3037”
pointlist: “iou_datapoints.yml”
7.4 How to Configure Device points
A device point contains the end point information. A sample file is shown as follows. The following parameters can be changed in this file –
addr - can be of range 0 to 65534
pollinterval – value in milliseconds
type – Function Code
width – Number of bytes to be read
realtime – To be used for real time, as of date it is false.
Datatype – Represents data type of the data point.
dataPersist-Represents if data to be persisted into DB.
Scalefactor – Represents scale factor to be used for the data point.
file:
version: “1.0.0”
author: “Intel”
date: “Sun Sep 1 13:34:13 PDT 2019”
description: “Data for Demo IOUnit data points”
datapoints:
- id: “Arrival”
attributes:
type: “DISCRETE_INPUT”
addr: 2048
width: 1
datatype: “boolean”
dataPersist: true
scalefactor: 1
polling:
pollinterval: 250
realtime: true
- id: “AValve”
attributes:
type: “HOLDING_REGISTER”
addr: 640
width: 2
datatype: “INT”
dataPersist: true
scalefactor: 1
polling:
pollinterval: 1000
realtime: true
- id: “DValve”
attributes:
type: “COIL”
addr: 2048
width: 1
datatype: “boolean”
scalefactor: 1
polling:
pollinterval: 1000
realtime: true
- id: “TubingPressure”
attributes:
type: “INPUT_REGISTER”
addr: 1030
width: 2
datatype: “float”
scalefactor: -1.0
polling:
pollinterval: 250
realtime: true
- id: “CasingPressure”
attributes:
type: “INPUT_REGISTER”
addr: 1024
width: 4
datatype: “double”
scalefactor: 1.0
polling:
pollinterval: 250
realtime: true
- id: “KeepAlive”
attributes:
type: “COIL”
addr: 3073
width: 1
polling:
pollinterval: 2000
realtime: true
Note
For coil type width should be 1.
YML file Configuration table
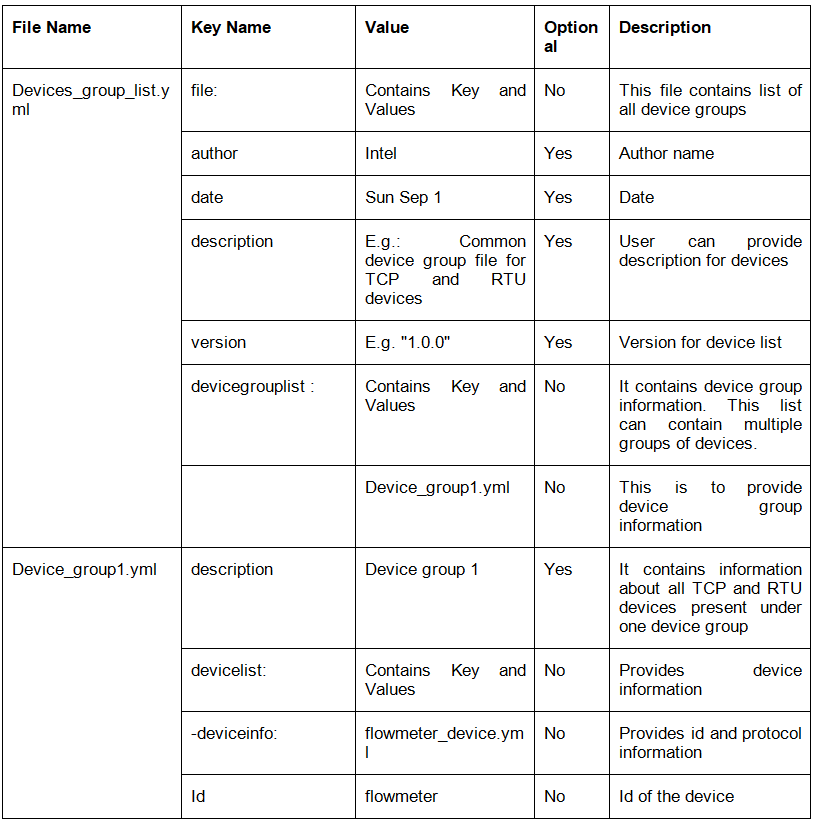
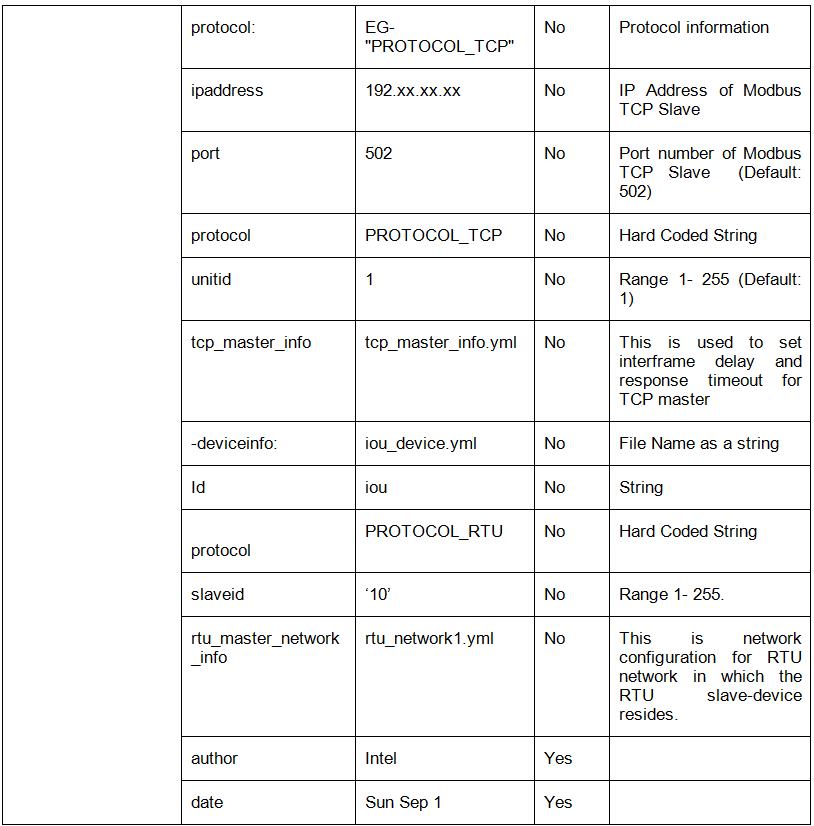
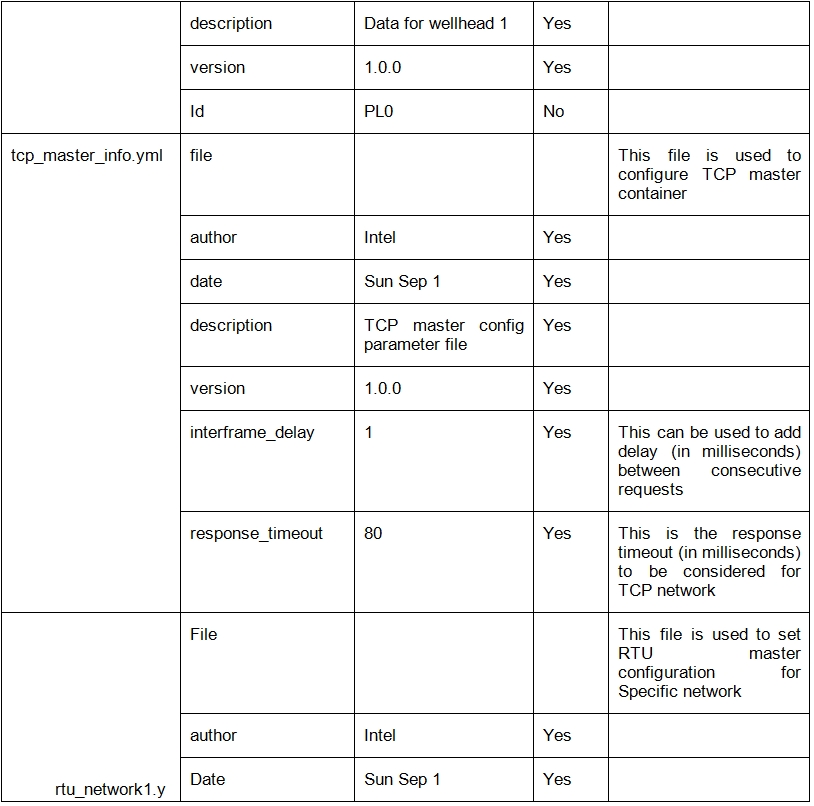
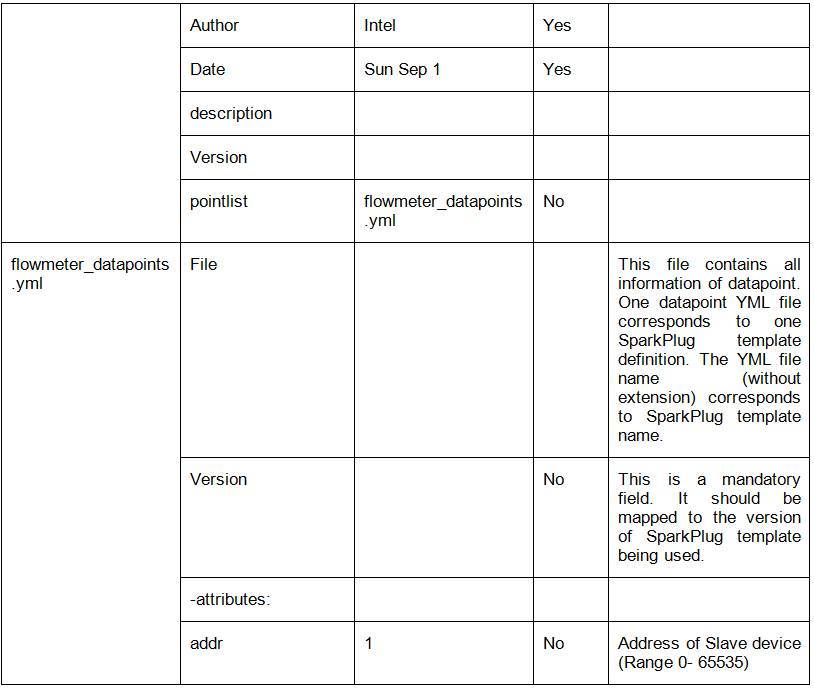
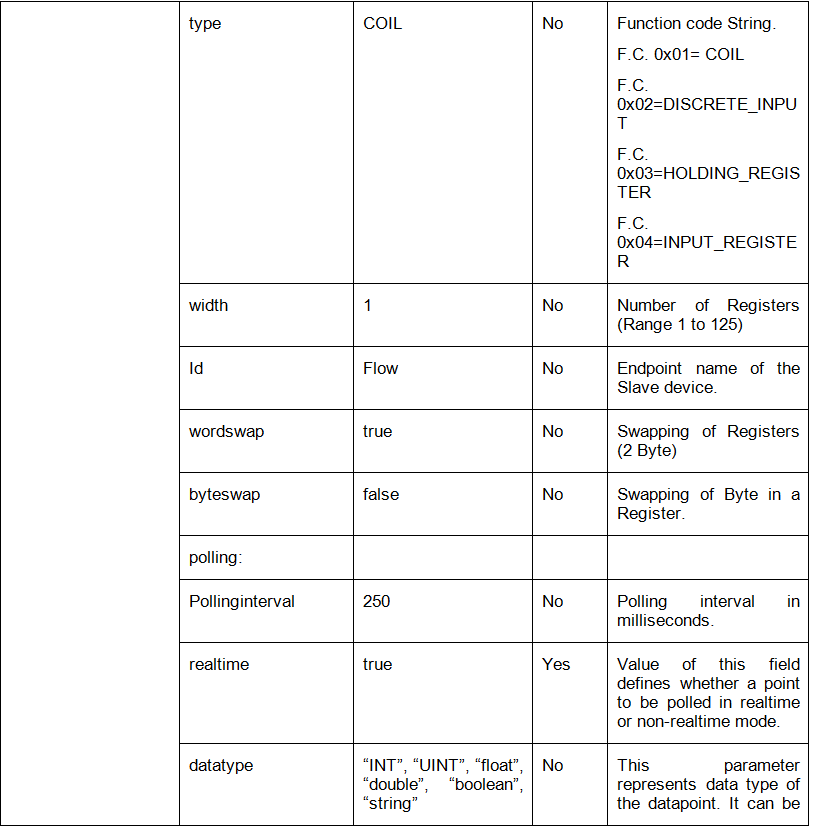
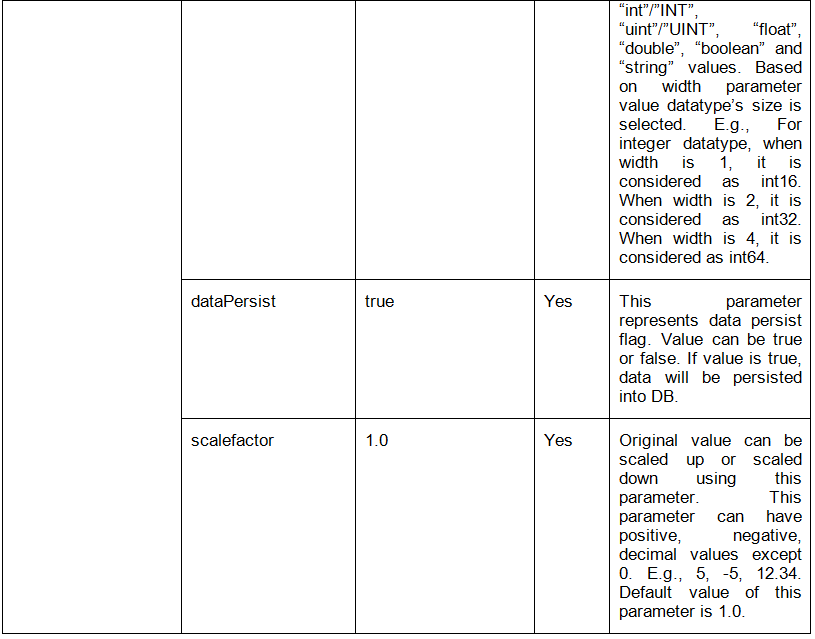
7.5 How to Add, Edit, or Delete a New Wellhead, Device, or point configurations
You can add, update, edit, or delete oil well configurations files (YML files) from the following directory, /opt/intel/eii/uwc_data directory
Open a terminal and go to <working_dir>/IEdgeInsights directory.
Navigate to <working_dir>/IEdgeInsights/uwc/build_scripts
Run the following command to apply a new oil well site configurations
Note
This script will restart all the Universal Wellpad Controller docker containers.This script is applicable only for DEV mode.
7.6 KPI App Configuration
A sample configuration file for KPI Application is as follows:
— file:
version: “1.0.0”
author: “Intel”
date: “Sun Sep 1 13:34:13 PDT 2020”
description: “KPI App Config File”
isMQTTModeApp: false
timeToRun_Minutes: 10
isRTModeForPolledPoints: true
isRTModeForWriteOp: true
# This section lists down number of control loops.
** For each control loop, following information is presented:**
** 1. Point being polled**
** 2. Point and value to be used for writing**
** 3. Delay to be used before sending a write operation.**
** 4. Polled data points and write operation data points must be unique.**
controlLoopDataPointMapping:
- polled_point: “/flowmeter/PL0/P1”
delay_msec: 5
write_operation:
datapoint: “/iou/PL0/D1”
dataval: “0x01”
- polled_point: “/flowmeter/PL0/P2”
delay_msec: 15
write_operation:
datapoint: “/flowmeter/PL0/D2”
dataval: “0x1234”
The description of each field is as follows:
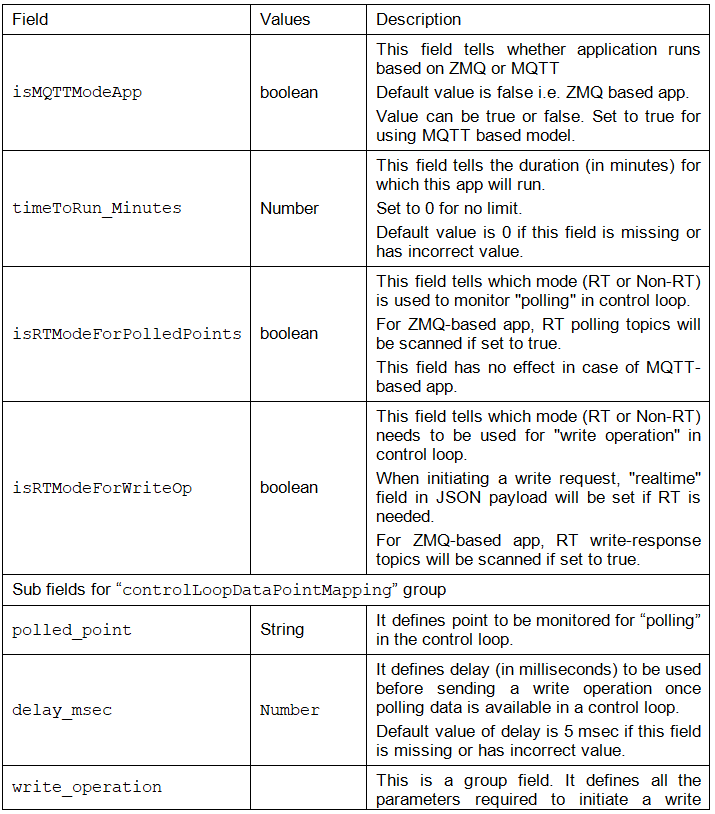
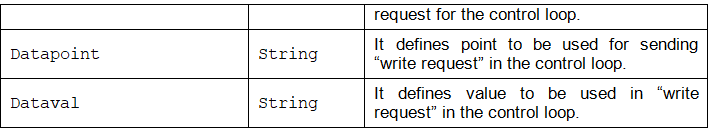
Note
This configuration file should be created manually with following considerations:
The points in “polled_point” and “datapoint” fields in this file should be configured as per actual configuration in wellhead, device and datapoints config files. For example, if a point to be polled is not present in datapoints config file then data for that control loop will not be collected.
Polled data points in “Polled_point” and write operation data points in “write_operation” must be unique.
If the points being polled are configured as “realtime” in datapoints config file, then “isRTModeForPolledPoints” should be set to “true”. It should be set to “false” otherwise.
KPI App can monitor either RT or Non-RT points at a time.
KPI App container can run either in ZMQ mode or in MQTT mode at a time.
8.0 Universal Wellpad Controller Modbus Operations
This section provides configurations required to read and write data from sensors and actuators connected over Modbus TCP or RTU on Universal Wellpad Controller gateway. An application can perform following operations using Universal Wellpad Controller containers:
Data Polling
On-Demand Write
On-Demand Read
Following section explains how to use MQTT/EMB topics to perform above operations. Further these operations can be performed in realtime (RT) and non-realtime (Non-RT) mode. Multiple modules are involved in processing the operation. To capture the time taken by each module (i.e., a step), epoch timestamps in microseconds are added at various levels. These timestamps are present in JSON message.
The table of terms here is useful for interpreting the JSON payloads of the messages.

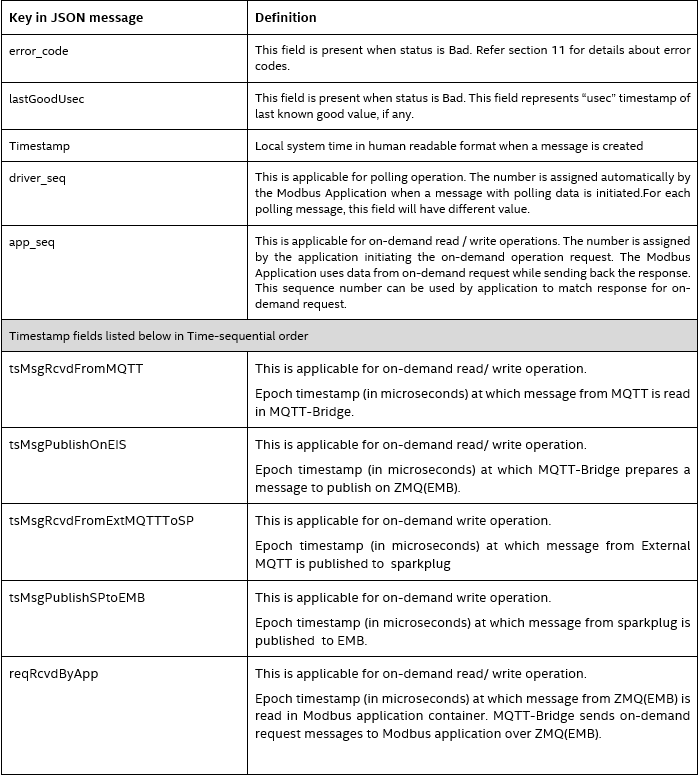
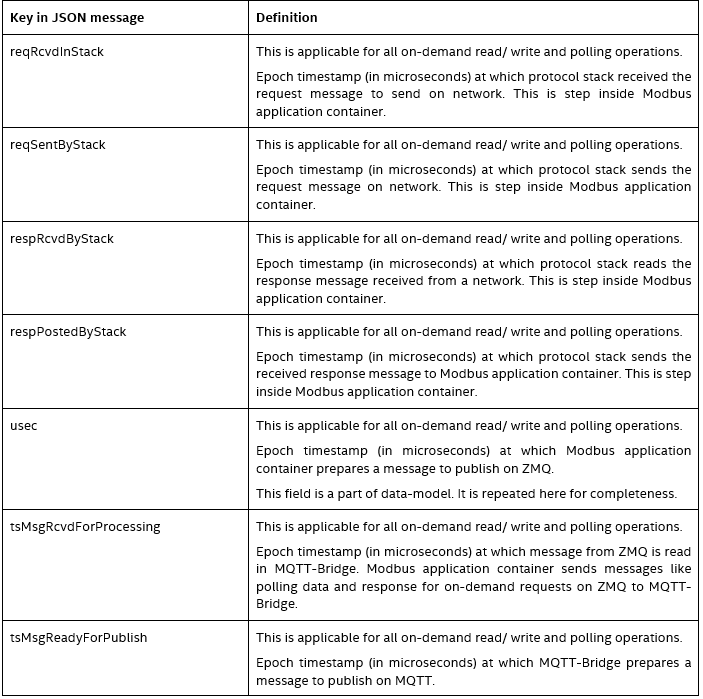
8.1 Topic Format for Publishing/Subscribing
Both MQTT and EMB topic formats are crafted to be granular, hence enabling client applications to be written directly on top of both MQTT & EMB (Edge Insights Message bus).
8.1.1 MQTT Topic Format
Granular MQTT topic format was supported historically in Universal Wellpad Controller & it’s topic format is as follows : /device/wellhead/datapoint/<operation>.
where, “/device/wellhead/datapoint” - Refers to the absolute path to the datapoint. “<operation>” - can be “read”, “write”, “polling(update)”.
8.1.2 EMB Topic Format
The new EMB granular topic format is a new feature to Universal Wellpad Controller, hence enabling client applications to be written directly on top of Edge Insights Message bus.
The new EMB topic format for publishing from “MQTT bridge” / “Kpi-App” / “Client Application written directly on EMB” ::** <RT|NRT>/<operation>/device/wellhead/datapoint .
where,
<RT/NRT> – means, Realtime/Non-Realtime respectively.
<operation> – can be “read” or “write”.
device/wellhead/datapoint – Is the Absolute path to the datapoint. (Example, /flowmeter/PL0/DP1).
The new EMB topic format for subscribing from modbus master onto MQTT_Bridge/Kpi-app/”any-client-app” :: <TCP|RTU>/<RT|NRT>/<operation>/device/wellhead/datapoint.
where,
<TCP|RTU> – Is to indicate if the data is coming from modbus-TCP-master OR modbus-RTU-master.
<RT/NRT> – means, Realtime/Non-Realtime respectively.
<operation> – can be “read”, “write”, “polling(update)”.
device/wellhead/datapoint – Is the Absolute path to the datapoint. (Example, /flowmeter/PL0/DP1).
NOTE: Vendor_Apps is used for publishing/subscribing on EMB.For more details on EMB way, refer to Vendor_Apps/README-VA.md
8.2 Data Polling
In the datapoint YML configuration file, a polling frequency is configured. As per polling frequency, data is fetched from the end point and published on MQTT/EMB by the Universal Wellpad Controller container. This section describes how to read the data for polled points using MQTT/EMB.
The data actions which are “Polling” actions are initiated by the Protocol container (in this case the Modbus protocol application (i.e., the driver) within the Modbus container.
To receive polled data: Application can use MQTT topic or EMB topic in following format to receive (i.e., subscribe) polling data from MQTT/EMB:
- MQTT topic to receive (i.e., subscribe) polling:
/device/wellhead/datapoint/update
- EMB topic to receive (i.e., subscribe) polling:
<TCP|RTU>/<RT|NRT>/update/device/wellhead/datapoint
Refer to the table in section 6 for details of fields.
Example:
Polling MQTT Topic: /flowmeter/PL0/D3/update
Polling Message: Success Response
{
“datatype”: “int16”,
“respPostedByStack”: “1626778386833063”,
“dataPersist”: true,
“respRcvdByStack”: “1626778386832788”,
“status”: “Good”,
“tsMsgRcvdForProcessing”: “1626778386838199”,
“wellhead”: “PL0”,
“scaledValue”: 4,
“driver_seq”: “1153204606361944465”,
“value”: “0x0004”,
“reqRcvdInStack”: “1626778386809284”,
“data_topic”: “/flowmeter/PL0/D3/update”,
“metric”: “D3”,
“usec”: “1626778386833431”,
“reqSentByStack”: “1626778386819158”,
“tsPollingTime”: “1626778386809058”,
“version”: “2.0”,
“realtime”: “0”,
“timestamp”: “2021-07-20 10:53:06”,
“tsMsgReadyForPublish”: “1626778386838268”
}
Polling Message: Error Response
{
“datatype”: “int16”,
“respPostedByStack”: “0”,
“lastGoodUsec”: “1626847050409405”,
“realtime”: “0”,
“dataPersist”: true,
“respRcvdByStack”: “0”,
“status”: “Bad”,
“tsMsgRcvdForProcessing”: “1626847098399696”,
“wellhead”: “PL0”,
“scaledValue”: 0,
“driver_seq”: “1155737881221051931”,
“value”: “0x00”,
“reqRcvdInStack”: “0”,
“data_topic”: “/flowmeter/PL0/D3/update”,
“metric”: “D3”,
“usec”: “1626847098395437”,
“reqSentByStack”: “0”,
“tsPollingTime”: “1626847098394978”,
“version”: “2.0”,
“error_code”: “2003”,
“timestamp”: “2021-07-21 05:58:18”,
“tsMsgReadyForPublish”: “1626847098399751”
}
Polling EMB Topic: TCP/RT/update/flowmeter/PL0/D3
Polling Message: Success Response
map[dataPersist:false data_topic:/flowmeter/PL0/D24/update datatype:int16 driver_seq:1159678555551634569 metric:D24 realtime:1 reqRcvdInStack:1651503731840786 reqSentByStack:1651503731849454 respPostedByStack:1651503731849790 respRcvdByStack:1651503731849784 scaledValue:0 status:Good timestamp:2022-05-02 15:02:11 tsPollingTime:1651503731840671 usec:1651503731849843 value:0x0000 version:2.0 wellhead:PL0]
Response Message: Error Response
map[dataPersist:false data_topic:/iou/PL2/D8/update datatype:int16 driver_seq:2313444485088737685 error_code:2021 lastGoodUsec: metric:D8 realtime:0 reqRcvdInStack:1651503856016109 reqSentByStack:0 respPostedByStack:1651503856016337 respRcvdByStack:0 scaledValue:0 status:Bad timestamp:2022-05-02 15:04:16 tsPollingTime:1651503856015966 usec:1651503856021919 value: version:2.0 wellhead:PL2]
8.3 On-Demand Write
This section describes how to write data to some specific Modbus point using MQTT/EMB.
To send request: Application should use a MQTT topic or EMB topic in the following format to send (i.e., publish) write request on MQTT/EMB:
MQTT topic to send (i.e., publish) write request: /device/wellhead/datapoint/write
EMB topic to send (i.e., publish) write request: <RT|NRT>/write/device/wellhead/datapoint
To receive response: Application should use a MQTT topic or EMB topic in the following format to receive (i.e., subscribe) response of write request from MQTT/EMB:
MQTT topic to receive (i.e., subscribe) write response: /device/wellhead/point/writeResponse
EMB topic to receive (i.e., subscribe) write response: <TCP|RTU>/<RT|NRT>/writeResponse/device/wellhead/datapoint
Please refer to the table in section 6 for details of fields.
Example:
Request MQTT Topic: /flowmeter/PL0/Flow/write
Request EMB Topic: RT/write/flowmeter/PL0/DP1
Request Message:
{“wellhead”:”PL0”,”command”:”Flow”,”value”:”0x00”,”timestamp”:”2019-09-20 12:34:56”,”usec”:”1571887474111145”,”version”:”2.0”,”app_seq”:”1234”}
A message without “realtime” field is treated as a non-realtime message. To execute a message in realtime way, a field called “realtime” should be added as shown below:
{“wellhead”:”PL0”,”command”:”Flow”,”value”:”0x00”,”timestamp”:”2019-09-20 12:34:56”,”usec”:”1571887474111145”,”version”:”2.0”,”app_seq”:”1234”,”realtime”:”1”}
A message for EMB topic.
{“app_seq”:”1234”,”command”:”D3”,”wellhead”:”PL0”,”value”:”0xA1B2”, “tsMsgRcvdFromMQTT”:”1646297507789868”,”usec”:”123445”,”timestamp”:”2020-01-14 13:34:56”, “version”:”2.0”,”realtime”:”1”,”dataPersist”: true,”tsMsgPublishOnEII”:”1646297508040408”}
A message with “value” is treated as On-Demand Write from vendor App.
{“wellhead” : “PL0”,”command” : “INT16_MF10”,”timestamp” : “2019-09-20 12:34:56”, “usec” : “1571887474111145”,”version” : “2.0”,”realtime” : “0”,”app_seq” : “1234”, “scaledValue” : 12}
A message with “scaledValue” is treated as On-Demand Write from Ignition system.
The “value” / “scaledValue” field represents value to be written to the end device as a part of on-demand write operation.
Response MQTT Topic: /flowmeter/PL0/Flow/writeResponse
Response Message: Success Response
{
“app_seq”: “1234”,
“respPostedByStack”: “1626846891692261”,
“dataPersist”: true,
“respRcvdByStack”: “1626846891692219”,
“status”: “Good”,
“tsMsgRcvdForProcessing”: “1626846891693976”,
“wellhead”: “PL0”,
“tsMsgRcvdFromMQTT”: “1626846891669463”,
“tsMsgPublishOnEII”: “1626846891669925”,
“reqRcvdInStack”: “1626846891672050”,
“data_topic”: “/flowmeter/PL0/Flow/writeResponse”,
“reqRcvdByApp”: “1626846891671963”,
“metric”: “Flow”,
“usec”: “1626846891692549”,
“reqSentByStack”: “1626846891673238”,
“timestamp”: “2021-07-21 05:54:51”,
“version”: “2.0”,
“realtime”: “0”,
“tsMsgReadyForPublish”: “1626846891694023”
}
Response Message: Error Response
{
“app_seq”: “1234”,
“respPostedByStack”: “0”,
“dataPersist”: true,
“respRcvdByStack”: “0”,
“status”: “Bad”,
“tsMsgRcvdForProcessing”: “1626778808002974”,
“wellhead”: “PL0”,
“tsMsgRcvdFromMQTT”: “1626778808000285”,
“tsMsgPublishOnEII”: “1626778808000437”,
“reqRcvdInStack”: “0”,
“data_topic”: “/flowmeter/PL0/Flow/writeResponse”,
“reqRcvdByApp”: “1626778808001309”,
“metric”: “Flow”,
“usec”: “1626778808001814”,
“reqSentByStack”: “0”,
“error_code”: “2003”,
“version”: “2.0”,
“realtime”: “0”,
“timestamp”: “2021-07-20 11:00:08”,
“tsMsgReadyForPublish”: “1626778808003021”
}
Response Message: Error Response for Invalid request JSON
{
“app_seq”: “1234”,
“respPostedByStack”: “0”,
“dataPersist”: true,
“respRcvdByStack”: “0”,
“status”: “Bad”,
“tsMsgRcvdForProcessing”: “1626778808002974”,
“wellhead”: “PL0”,
“tsMsgRcvdFromMQTT”: “1626778808000285”,
“tsMsgPublishOnEII”: “1626778808000437”,
“reqRcvdInStack”: “0”,
“data_topic”: “/flowmeter/PL0/Flow/writeResponse”,
“reqRcvdByApp”: “1626778808001309”,
“metric”: “Flow”,
“usec”: “1626778808001814”,
“reqSentByStack”: “0”,
“error_code”: “100”,
“version”: “2.0”,
“realtime”: “0”,
“timestamp”: “2021-07-20 11:00:08”,
“tsMsgReadyForPublish”: “1626778808003021”
}
Request EMB Topic: TCP/RT/writeResponse/flowmeter/PL0/DP1
Response Message: Success Response
map[app_seq:1234 dataPersist:true data_topic:/flowmeter/PL0/D3/writeResponse metric:D3 realtime:1 reqRcvdByApp:1651503385445877 reqRcvdInStack:1651503385445919 reqSentByStack:1651503385447119 respPostedByStack:1651503385447716 respRcvdByStack:1651503385447627 status:Good timestamp:2022-05-02 14:56:25 tsMsgPublishOnEII:1646297508040408 tsMsgRcvdFromMQTT:1646297507789868 usec:1651503385448043 version:2.0 wellhead:PL0]
Response Message: Error Response for Invalid request JSON
map[app_seq:1234 dataPersist:true data_topic:/flowmeter/PL0/D3/writeResponse error_code:2003 metric:D3 realtime:1 reqRcvdByApp:1651493000724114 reqRcvdInStack:1651493000746337 reqSentByStack:0 respPostedByStack:1651493000851895 respRcvdByStack:0 status:Bad timestamp:2022-05-02 12:03:20 tsMsgPublishOnEII:1646297508040408 tsMsgRcvdFromMQTT:1646297507789868 usec:1651493000852203 version:2.0 wellhead:PL0 ]
8.4 On-Demand Read
This section describes how to read data from some specific Modbus points using MQTT/EMB.
To send request: Application should use a MQTT topic or EMB topic in the following format to send (i.e., publish) read request on MQTT/EMB:
MQTT topic to send (i.e. publish) read request: /device/wellhead/datapoint/read
EMB topic to send (i.e. publish) read request: <RT|NRT>/read/device/wellhead/datapoint
To receive response: Application should use a MQTT topic or EMB topic in the following format to receive (i.e., subscribe) response of read request from MQTT/EMB:
MQTT topic to receive (i.e., subscribe) read response: /device/wellhead/point/readResponse
EMB topic to receive (i.e., subscribe) read response: <TCP|RTU>/<RT|NRT>/readResponse/device/wellhead/datapoint
Please refer to the table in section 6 for details of fields.
Example:
Request MQTT Topic: /flowmeter/PL0/Flow/read
Request Message:
{“wellhead”:”PL0”,”command”:”Flow”,”timestamp”:”2019-09-20 12:34:56”,”usec”:”1571887474111145”,”version”:”2.0”,”app_seq”:”1234”}
A message without “realtime” field is treated as a non-realtime message. To execute a message in realtime way, a field called “realtime” should eb added as shown below:
{“wellhead”:”PL0”,”command”:”Flow”,”timestamp”:”2019-09-20 12:34:56”,”usec”:”1571887474111145”,”version”:”2.0”,”app_seq”:”1234”,”realtime”:”1”}
A message for EMB topic.
{“app_seq”:”1234”,”command”:”D3”,”wellhead”:”PL0”,”value”:”0xA1B2”,”tsMsgRcvdFromMQTT”:”1646297507789868”, “usec”:”123445”,”timestamp”:”2020-01-14 13:34:56”,”version”:”2.0”,”realtime”:”1”, “dataPersist”: true,”tsMsgPublishOnEII”:”1646297508040408”}
Response MQTT Topic: /flowmeter/PL0/Flow/readResponse
Request EMB Topic: TCP/RT/readResponse/flowmeter/PL0/Flow
Response Message: Success Response
{
“app_seq”: “1234”,
“respPostedByStack”: “1626778599282378”,
“dataPersist”: true,
“respRcvdByStack”: “1626778599282315”,
“status”: “Good”,
“tsMsgRcvdForProcessing”: “1626778599284171”,
“wellhead”: “PL0”,
“scaledValue”: 4,
“value”: “0x0004”,
“tsMsgRcvdFromMQTT”: “1626778599275557”,
“tsMsgPublishOnEII”: “1626778599277242”,
“reqRcvdInStack”: “1626778599279507”,
“data_topic”: “/flowmeter/PL0/Flow/readResponse”,
“reqRcvdByApp”: “1626778599279422”,
“metric”: “Flow”,
“usec”: “1626778599282619”,
“reqSentByStack”: “1626778599280674”,
“timestamp”: “2021-07-20 10:56:39”,
“version”: “2.0”,
“realtime”: “0”,
“tsMsgReadyForPublish”: “1626778599284240”
}
Response Message: Error Response
{
“app_seq”: “1234”,
“respPostedByStack”: “0”,
“dataPersist”: false,
“respRcvdByStack”: “0”,
“status”: “Bad”,
“tsMsgRcvdForProcessing”: “1626846987971314”,
“wellhead”: “PL0”,
“tsMsgRcvdFromMQTT”: “1626846987968830”,
“tsMsgPublishOnEII”: “1626846987968983”,
“reqRcvdInStack”: “0”,
“data_topic”: “/flowmeter/PL0/Flow/readResponse”,
“reqRcvdByApp”: “1626846987969861”,
“metric”: “Flow”,
“usec”: “1626846987970320”,
“reqSentByStack”: “0”,
“error_code”: “2003”,
“version”: “2.0”,
“realtime”: “0”,
“timestamp”: “2021-07-21 05:56:27”,
“tsMsgReadyForPublish”: “1626846987971358”
}
Response Message: Error Response for Invalid Input JSON
{
“app_seq”: “1234”,
“respPostedByStack”: “0”,
“dataPersist”: false,
“respRcvdByStack”: “0”,
“status”: “Bad”,
“tsMsgRcvdForProcessing”: “1626846987971314”,
“wellhead”: “PL0”,
“tsMsgRcvdFromMQTT”: “1626846987968830”,
“tsMsgPublishOnEII”: “1626846987968983”,
“reqRcvdInStack”: “0”,
“data_topic”: “/flowmeter/PL0/Flow/readResponse”,
“reqRcvdByApp”: “1626846987969861”,
“metric”: “Flow”,
“usec”: “1626846987970320”,
“reqSentByStack”: “0”,
“error_code”: “100”,
“version”: “2.0”,
“realtime”: “0”,
“timestamp”: “2021-07-21 05:56:27”,
“tsMsgReadyForPublish”: “1626846987971358”
}
Request EMB Topic: RT/read/flowmeter/PL0/D3
Response Message: Success Response
map[app_seq:1234 dataPersist:true data_topic:/flowmeter/PL0/D3/readResponse metric:D3 realtime:1 reqRcvdByApp:1651503604954249 reqRcvdInStack:1651503604954282 reqSentByStack:1651503604955452 respPostedByStack:1651503604956081 respRcvdByStack:1651503604955994 scaledValue:-24142 status:Good timestamp:2022-05-02 15:00:04 tsMsgPublishOnEII:1646297508040408 tsMsgRcvdFromMQTT:1646297507789868 usec:1651503604956417 value:0xA1B2 version:2.0 wellhead:PL0]
Response Message: Error Response for Invalid Input JSON
map[app_seq:1234 dataPersist: true data_topic:/flowmeter/PL0/D3/readResponse error_code:2003 metric:D3 realtime:1 reqRcvdByApp:1651493040318960 reqRcvdInStack:1651493040318970 reqSentByStack:0 respPostedByStack:1651493040461794 respRcvdByStack:0 status:Bad timestamp:2022-05-02 12:04:00 tsMsgPublishOnEII:1646297508040408 tsMsgRcvdFromMQTT:1646297507789868 usec:1651493040462125 value: version:2.0 wellhead:PL0]
8.5 KPI Application
The KPI Application records (logs) the following data in a log-file for control loops.
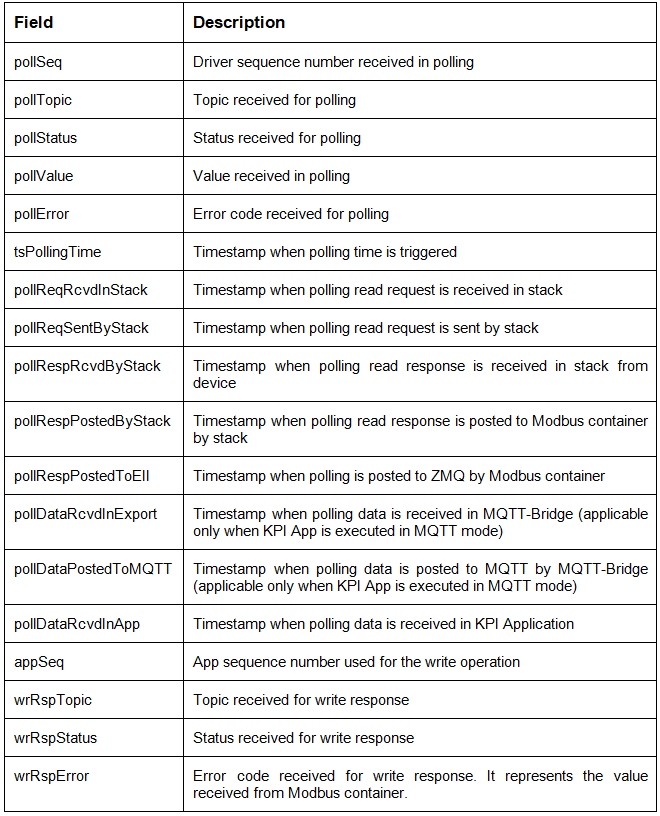
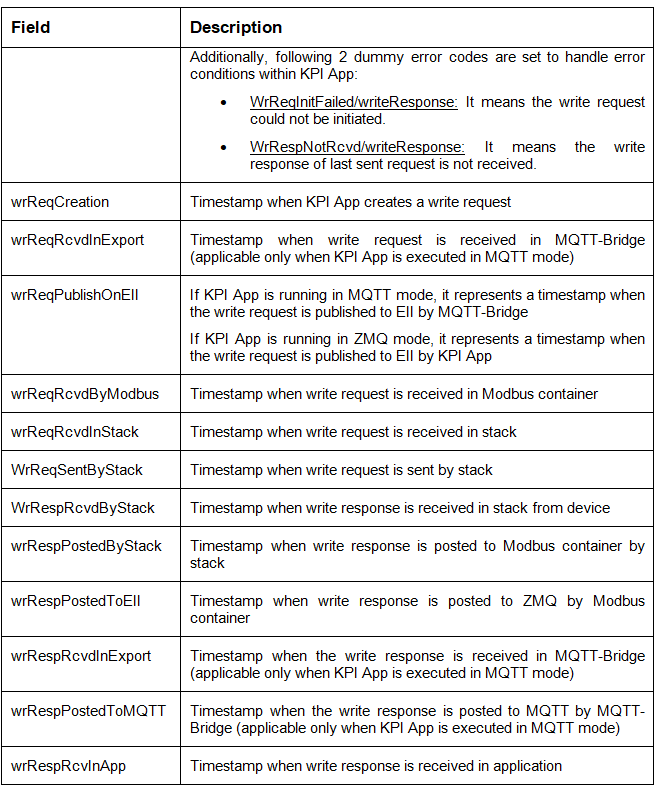
9.0 Sparkplug-Bridge Operations
Sparkplug-Bridge implements Eclipse Foundation’s SparkPlug* standard. The reference to the Sparkplug standard can be found below:
This section explains the features in detail. Universal Wellpad Controller gateway acts as a “node” as per SparkPlug* standard. Note that Sparkplug-Bridge is an under-development feature and hence not all message types are supported from SparkPlug*.
This section also explains how information from real device and virtual device is mapped to SparkPlug*-formatted data.
9.1 App mode of communication
Sparkplug* can communicate with rest of Universal Wellpad Controller containers by two ways either:
By MQTT mode (which is sparkplug-bridge -> internal-mqtt-Broker -> mqtt-bridge -> EMB)
By EMB mode (which is sparkplug-bridge -> EMB).
For communicating with MQTT, set “enable_EMB” as “false” in “sparkplug-bridge/config.json” file.
For communicating with EMB, set “enable_EMB” as “true” in “sparkplug-bridge/config.json” file. For more details on EMB way, refer to Vendor_Apps/README-VA.md
9.2 App (virtual device) communication
Apps running on Universal Wellpad Controller platform can be represented as a SparkPlug* device to SCADA Master. SCADA Master can monitor, control these apps using SparkPlug mechanism. Sparkplug-Bridge defines following to enable this communication between apps and SCADA Master:
TemplateDef message: This allows providing a definition for a Sparkplug Template i.e., UDT
BIRTH message: This corresponds to a SparkPlug* DBIRTH message.
DEATH message: This corresponds to a SparkPlug* DDEATH message.
DATA message: This corresponds to a SparkPlug* DDATA message.
CMD message: This corresponds to a SparkPlug* DCMD message.
Apps and Sparkplug-Bridge communicate over either internal MQTT or EMB using above defined messages.
9.2.1 App Message Topic Format
MQTT/EMB Topic: MESSAGETYPE/APPID/SUBCLASS
Where,
MESSAGETYPE: Any of “BIRTH”, “DEATH”, “DATA”, “CMD”
APPID: Any string e.g., “UWCP”
SUBCLASS: Any string like wellhead-id e.g., “PL0”. This is not needed in case of DEATH message.
Sparkplug-Bridge uses following format to represent name of virtual device in SparkPlug* Topic namespace:
[value of “APPID” from app message topic] + “-“ + [value of “SUBCLASS” from app message topic]
9.2.2 App Message - BIRTH
MQTT/EMB Topic: BIRTH/APPID/SUBCLASS
Message format:
It is a JSON format message which contains a list of metrics having following fields:
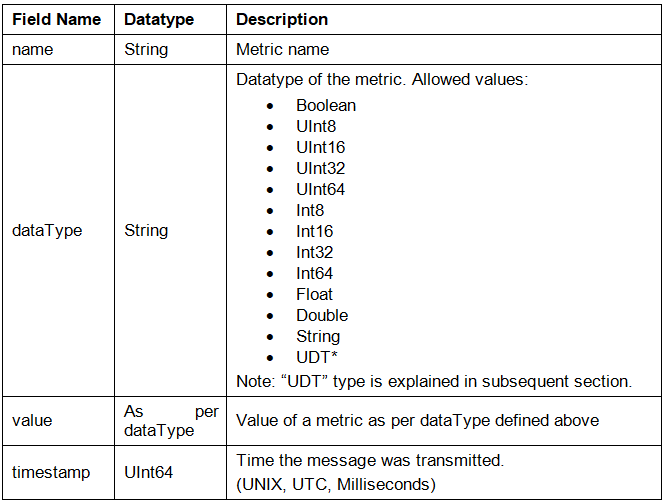
Example:
- {
“metrics”:
[
{
“name”: “Properties/Version”,
“dataType”: “String”,
“value”: “2.0.0.1”,
“timestamp”: 1486144502122
},
{
“name”: “Properties/RTU_Time”,
“dataType”: “String”,
“value”: “1234”,
“timestamp”: 1486144502122
},
{
“name”: “UDT/Prop1”,
“dataType”: “UDT”,
“value”:
{
“udt_ref”:
{
“name”: “custom_udt”,
“version”: “1.0”
},
“metrics”:
[
{
“name”: “M1”,
“dataType”: “String”,
“value”: “2.0.0.1”,
“timestamp”: 1486144502122
},
{
“name”: “RTU_Time”,
“dataType”: “Int32”,
“value”: 1234,
“timestamp”: 1486144502122
}
],
“parameters”:
[
{
“name”: “P1”,
“dataType”: “String”,
“value”: “P1Val”
},
{
“name”: “P2”,
“dataType”: “Int32”,
“value”: 100
}
]
}
}
]
}
Data Flow:
This message is published by App over MQTT broker/EMB and subscribed by Sparkplug-Bridge. This message provides information about all metrics related to a SUBCLASS which App wants to expose to a SCADA Master.
Sparkplug-Bridge publishes a DBIRTH message to SCADA Master if metrics contain a new metric or if datatype of any of metrics is changed.
Note
If the App publishes multiple BIRTH messages for a SUBCLASS, then Sparkplug-Bridge remembers all metrics reported in all BIRTH messages. Sparkplug-Bridge reports all these metrics to SCADA Master in DBIRTH message. This data with Sparkplug-Bridge is cleared on restart of gateway or Sparkplug-Bridge container.
A DBIRTH message can result in refreshing of data in Sparkplug-Bridge and in SCADA Master. Hence, it is recommended for an App to provide information about all metrics in one BIRTH message. App should avoid using multiple BIRTH messages for same SUBCLASS.
If App wants to publish a metric of type “UDT”, the definition of “UDT” should be provided prior to publishing the BIRTH message. UDT definition can be provided using “TemplateDef” message, explained in subsequent section.
Following information is required as a part of “value” key when UDT type is used:
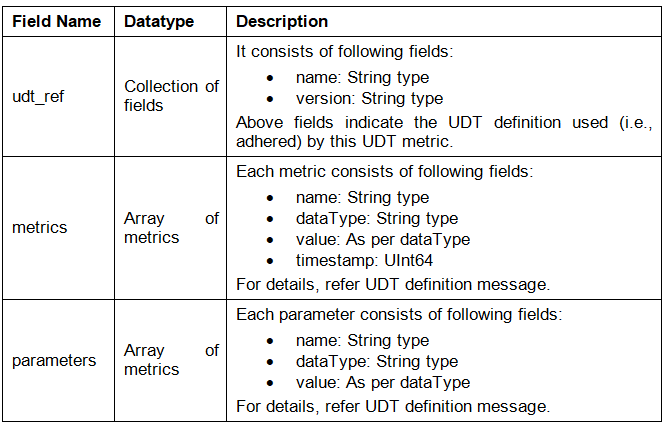
9.2.3 App Message - DATA
MQTT/EMB Topic: DATA/APPID/SUBCLASS
Message format:
It is a JSON format message which contains a list of metrics having following fields:

Example:
{
“metrics”:
[
{
“name”: “Properties/Version”,
“dataType”: “String”,
“value”: “5.0.0.1”,
“timestamp”: 1486144502122
},
{
“name”: “UDT/Prop1”,
“dataType”: “UDT”,
“value”:
{
“metrics”:
[
{
“name”: “M1”,
“dataType”: “String”,
“value”: “a.b”,
“timestamp”: 1486144502122
}
]
}
}
]
}
Data Flow:
This message is published by App over MQTT broker/EMB and subscribed by Sparkplug-Bridge. This message provides information about all changed metrics related to a SUBCLASS.
Sparkplug-Bridge publishes a DDATA message to SCADA Master if value of any of “known metrics” is changed compared to last known value from a BIRTH or DATA message.
Note
A “known metric” is one which was reported in BIRTH message. The name and datatype for a “known metric” in DATA message and BIRTH message shall match.
9.2.4 App Message - CMD
MQTT/EMB Topic: CMD/APPID/SUBCLASS
Message format:
It is a JSON format message which contains a list of metrics having following fields:
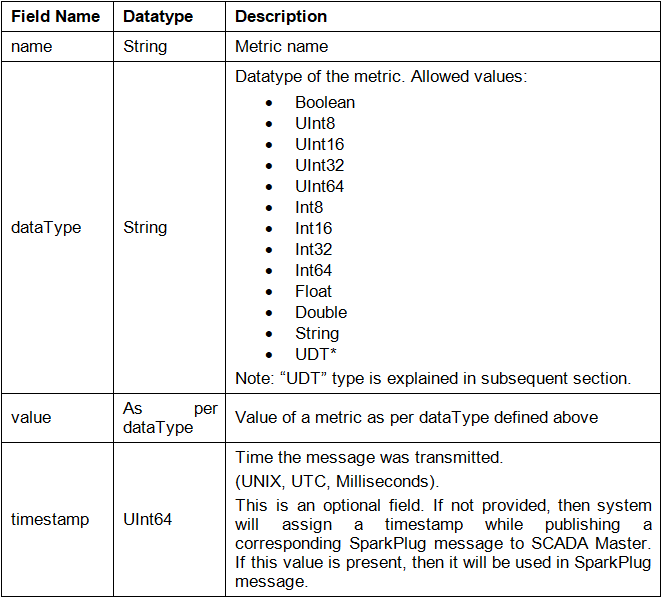
Example:
{
“metrics”:
[
{
“name”: “Properties/Version”,
“dataType”: “String”,
“value”: “7.0.0.1”,
“timestamp”: 1486144502122
},
{
“name”: “UDT/Prop1”,
“dataType”: “UDT”,
“metrics”:
[
{
“dataType”: “Int32”,
“value”: 4,
“name”: “RTU_Time”,
“timestamp”: 1614512107195
}
],
“timestamp”: 1614512107195
}
]
}
Data Flow:
This message is published by Sparkplug-Bridge over MQTT broker/EMB and subscribed by App. This message provides information about control command i.e., DCMD received from SCADA Master.
Sparkplug-Bridge publishes a CMD message to the App if DCMD message is received for a known metric.
Note
A “known metric” is one which was reported in BIRTH message. The name and datatype for a “known metric” in DCMD message and BIRTH message shall match.
9.2.5 App Message - DEATH
MQTT/EMB Topic: DEATH/APPID
Message format:
It is a JSON format message which contains the following fields:
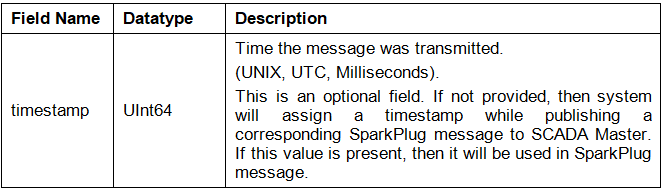
Example:
{
“timestamp”: 1486144502122
}
Data Flow:
When App’s connection with MQTT broker/ EMB breaks then this message is published.
Sparkplug-Bridge publishes a DDEATH message to SCADA Master for all known SUBCLASS associated with the App.
9.2.6 App Message - TemplateDef
MQTT/EMB Topic: TemplateDef
Message format:
It is a JSON format message which contains a list of metrics having following fields:
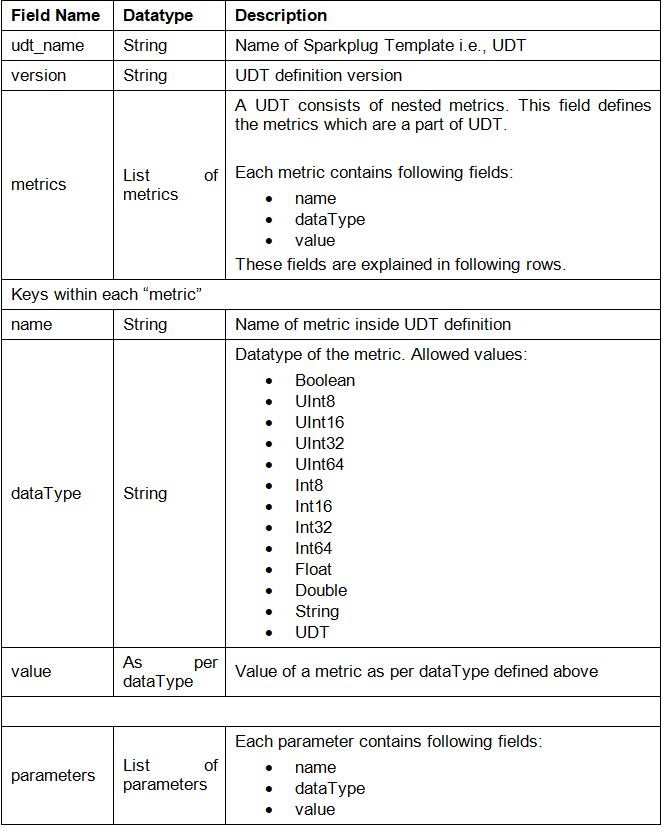

Example:
{
“udt_name”: “custom_udt”,
“version”: “1.0”,
“metrics”: [
{
“name”: “M1”,
“dataType”: “String”,
“value”: “”
},
{
“name”: “RTU_Time”,
“dataType”: “Int32”,
“value”: 0
}
],
“parameters”: [
{
“name”: “P1”,
“dataType”: “String”,
“value”: “”
},
{
“name”: “P2”,
“dataType”: “Int32”,
“value”: 0
}
]
}
Data Flow:
App should use this message to provide definition of a Sparkplug Template i.e., UDT. UDT definitions are published as a part of NBIRTH message. Hence, after receiving a UDT definition, Sparkplug-Bridge publishes NDEATH and then NBIRTH to SCADA-Master.
9.2.7 START_BIRTH_PROCESS
MQTT/EMB Topic: START_BIRTH_PROCESS
Message format:
It is an empty JSON format message:
Field Name |
Datatype |
Description |
Example:
{
}
Data Flow:
This message is published by Sparkplug-Bridge over MQTT broker/EMB and subscribed by App. This message tells the App to publish following:
Definition of Sparkplug Templates i.e., UDT which are used by App in BIRTH message
BIRTH messages for all SUBCLASS the App is having. The App shall publish BIRTH messages on receiving START_BIRTH_PROCESS message.
START_BIRTH_PROCESS message will be sent on restart of Sparkplug-Bridge container or whenever Sparkplug-Bridge container needs to refresh the data that it maintains for virtual devices.
9.3 Modbus (real) device communication
Modbus devices present in network are reported to SCADA Master using SparkPlug mechanism.
Apps and Sparkplug-Bridge communicate over internal MQTT/EMB using above defined messages.
9.3.1 Support for DBIRTH
Data from device YML configuration files is used to form a DBIRTH message for real devices at the start of Sparkplug-Bridge container. One datapoint YML file corresponds to one SparkPlug template definition. One real Modbus device contains one metric of type SparkPlug template. The SparkPlug template in turn contains all other metrics which correspond to datapoints mentioned in datapoints-YML file.
9.3.2 Support for DDATA
Data from polling operation is either published by MQTT-Bridge over internal MQTT or published by EMB is used to determine a change in value of any of metrics associated with a real device. If a change is detected, a DDATA message is published by Sparkplug-Bridge.
9.3.3 Support for DCMD
When a DCMD message is received from a SCADA Master for a real device for a “known metric”, then an on-demand write operation is initiated by SCADA and sent to either MQTT-Bridge over internal MQTT or to EMB.
Note
A “known metric” is one which is present in device YML configuration file. The name and datatype for a “known metric” in DCMD message and YML file shall match.
A DCMD message can result in multiple on-demand write operations.
9.3.4 Support for DDEATH
Data from polling operation published either by MQTT-Bridge over internal MQTT or by EMB is used to determine whether a device is reachable or not, based on error_code. If device unreachable error-code is found, a DDEATH message is published by Sparkplug-Bridge. When correct values are found, a DBIRTH message is published.
9.4 SparkPlug Messages
Refer SparkPlug standard for more information.
9.4.1 NBIRTH Message
NBIRTH is Node-Birth.
On start-up, Sparkplug-Bridge module publishes this message over MQTT external broker. The message is published in SparkPlug* encoded format.
For Modbus real device, one datapoint YML file corresponds to one SparkPlug* template. These template definitions are sent in NBIRTH message. DBIRTH message for Modbus device specifies a particular SparkPlug template.
Following are sample contents in simplified JSON format:
Topic: spBv1.0/UWC nodes/NBIRTH/RBOX510-00
Message:
- {
“timestamp”: 1608243262157,
“metrics”:
[
- {
“name”: “Name”,
“timestamp”: 1608243262157,
“dataType”: “String”,
“value”: “SPARKPLUG-BRIDGE”
},
{
“name”: “bdSeq”,
“timestamp”: 1608243262157,
“dataType”: “UInt64”,
“value”: 0
},
{
“name”: “Node Control/Rebirth”,
“timestamp”: 1608243262157,
“dataType”: “Boolean”,
“value”: false
},
{
“name”: “iou_datapoints”,
“timestamp”: 1608243262157,
“dataType”: “Template”,
“value”:
- {
“version”: “1.0.0”,
“reference”: “”,
“isDefinition”: true,
“metrics”:
[
{
“name”: “D1”,
“timestamp”: 1608243262157,
“dataType”: “String”,
“properties”:
{
“Pollinterval”:
{
“type”: “UInt32”,
“value”: 0
},
“Realtime”:
{
“type”: “Boolean”,
“value”: false
}
},
“value”: “”
},
{
“name”: “D2” , “timestamp”: 1608243262157,
“dataType”: “String”,
“properties”:
{
“Pollinterval”:
{
“type”: “UInt32”,
“value”: 0
},
“Realtime”:
{
“type”: “Boolean”,
“value”: false
}
},
“value”: “”
}
],
“parameters”:
[
{
“name”: “Protocol”,
“type”: “String”,
“value”: “”
}
]
}
}
],
“seq”: 0,
“uuid”: “SPARKPLUG-BRIDGE”
}
9.4.2 NDEATH Message
NDEATH is Node-Death.
Whenever Sparkplug-Bridge module’s connection with MQTT broker/EMB breaks, the sparkplug-bridge publishes this message. The message is published in text format.
Following are sample contents in simplified JSON format:
Topic: spBv1.0/UWC nodes/NDEATH/RBOX510-00
Message:
{
“timestamp”: 1592306298537,
“metrics”:
[
{
“name”: “bdSeq”,
“alias”: 10,
“timestamp”: 1592306298537,
“dataType”: “UInt64”,
“value”: 0
}
],
“seq”: 0
}
9.4.3 DBIRTH Message
DBIRTH is Device-Birth.
On start-up, Sparkplug-Bridge module publishes this message over MQTT broker/EMB. The message is published in SparkPlug* encoded format.
Following are sample contents in simplified JSON format for a Modbus device:
{
“timestamp”: 1608242600219,
“metrics”:
[
{
“name”: “iou”,
“timestamp”: 1608242600219,
“dataType”: “Template”,
“value”:
- {
“version”: “1.0.0”,
“reference”: “iou_datapoints”,
“isDefinition”: false,
“metrics”:
[
{
“name”: “D1”,
“timestamp”: 1608242599889,
“dataType”: “Int16”,
“properties”:
{
“Scale”:
{
“type”: “Double”,
“value”: 1
},
“Pollinterval”:
{
“type”: “UInt32”,
“value”: 1000
},
“Realtime”:
{
“type”: “Boolean”,
“value”: false
}
},
“value”: 0
},
{
“name”: “D2”,
“timestamp”: 1608242599889,
“dataType”: “Int32”,
“properties”:
{
“Scale”:
{
“type”: “Double”,
“value”: 1
},
“Pollinterval”:
{
“type”: “UInt32”,
“value”: 1000
},
“Realtime”:
{
“type”: “Boolean”,
“value”: false
}
},
“value”: 0
}
],
“parameters”:
[
{
“name”: “Protocol”,
“type”: “String” , “value”: “Modbus TCP”
}
]
}
}
],
“seq”: 1
}
9.4.4 DDEATH Message
DDEATH is Device-Death.
Sparkplug-Bridge module publishes this message over MQTT broker/EMB whenever it detects that device is not reachable. The message is published in SparkPlug* encoded format.
Following are sample contents in simplified JSON format:
{
“timestamp”:1599467927490,
“metrics”:[],
“seq”:7
}
9.4.5 DDATA Message
DDATA is Device-Data.
Sparkplug-Bridge module publishes this message over MQTT broker/EMB whenever it detects a change in value of any of metrics of devices. The message is published in SparkPlug encoded format.
Following are sample contents in simplified JSON format for a Modbus device:
{
“timestamp”: 1608242631070,
“metrics”:
[
{
“name”: “iou”,
“timestamp”: 1608242631070,
“dataType”: “Template”,
“value”:
- {
“version”: “1.0.0”,
“reference”: “iou_datapoints”,
“isDefinition”: false,
“metrics”:
[
{
“name”: “D1”,
“timestamp”: 1571887474111145,
“dataType”: “String”,
“value”: “0x00”
}
]
}
}
],
“seq”: 2
}
Following is sample contents in simplified JSON format for a Modbus device with scalefactor applied:
{
“timestamp”: 1621951388659 , “metrics”:
[
{
“name”: “flowmeter”,
“timestamp”: 1621951388659,
“dataType”: “Template”,
“value”:
- {
“version”: “1.0.0”,
“reference”: “flowmeter_datapoints”,
“isDefinition”: false,
“metrics”:
[
{
“name”: “D1”,
“timestamp”: 1621951388658,
“dataType”: “Int32”,
“value”: 2910
}
]
}
}
],
“seq”: 2
}
9.4.6 NCMD Message
NCMD is Node-Command.
SCADA Master can tell edge node to reinitiate the node birth process. The node starts publishing NBIRTH, DBIRTH messages after receiving NCMD.
Following are sample contents in simplified JSON format:
Topic: spBv1.0/UWC nodes/NCMD/RBOX510-00
Message:
{
“timestamp”: 1615619351980,
“metrics”:
[
{
“name”: “Node Control/Rebirth”,
“timestamp”: 1615619351980,
“dataType”: “Boolean”,
“value”: true
}
],
“seq”: -1
}
10.0 Debugging steps
Checking logs
Syntax - sudo docker logs <container_name>
For example, to check the modbus-tcp-container logs, run the “sudo docker logs modbus-tcp-container” command.
Run the command to check logs inside the container “sudo docker exec -it <container_name> bash” and then, go to the “logs” directory using “cd logs”.
Use the “cat <log_file_name>” command to see log file inside the container.
To copy logs from container to host machine refer to the following command:
Syntax - docker cp <container_name>:<file to copy from container> <file to be copied i.e., host directory>
To check the IP address of machine, run the “ifconfig” command.
For Modbus RTU, to check attached COM port for serial communication, run the “dmesg | grep tty” command.
Redirect docker logs to file including errors
docker logs modbus-tcp-container > docker.log 2>&1
Accessing container logs through docker volumes:
Go to docker volume directory using
cd /opt/intel/eii/container_logs/<container_name>
Where <container name> is directory name for each container (i.e. “modbus-tcp-master”, “modbus-rtu-master”, “mqtt-bridge”, and so on).
Example to access container logs for modbus-tcp-master container,
cd /opt/intel/eii/container_logs/modbus-tcp-master
cat Modbus_App.log
Note
These logs are persisted across container/gateway restart.
Steps to apply new configuration (i.e., YML files)
To apply new configurations after modifying YML files or docker-compose.yml files in the /opt/intel/eii/uwc_data directory, run the following command:
sudo ./05_applyConfigChanges.sh
Note
If required, download the certificates for the internal MQTT broker.
11.0 Error Codes
MODBUS_EXCEPTION Codes
For a scenario when an error occurs, the response JSON message from the Modbus container contains an error code.
Format: “error_code”: “number”
There are 3 classes of error codes. This section lists down the error codes:
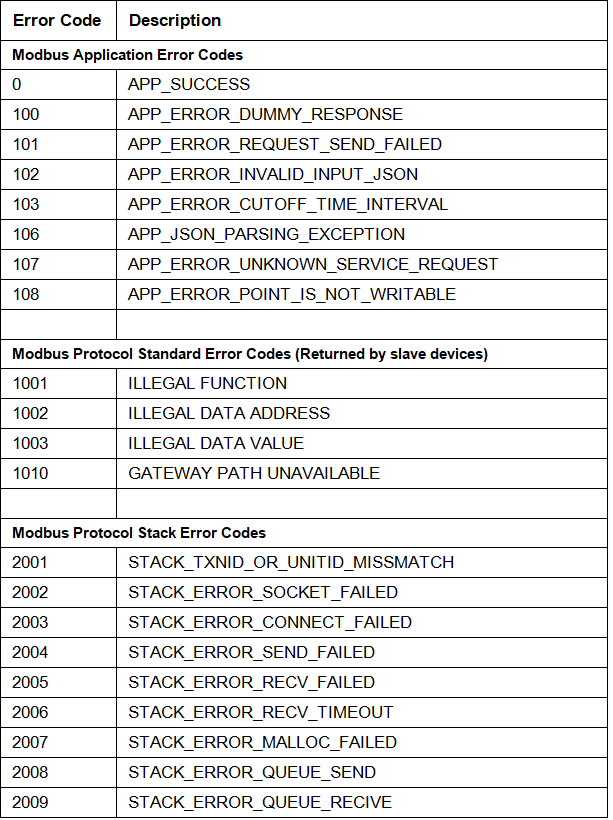
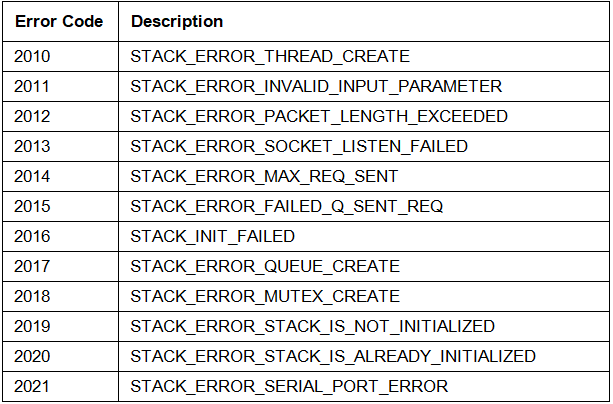
12.0 Steps to flash Low Frequency Mode BIOS
The Low Frequency Mode (LFM) is enabled on gateway for efficient power usage.
The following steps and BIOS are applicable for the following models of device:
RBOX510 ATEX & C1D2 ANTI-EXPLOSIVE CERTIFIED ROBOST DIN-RAIL FANLESS SYS.W/ATOM E3827(1.75GHz)
LFM (500) |
LFM_1750 |
Original |
|
|---|---|---|---|
Axiomtek ICO-300 |
87842XV.102 |
None |
87842V.105 |
Axiomtek RBOX510 |
XN.001 |
0502_1500M.ROM |
A.103 |
Steps for converting to LFM
Use files from the 0502_1500m.zip folder and complete the following steps:
Create a FAT32 file-system on a USB stick, then dump each BIOS file structure to the root as needed.
Prepare the LFM BIOS first on USB, then boot to the USB’s EFI device (boot priorities).
After setting the Boot priorities save & exit from boot menu. You will be switched to Command window. Press any key to enter to command line, type flash.nsh to update the BIOS.
Restart the HW and you will now be locked at 1750 MHz.
Check frequency of device using command $ cat /proc/cpuinfo | grep “MHz”
Steps for reverting to normal Frequency
Use files from the A.103 folder and complete the following steps:
Create a FAT32 file-system on a USB stick, then dump each BIOS file structure to the root as needed.
Prepare the LFM BIOS first on USB, then boot to the USB’s EFI device (boot priorities).
After setting the Boot priorities save & exit from boot menu. You will be switched to Command window. Press any key to enter to command line, type flash.nsh to update the BIOS.
Restart the HW and you will now be locked at 1750 MHz
Check frequency of device using command $ cat /proc/cpuinfo | grep “MHz”
13.0 Universal Wellpad Controller Gateway to Cloud Communication
The following steps describe the Universal Wellpad Controller Gateway and cloud communication architecture and steps to connect Universal Wellpad Controller Gateway to AWS Sitewise.
13.1 Architecture
Modbus devices connects to the on-prem Universal Wellpad Controller gateway. The gateway is having Sparkplug MQTT client which securely publishes Sparkplug* format data to AWS IoT Core. AWS IoT Core service provisions cloud connectivity to IoT edge devices. AWS IoT Core possesses an MQTT broker as one of its components. With this connectivity, Universal Wellpad Controller gateway published data is available in the AWS cloud. For more information about AWS IoT Core, see https://aws.amazon.com/iot-core.
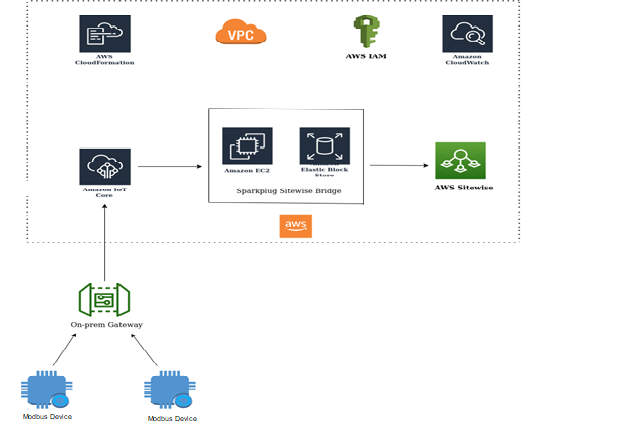
Sparkplug Sitewise Bridge (SSB) is a service which rapidly connects operational technology (OT) data from Industrial Operations (on-prem data) to AWS IoT Sitewise with minimal configuration and zero coding. For more information on SSB, see https://aws.amazon.com/marketplace/pp/Cirrus-Link-Sparkplug-SiteWise-Bridge/B08L8KNCNN.
SSB software runs in an EC2 instance which is running in AWS cloud. SSB software comprises MQTT client which subscribes to the AWS IoT Core broker to receive Universal Wellpad Controller gateway data. When SSB receives Universal Wellpad Controller gateway data it creates and update resources (Assests, Models) in AWS Sitewise. In AWS Sitewise, user can monitor Universal Wellpad Controller gateway data. For more information about Sitewise, see https://aws.amazon.com/iot-sitewise/.
13.2 Installation and Configuration
13.2.1 SSB installation and cloud infrastructure provisioning
We need to provision the AWS infrastructure and install SSB in the EC2 instance. Use the following link to carry out SSB installation and cloud infrastructure provisioning procedure -
Note that there are two different delivery methods for SSB installation. Select ‘CloudFormation Template’ as delivery method.
After the process completes the result will be ‘CREATE_COMPLETE.’
13.2.2 AWS IoT core broker and SSB configuration
A ‘thing’ needs to be created in AWS IoT core which represent the IoT edge device i.e., Universal Wellpad Controller gateway. SSB needs to be configured so that it can access IoT core to fetch the Universal Wellpad Controller gateway data. Please use the link to carry out the complete AWS IoT Core broker and SSB configuration procedure -
https://docs.chariot.io/display/CLD80/SSB%3A+Quickstart.
Alternate link to get an insight on the creation of a ‘thing’ in AWS IoT core - https://docs.aws.amazon.com/iot/latest/developerguide/iot-moisture-create-thing.html
13.2.3 Universal Wellpad Controller gateway configuration
SSL certificates which were created in STEP 2 during the creation of a ‘thing’ in AWS IoT core must be inputted while running the ‘01_pre-requisites.sh’ script.
*$sudo ./02_provision_UWC.sh --deployMode=dev --recipe=3 --isTLS=yes --caFile="/<path>/root-ca.crt" --crtFile="/<path> /client.crt" --keyFile="/<path> client.key" --brokerAddr="azeyj7bji4ghe-ats.iot.us-west-2.amazonaws.com" --brokerPort=8883 --qos=1*
Deploy Mode ‘dev’ or ‘Prod’.
Select Recipe as 3 to have Sparkplug Container deployed.
Make sure the ‘isTLS’ argument is set to ‘yes’
Configure the ‘caFile’ argument with the path of the CA certificate obtained from AWS IoT core.
Configure the ‘crtFile’ argument with the path of the client certificate obtained from AWS IoT core.
Configure the ‘keyFile’ argument with the path of the client private key obtained from AWS IoT core
‘brokerPort’ should be set to ‘8883.’
‘brokerAddr’ should be set to the custom endpoint of the AWS IoT core. Use the following couple of steps to fetch the custom endpoint.
Go to the IoT core console. Select the ‘Settings’ tab in the left pane.
Custom endpoint which represents the IoT core broker address. This address needs to be configured in the ‘brokerAddr’ argument as shown in below image.
13.3 Monitor Data on Cloud
The data can be monitored on the AWS Sitewise service. Complete the following steps to monitor data on cloud:
Scroll to the AWS Sitewise service in the AWS management console as shown in the following image
Go to the ‘Models’ tab. The attribute ‘Protocol’ of a model can be seen. Refer to the following
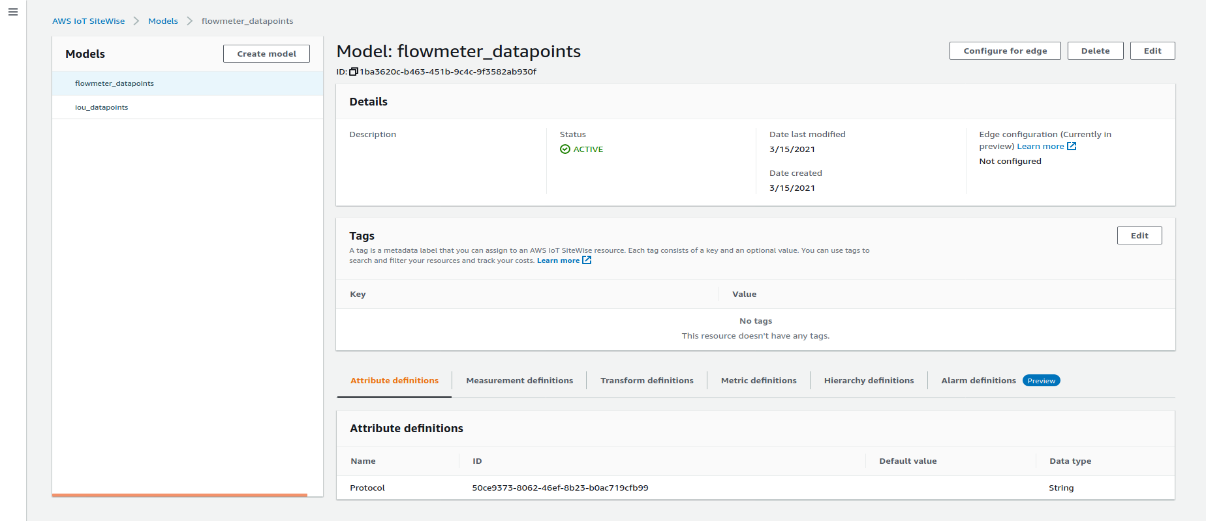
The ‘measurement’ parameter representing a data point can be seen in the model. Refer to the following
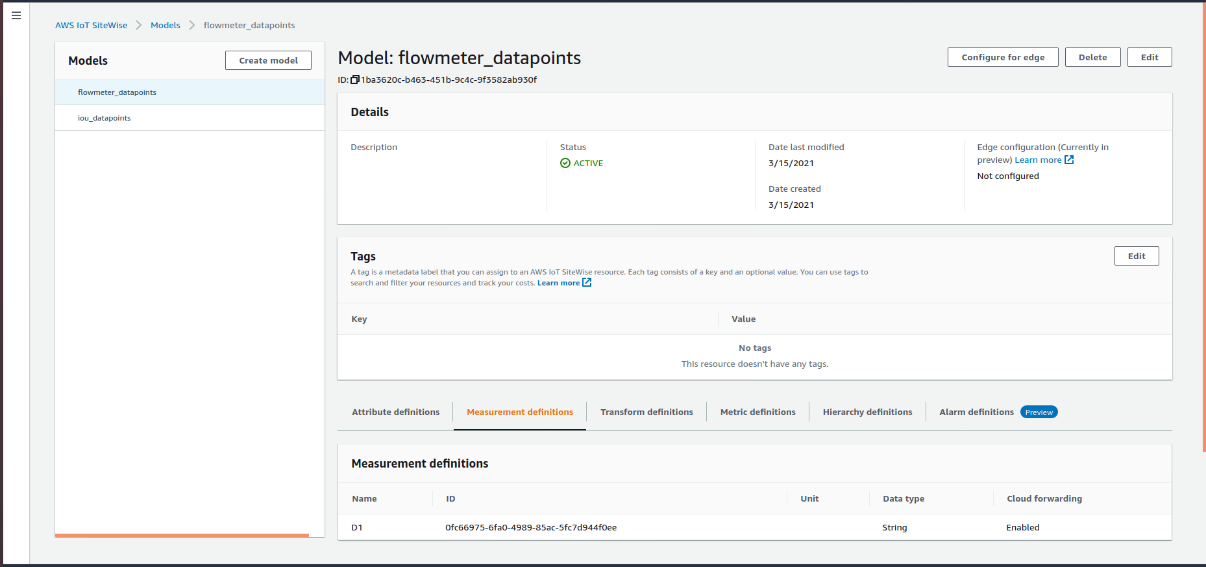
Navigate to the ‘Assets’ tab. The attribute ‘Protocol’ can be seen with its defined value. Refer to the following
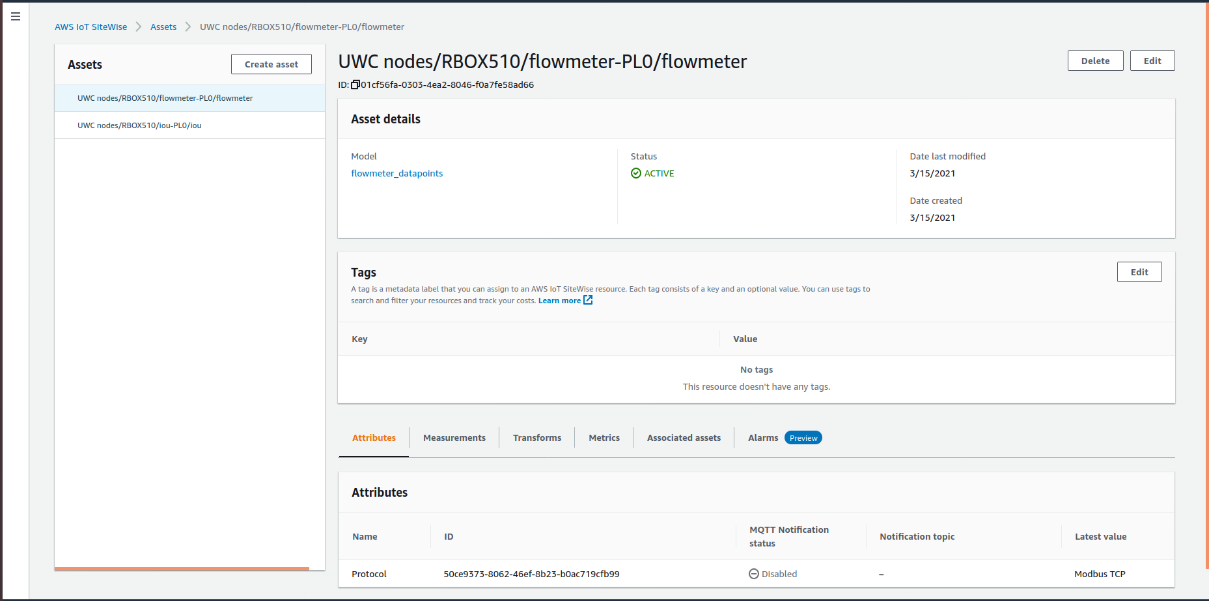
The ‘measurement’ parameter representing a data point can be seen in the asset with its defined value. Refer to the following
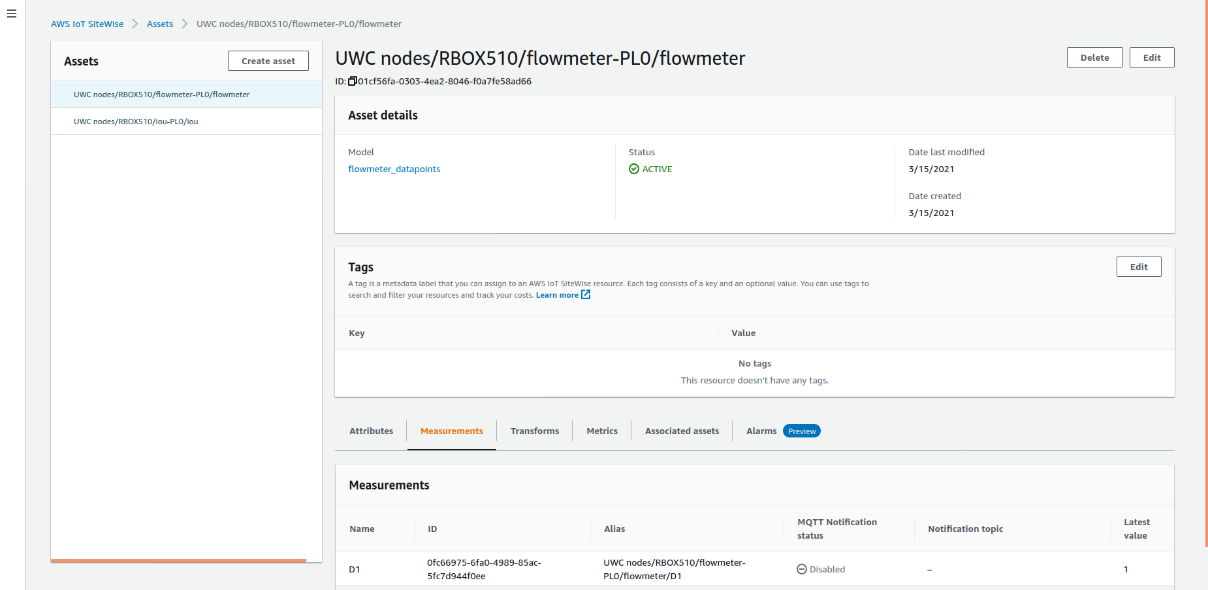
Note
You should delete old assets and models from AWS IoT to ensure the updated assets and models get reflected. Duplicate assets and models will not be refreshed.
14.0 RT Patch (Optional)
14.1 Steps to Choose and Apply RT Kernel Patch
The latest version of Universal Wellpad Controller has been tested with Ubuntu 20.04.2 LTS. Check the kernel version corresponding to the Ubuntu OS version being used and map it with the correct RT kernel patch.
Use the links below to map the kernel version with theRT kernel patch:
14.2 Install Prerequisites
Install all the prerequisites using the following command:
$ sudo apt-get install -y libncurses-dev libssl-dev bison flex build-essential wget libelf-dev dwarves
Note
You will see a prompt to update the package runtime. Click Yes.
14.3 Steps To Apply RT Kernel Patch
Recommended OS and kernel version: Linux OS version: Ubuntu 20.04.2 LTS Kernel version: 5.4.0-80
Make a working directory on the system:
$ mkdir ~/kernel && cd ~/kernel
Download kernel in ~kernel directory created in step 1
Download kernel manually
Link for download - https://www.kernel.org/pub/linux/kernel/
This will download kernel manually or use following command to download it from command line inside current directory.
Recommendation: Please get Linux kernel version 5.4.129
Download preempt RT patch
Link for download - https://www.kernel.org/pub/linux/kernel/projects/rt/ this will download patch manually or use following command to download it from command line inside current directory.
$ wget https://mirrors.edge.kernel.org/pub/linux/kernel/projects/rt/5.4/older/patch-5.4.129-rt61.patch.gz
Recommendation: RT patch kernel version recommendation is to get PREEMPT_RT version 5.4.129-rt61
Untar the kernel using the following command:
$ tar -xzvf linux-5.4.129.tar.gz
Patch the kernel
$ cd linux-5.4.129
$ gzip -cd ../patch-5.4.129-rt61.patch.gz | patch -p1 --verbose
Launch the graphical UI for setting configurations
The next command launches a graphical menu in the terminal to generate the .config file.
$ make menuconfig
Graphical UI is shown below:

Figure 11.1: Main launching screen
Select the preemption model as Basic RT using tab key on keyboard
Select and enter on “General setup” option.
Select and Enter on Preemption Model (Voluntary Kernel Preemption (Desktop))
Select and Enter on Preemption Model (Fully Preemptible Kernel (RT))
After successful selection click on save button and then come back to main page using Esc button on keyboard.
Refer the following screen capture for more details
Figure 11.2: Preemption Model (Fully Preemptible Kernel (RT))
Figure 11.3 Fully Preemption Kernel (RT)
Save and exit
To save the current setting click Save and then, click Exit to exit the UI.
To compile the kernel, execute the following commands:
Note
In a production environment, the system key management infrastructure will be provided for the end user to ensure the patched Kernel works with the Secure Boot flow. When Secure Boot is not used, comment out the CONFIG_SYSTEM_TRUSTED_KEYS and CONFIG_MODULE_SIG_KEY lines from the /boot/config<version> file. Failure to do one of these two things will cause the following make commands to fail.
After commenting the above keys, If make -j20 failed with “certs” error, remove “linux-5.4.129” directory and continue the installation from step 3.
$ make -j20
$ sudo make INSTALL_MOD_STRIP=1 modules_install -j20
$ sudo make install -j20
Verify that initrd.img-‘5.4.129-rt61, vmlinuz-‘5.4.129-rt61, and config-‘5.4.129-rt61 are generated in the /boot directory and update the grub.
$ cd /boot
$ ls
$ sudo update-grub
Verify that there is a menu entry containing the text “menu entry ‘Ubuntu, with Linux ‘5.4.129-rt61” in the /boot/grub/grub.cfg file
To change default kernel in grub, edit the GRUB_DEFAULT value in /etc/default/grub to your desired kernel.
Note
0 is the 1st menu entry
Reboot and verify using command
$ sudo reboot
Once the system reboots, open the terminal and use uname -a to check the kernel version
Command will show below output for successfully applied RT patch – Linux ubuntu 5.4.129-rt61 #1 SMP PREEMPT RT Tue Mar 24 17:15:47 IST 2020 x86_64 x86_64 x86_64 GNU/Linux
15.0 Appendix for UWC files/folders
UWC contains these folders/files:
# |
Folder/File |
Destination |
Comment |
|---|---|---|---|
1 |
Modbus-master |
IEdgeInsights/uwc |
Modbus application folder used to install TCP/RTU container |
2 |
MQTT |
IEdgeInsights/uwc |
It is used to install the Mosquito (MQTT) container |
3 |
mqtt-bridge |
IEdgeInsights/uwc |
Mqtt-bridge application folder used to install mqtt-bridge container |
4 |
sparkplug-bridge |
IEdgeInsights/uwc |
Sparkplug-Bridge application folder used to install Sparkplug-Bridge container. |
5 |
kpi-tactic |
IEdgeInsights/uwc |
kpi-tactic application folder used to install kpi-app container. |
6 |
Vendor_Apps |
IEdgeInsights/uwc |
Vendor_Apps application folder used to install Sample publisher and subscriber. |
7 |
Others |
/opt/intel/eii/uwc_data/ |
All yml files containing device, datapoints, and configurations. It also contains Global_config.yml |
8 |
uwc_common |
IEdgeInsights/uwc |
Common libraries installation docker file and source code. |
9 |
build_scripts |
IEdgeInsights/uwc |
All installation scripts are kept here |
10 |
uwc_recipes |
IEdgeInsights/uwc |
This directory contains recipe files |
Intel® In-Band Manageability
Intel® In-Band Manageability enables software updates and deployment from cloud to device. This includes the following:
Software over the air (SOTA)
Firmware update over the air (FOTA)
Application over the air (AOTA) and system operations
The AOTA update enables cloud to edge manageability of application services running on the Edge Insights for Industrial (EII) enabled systems through Intel® In-Band Manageability.
For EII use case, only the AOTA features from Intel® In-Band Manageability are validated and supported through Azure* and ThingsBoard* cloud-based management front end services. Based on your preference, you can use Azure* or ThingsBoard*.
The following sections provide information about:
Installing Intel® In-Band Manageability
Setting up Azure* and ThingsBoard*
Establishing connectivity with the target systems
Updating applications on systems
Installing Intel® In-Band Manageability
Refer the steps from edge_insights_industrial/Edge_Insights_for_Industrial_<version>/manageability/README.md to install the Intel® In-Band Manageability and configure Azure* and Thingsboard* servers with EII.
Known Issues
Thingsboard* Server fails to connect with devices after provisioning TC. Thingsboard* server setup fails on fresh server.
Edge Insights for Industrial Uninstaller
The EII uninstaller script automatically removes all the EII Docker configuration that is installed on a system. The uninstaller performs the following tasks:
Stops and removes all the EII running and stopped containers.
Removes all the EII docker volumes.
Removes all the EII docker images [Optional]
Removes all EII install directory
To run the uninstaller script, run the following command from the [WORKDIR]/IEdgeInsights/build/ directory:
./eii_uninstaller.sh -h
Usage: ./eii_uninstaller.sh [-h] [-d] This script uninstalls the previous EII version. Where:
-h show the help -d triggers the deletion of docker images (by default it will not trigger)
Example:
Run the following command to delete the EII containers and volumes:
./eii_uninstaller.sh
Run the following command to delete the EII containers, volumes, and images:
EII_VERSION=3.0.0 ./eii_uninstaller.sh -d
The commands in the example will delete the version 2.4 EII containers, volumes, and all the docker images.
Debug
Debugging Options
Perform the following steps for debugging:
Run the following command to check if all the EII images are built successfully:
docker images|grep ia
You can view all the dependency containers and the EII containers that are up and running. Run the following command to check if all containers are running:
docker psEnsure that the proxy settings are correctly configured and restart the docker service if the build fails due to no internet connectivity.
Run the
docker pscommand to list all the enabled containers that are included in thedocker-compose.ymlfile.From video ingestion>video analytics>visualizer, check if the default video pipeline with EII is working fine.
The
/opt/intel/eiiroot directory gets created - This is the installation path for EII:data/- stores the backup data for persistent imagestore and influxdbsockets/- stores the IPC ZMQ socket files
The following table displays useful docker-compose and docker commands:
Command |
Description |
|---|---|
|
Builds all the service containers |
|
Builds a single service container |
|
Stops and removes the service containers |
|
Brings up the service containers by picking the changes done in the |
|
Checks the running containers |
|
Checks the running and stopped containers |
|
Stops all the containers |
|
Removes all the containers. This is useful when you run into issue of already container is in use |
|
For more information refer to the docker documentation |
|
For more information refer to the docker documentation |
|
For more information refer to the docker documentation |
|
To run the docker images separately or one by one. For example: |
|
Use this command to check logs of containers |
|
To see all the docker-compose service container logs at once |
Troubleshooting Guide
For any troubleshooting tips related to the EII configuration and installation, refer to the TROUBLESHOOT.md guide.
Since all the EII services are independently buildable and deployable when we do a
docker-compose upfor all EII microservices, the order in which they come up is not controlled. Having said this, there are many publishers and subscriber microservices in EII middleware, hence, its possible that publisher comes up before subscriber or there can be a slght time overlap wherein the subscriber can come up just after publisher comes up. Hence, in these scenarios its a possibility that the data published by publisher can be lost as subscriber would not be up to receive all the published data. So, the solution to address this is to restart the publisher after we are sure that the intended subscriber is up.If you observe any issues with the installation of the Python package, then as a workaround you can manually install the Python packages by running the following commands:
cd [WORKDIR]/IEdgeInsights/build # Install requirements for builder.py pip3 install -r requirements.txt
Note: To avoid any changes to the Python installation on the system, it is recommended that you use a Python virtual environment to install the Python packages. For more information on setting up and using the Python virtual environment, refer to Python virtual environment.