Open EII Tools
Open Edge Insights for Industrial (Open EII) stack has the following set of tools that also run as containers:
Time Series Benchmarking Tool
Note
In this document, you will find labels of ‘Edge Insights for Industrial (EII)’ for file names, paths, code snippets, and so on. Consider the references of EII as Open Edge Insights for Industrial (Open EII). This is due to the product name change of EII as Open EII.
These scripts are designed to automate the running of benchmarking tests and the collection of the performance data. This performance data includes the Average Stats of each data stream, and also the CPU %, Memory %, and Memory read/write bandwidth.
The Processor Counter Monitor (PCM) is required for measuring memory read/write bandwidth, which can be downloaded and built here
If you do not have PCM on your system, those values will be blank in the output.ppc
Steps for running a benchmarking test case:
Configure TimeSeriesProfiler config.json(
[WORK_DIR]/IEdgeInsights/tools/TimeSeriesProfiler/config.json) file to recieve rfc_results according to TimeSeriesProfiler README.md.Change the
commandoption in the MQTT publisher docker-compose.yml([WORK_DIR]/IEdgeInsights/tools/mqtt/publisher/docker-compose.yml) to:["--topic", "test/rfc_data", "--json", "./json_files/*.json", "--streams", "<streams>"]
For example:
["--topic", "test/rfc_data", "--json", "./json_files/*.json", "--streams", "1"]
Run execute test to execute the time series test case.Before running following command, make sure that “export_to_csv” value in TimeSeriesProfiler config.json(
[WORK_DIR]/IEdgeInsights/tools/TimeSeriesProfiler/config.json) is set to “True”:USAGE: ./execute_test.sh TEST_DIR STREAMS INTERVAL PORT SLEEP PCM_HOME [EII_HOME] WHERE: TEST_DIR - Directory containing services.yml and config files for influx, telegraf, and kapacitor STREAMS - The number of streams (1, 2, 4, 8, 16) INTERVAL - Time interval to publish the data in secs PORT - MQTT broker port SLEEP - The number of seconds to wait after the containers come up PCM_HOME - The absolute path to the PCM repository where pcm.x is built [EII_HOME] - [Optional] Absolute path to Open EII home directory, if running from a non-default location
For example:
sudo -E ./execute_test.sh $PWD/samples 2 1 1883 10 /opt/intel/pcm /home/intel/IEdgeInsights
The execution log, performance logs, and the output.ppc will be saved in TEST_DIR/output/< timestamp >/ so that the same test case can be ran multiple times without overwriting the output. You can see if the test ocurred any errors in the execution.log, and you can see the results of a successful test in output.ppc
The timeseries profiler output file (named “avg_latency_Results.csv” ) will be stored in TEST_DIR/output/< timestamp >/.
Note
While running benchmarking tool with more than two streams, run **MQTT broker([WORK_DIR]/IEdgeInsights/tools/mqtt/broker/)* manually with multiple instances and add the mqtt consumers in **Telegraf telegraf.conf([WORK_DIR]/IEdgeInsights/Telegraf/config/Telegraf/config.json)* with ‘n’ number of streams based on the use case.
Video Benchmarking Tool
Note
In this document, you will find labels of ‘Edge Insights for Industrial (EII)’ for file names, paths, code snippets, and so on. Consider the references of EII as Open Edge Insights for Industrial (Open EII). This is due to the product name change of EII as Open EII.
These scripts are designed to automate the running of benchmarking tests and the collection of the performance data. This performance data includes the FPS of each video stream, and also the CPU %, Memory %, and Memory Read/Write bandwidth.
The Processor Counter Monitor (PCM) is required for measuring memory read/write bandwidth, which can be downloaded and built here.
If you do not have PCM on your system, those columns will be blank in the output.csv.
Refer README-Using-video-accelerators([WORK_DIR]/IEdgeInsights#using-video-accelerators-in-ingestionanalytics-containers) for using video accelerators and follow the required prereqisities to work with GPU, MYRIAD, and HDDL devices.
Note
To run the gstreamer pipeline mentioned in sample_test/config.json(
[WORK_DIR]/IEdgeInsights/tools/Benchmarking/video-benchmarking-tool/sample_test/config.json), copy the required model files to[WORKDIR]/IEdgeInsights/VideoIngestion/models. For more information, refer to the models-readme.In IPC mode, for accelerators:
MYRIAD,GPUand USB 3.0 Vision cameras, adduser: rootin VideoProfiler-docker-compose.yml([WORK_DIR]/IEdgeInsights/tools/VideoProfiler/docker-compose.yml) as the subscriber needs to run asrootif the publisher is running asroot.For
GPUdevice there is an initial delay while the model is compiled and loaded. This can affect the first benchmarking results especially on low stream count. This will be reduced on subsequent runs using kernel caching. To ensure that the kernel cache files are created, removeread_only: truein thedocker-compose.ymlfile for VI so that files can be generated.The
docker-compose.ymlfiles of VI and VideoProfiler is picked from their respective repos. So any changes needed should be applied in their respective repos.
Steps for running a benchmarking test case:
#. Ensure the VideoProfiler requirements are installed by following the README at README. #.
Start the RTSP server on a sepereate system on the network:
./stream_rtsp.sh <number-of-streams> <starting-port-number> <bitrate> <width> <height> <framerate>For example:
./stream_rtsp.sh 16 8554 4096 1920 1080 30
Run execute_test.sh with the desired benchmarking config:
USAGE:
    ./execute_test.sh TEST_DIR STREAMS SLEEP PCM_HOME [EII_HOME]

WHERE:
    TEST_DIR  - The absolute path to directory containing services.yml for the services to be tested, and the config.json and docker-compose.yml for VI and VA if applicable.
    STREAMS   - The number of streams (1, 2, 4, 8, 16)
    SLEEP     - The number of seconds to wait after the containers come up
    PCM_HOME  - The absolute path to the PCM repository where pcm.x is built
    EII_HOME - [Optional] The absolute path to Open EII home directory, if running from a non-default location
For example:
sudo -E ./execute_test.sh $PWD/sample_test 16 60 /opt/intel/pcm /home/intel/IEdgeInsights
The execution log, performance logs, and the output.csv will be saved in
TEST_DIR/< timestamp >/so that the same test case can be run multiple times without overwriting the output. If any errors occur during the test, you can view its details from the execution.log file. For successful test, you can view the results in final_output.csv.
DiscoverHistory Tool
You can get history metadata and images from the InfluxDB and ImageStore containers using the DiscoverHistory tool.
Note
In this document, you will find labels of ‘Edge Insights for Industrial (EII)’ for file names, paths, code snippets, and so on. Consider the references of EII as Open Edge Insights for Industrial (Open EII). This is due to the product name change of EII as Open EII.
Build and Run the DiscoverHistory Tool
This section provides information for building and running DiscoverHistory tool in various modes such as the PROD mode and the DEV mode. To run the DiscoverHistory tool base images should be on the same node. Ensure that on the node where the DiscoverHistory tool is running, the ia_common and ia_eiibase base images are also available. For scenario, where Open EII and DiscoverHistory tool are not running on the same node, then you must build the base images, ia_common and ia_eiibase.
Prerequisites
As a prerequisite to run the DiscoverHistory tool, a set of config, interfaces, public, and private keys should be present in etcd. To meet the prerequisite, ensure that an entry for the DiscoverHistory tool with its relative path from the [WORK_DIR]/IEdgeInsights] directory is set in the video-streaming-storage.yml file in the [WORK_DIR]/IEdgeInsights/build/usecases/ directory. For more information, see the following example:
AppContexts:
- VideoIngestion
- VideoAnalytics
- Visualizer
- WebVisualizer
- tools/DiscoverHistory
- ImageStore
- InfluxDBConnector
Run the DiscoverHistory tool in the PROD mode
After completing the prerequisites, perform the following steps to run the DiscoverHistory tool in the PROD mode:
Open the
config.jsonfile.
#. Enter the query for InfluxDB. #.
Run the following command to generate the new
docker-compose.ymlthat includes DiscoverHistory:python3 builder.py -f usecases/video-streaming-storage.yml
Provision, build, and run the DiscoverHistory tool along with the Open EII video-streaming-storage recipe or stack. For more information, refer to the Open EII README.
Check if the
imagestoreandinfluxdbconnectorservices are running.Locate the
dataand theframesdirectories from the following path:/opt/intel/eii/tools_output. ..Note: The
framesdirectory will be created only ifimg_handleis part of the select statement.
#. Use the ETCDUI to change the query in the configuration. #.
Run the following command to start container with new configuration:
docker restart ia_discover_history
Run the DiscoverHistory tool in the DEV Mode
After completing the prerequisites, perform the following steps to run the DiscoverHistory tool in the DEV mode:
Open the [.env] file from the
[WORK_DIR]/IEdgeInsights/builddirectory.Set the
DEV_MODEvariable astrue.
Run the DiscoverHistory tool in the zmq_ipc Mode
After completing the prerequisites, to run the DiscoverHistory tool in the zmq_ipc mode, modify the interface section of the config.json file as follows:
{
    "type": "zmq_ipc",
    "EndPoint": "/EII/sockets"
}
Sample Select Queries
The following table shows the samples for the select queries and its details:
Note
Include the following parameters in the query to get the good and the bad frames:
The following examples shows how to include the parameters:
“select img_handle, defects, encoding_level, encoding_type, height, width, channel from camera1_stream_results order by desc limit 10”
“select * from camera1_stream_results order by desc limit 10”
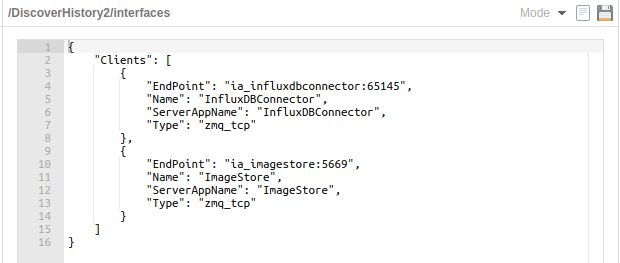
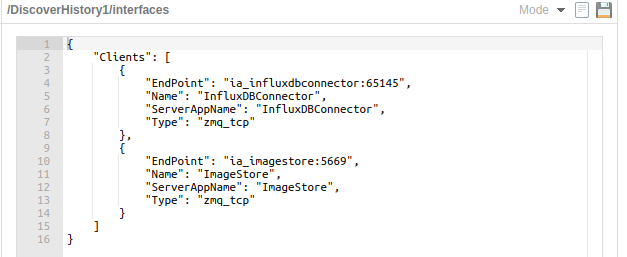
Multi-instance Feature Support for the Builder Script with the DiscoverHistory Tool
The multi-instance feature support of Builder works only for the video pipeline ([WORK_DIR]/IEdgeInsights/build/usecase/video-streaming.yml). For more details, refer to the Open EII core Readme
In the following example you can view how to change the configuration to use the builder.py script -v 2 feature with 2 instances of the DiscoverHistory tool enabled:
EmbPublisher
Note
In this document, you will find labels of ‘Edge Insights for Industrial (EII)’ for file names, paths, code snippets, and so on. Consider the references of EII as Open Edge Insights for Industrial (Open EII). This is due to the product name change of EII as Open EII.
This tool acts as a brokered publisher of message bus.
Telegaf’s message bus input plugin acts as a subscriber to the Open EII broker.
How to Integrate this Tool with Video/Time Series Use Case
In the
time-series.yml/video-streaming.ymlfile, add theZmqBrokerandtools/EmbPublishercomponents.Use the modified
time-series.yml/video-streaming.ymlfile as an argument while generating the docker-compose.yml file using thebuilder.pyutility.Follow usual provisioning and starting process.
Configuration of the Tool
Let us look at the sample configuration
{
  "config": {
    "pub_name": "TestPub",
    "msg_file": "data1k.json",
    "iteration": 10,
    "interval": "5ms"
  },
  "interfaces": {
    "Publishers": [
      {
        "Name": "TestPub",
        "Type": "zmq_tcp",
        "AllowedClients": [
          "*"
        ],
        "EndPoint": "ia_zmq_broker:60514",
        "Topics": [
          "topic-pfx1",
          "topic-pfx2",
          "topic-pfx3",
          "topic-pfx4"
        ],
        "BrokerAppName" : "ZmqBroker",
        "brokered": true
      }
    ]
  }
}
-pub_name : The name of the publisher in the interface.
-topics: The name of the topics seperated by comma, for which publisher need to be started.
-msg_file : The file containing the JSON data, which represents the single data point (files should be kept into directory named ‘datafiles’).
-num_itr : The number of iterations
-int_btw_itr: The interval between any two iterations
Running EmbPublisher in IPC mode
User needs to modify interface section of config.json(``[WORK_DIR]/IEdgeInsights/tools/EmbPublisher/config.json``) to run in IPC mode as following:
"interfaces": {
  "Publishers": [
    {
      "Name": "TestPub",
      "Type": "zmq_ipc",
      "AllowedClients": [
        "*"
      ],
      "EndPoint": {
              "SocketDir": "/EII/sockets",
              "SocketFile": "frontend-socket"
          },
      "Topics": [
        "topic-pfx1",
        "topic-pfx2",
        "topic-pfx3",
        "topic-pfx4"
      ],
      "BrokerAppName" : "ZmqBroker",
      "brokered": true
    }
  ]
}
EmbSubscriber
EmbSubscriber subscribes message coming from a publisher.It subscribes to messagebus topic to get the data.
Note
In this document, you will find labels of ‘Edge Insights for Industrial (EII)’ for file names, paths, code snippets, and so on. Consider the references of EII as Open Edge Insights for Industrial (Open EII). This is due to the product name change of EII as Open EII.
Prerequisites
- EmbSubscriber expects a set of config, interfaces & public private keys to be present in ETCD as a prerequisite.
To achieve this, please ensure an entry for EmbSubscriber with its relative path from IEdgeInsights(
[WORK_DIR]/IEdgeInsights/) directory is set in the time-series.yml file present in build/usecases([WORK_DIR]/IEdgeInsights/tree/master/build/usecases) directory. An example has been provided below:
AppName:
- Grafana
- InfluxDBConnector
- Kapacitor
- Telegraf
- tools/EmbSubscriber
With the above pre-requisite done, please run the below command:
cd [WORKDIR]/IEdgeInsights/build
python3 builder.py -f usecases/time-series.yml
Running EmbSubscriber
Refer to the ../README.md to provision, build and run the tool along with the Open EII Time Series recipe or stack.
Run EmbSubscriber in IPC mode
To run EmbSubscriber in the IPC mode, modify the interfaces section of the config.json([WORK_DIR]/IEdgeInsights/tools/EmbSubscriber/config.json) file as follows:
{
  "config": {},
  "interfaces": {
    "Subscribers": [
      {
        "Name": "TestSub",
        "PublisherAppName": "Telegraf",
        "Type": "zmq_ipc",
        "EndPoint": {
                  "SocketDir": "/EII/sockets",
                  "SocketFile": "telegraf-out"
         },
        "Topics": [
          "*"
        ]
      }
    ]
  }
}
GigEConfig Tool
The GigEConfig tool can be used to read the Basler Camera properties from the Pylon Feature Stream file and construct a gstreamer pipeline with the required camera features. The gstreamer pipeline which is generated by the tool can either be printed on the console or can be used to update the config manager storage.
Note
This tool has been verified with Basler camera only as the PFS file which is a pre-requisite to this tool is specific to Basler Pylon Camera Software Suite.
In this document, you will find labels of ‘Edge Insights for Industrial (EII)’ for file names, paths, code snippets, and so on. Consider the references of EII as Open Edge Insights for Industrial (Open EII). This is due to the product name change of EII as Open EII.
Generating PFS (Pylon Feature Stream) File
In order to execute this tool user has to provide a PFS file as a prerequisite. The PFS file can be generated using the Pylon Viwer application for the respective Basler camera by following below steps:-
- Refer the below link to install and get an overview of the Pylon Viewer application:-
Execute the below steps to run the Pylon Viewer application:
sudo <PATH>/pylon5/bin/PylonViewerAppUsing the Pylon Viewer application follow below steps to gererate a PFS file for the required camera.
Select the required camera and open it
Configure the camera with the required settings if required
On the application toolbar, select Camera tab-> Save Features..
Close the camera
Note
In case one needs to configure the camera using Pylon Viewer make sure the device is not used by another application as it can be controlled by only one application at a time.
Running GigEConfig Tool
Before executing the tool make sure following steps are executed:-
Refer GenICam GigE Camera(
[WORK_DIR]/IEdgeInsights/VideoIngestion#genicam-gige-or-usb3-camera) and follow the pre-requisities required to work with Basler GenICam GigE cameras and make sure provisioning is done by referring Configmgr ReadmeSource build/.env to get all the required ENVs
set -a
source [WORKDIR]/IEdgeInsights/build/.env
set +a
Install the dependencies:
Note: It is highly recommended that you use a python virtual environment to install the python packages, so that the system python installation doesn’t get altered. Details on setting up and using python virtual environment can be found here: https://www.geeksforgeeks.org/python-virtual-environment/
cd [WORKDIR]/IEdgeInsights/tools/GigEConfig
pip3 install -r requirements.txt
If using GigE tool in PROD mode, make sure to set required permissions to certificates.
sudo chmod -R 755 [WORKDIR]/IEdgeInsights/build/Certificates
Note: This step is required everytime provisioning is done. Caution: This step will make the certs insecure. Please do not do it on a production machine.
Usage of GigEConfig tool
Script Usage:
python3 GigEConfig.py --help


python3 GigEConfig.py [-h] --pfs_file PFS_FILE [--etcd] [--ca_cert CA_CERT]
                      [--root_key ROOT_KEY] [--root_cert ROOT_CERT]
                      [--app_name APP_NAME] [-host HOSTNAME] [-port PORT]
Tool for updating pipeline according to user requirement
optional arguments:
- -h, --help
show this help message and exit
—pfs_file PFS_FILE, -f PFS_FILE To process pfs file genrated by PylonViwerApp (default: None)
- --etcd, -e
Set for updating etcd config (default: False)
—ca_cert CA_CERT, -c CA_CERT Provide path of ca_certificate.pem (default: None)
- –root_key ROOT_KEY, -r_k ROOT_KEY
Provide path of root_client_key.pem (default: None)
—root_cert ROOT_CERT, -r_c ROOT_CERT Provide path of root_client_certificate.pem (default: None)
- --app_name APP_NAME, -a APP_NAME
For providing appname of VideoIngestion instance (default: VideoIngestion)
—hostname HOSTNAME, -host HOSTNAME Etcd host IP (default: localhost)
- –port PORT, -port PORT
Etcd host port (default: 2379)
config.json([WORK_DIR]/IEdgeInsights/tools/GigEConfig/config.json) consist of mapping between the PFS file elements and the camera properties. The pipeline constructed will only consist of the elements specified in it.
The user needs to provide following elements:-
pipeline_constant: Specify the constant gstreamer element of pipeline.
plugin_name: The name of the gstreamer source plugin used
device_serial_number: Serial number of the device to which the plugin needs to connect to:
plugin_properties: Properties to be integrated in pipeline, The keys in here are mapped to respective gstreamer properties
Execution of GigEConfig
The tool can be executed in following manner :-
cd [WORKDIR]/IEdgeInsights/tools/GigEConfig
Modify config.json(
[WORK_DIR]/IEdgeInsights/tools/GigEConfig/config.json) based on the requirementsIn case etcd configuration needs to be updated.
For DEV Mode
python3 GigEConfig.py --pfs_file <path to pylon's pfs file> -e
For PROD Mode
Before running in PROD mode please change the permissions of the certificates i.e :-
sudo chmod 755 -R [WORDK_DIR]/IEdgeInsights/build/Certificates
python3 GigEConfig.py -f <path to pylon's pfs file> -c [WORK_DIR]/IEdgeInsights/build/Certificates/rootca/cacert.pem -r_k [WORK_DIR]/IEdgeInsights/build/Certificates/root/root_client_key.pem -r_c [WORK_DIR]/IEdgeInsights/build/Certificates/root/root_client_certificate.pem -e
In case only pipeline needs to be printed.
python3 GigEConfig.py --pfs_file <path to pylon's pfs file>
In case host or port is needed to be specified for etcd.
For DEV Mode
python3 GigEConfig.py --pfs_file <path to pylon's pfs file> -e -host <etcd_host> -port <etcd_port>
For PROD Mode
Before running in PROD mode please change the permissions of the certificates i.e :
sudo chmod 755 -R [WORDK_DIR]/IEdgeInsights/build/Certificates
python3 GigEConfig.py -f <path to pylon's pfs file> -c [WORK_DIR]/IEdgeInsights/build/Certificates/rootca/cacert.pem -r_k [WORK_DIR]/IEdgeInsights/build/Certificates/root/root_client_key.pem -r_c [WORK_DIR]/IEdgeInsights/build/Certificates/root/root_client_certificate.pem -e -host <etcd_host> -port <etcd_port>
HttpTestServer
HttpTestServer runs a simple HTTP test server with security being optional.
Note
In this document, you will find labels of ‘Edge Insights for Industrial (EII)’ for file names, paths, code snippets, and so on. Consider the references of EII as Open Edge Insights for Industrial (Open EII). This is due to the product name change of EII as Open EII.
Prerequisites for running the HttpTestServer
To install Open EII libs on bare-metal, follow the README of eii_libs_installer.
Generate the certificates required to run the Http Test Server using the following command:
./generate_testserver_cert.sh test-server-ipUpdate no_proxy to connect to RestDataExport server
export no_proxy=$no_proxy,<HOST_IP>
Starting HttpTestServer
Run the following command to start the HttpTestServer:
cd IEdgeInsights/tools/HttpTestServer
go run TestServer.go --dev_mode false --host <address of test server> --port <port of test server> --rdehost <address of Rest Data Export server> --rdeport <port of Rest Data Export server>
   Eg: go run TestServer.go --dev_mode false --host=0.0.0.0 --port=8082 --rdehost=localhost --rdeport=8087

For Helm Usecases
Eg: go run TestServer.go --dev_mode false --host=0.0.0.0 --port=8082 --rdehost=<maser_node_ip>--rdeport=31509 --client_ca_path ../../build/helm-eii/eii-deploy/Certificates/rootca/cacert.pem
Note: server_cert.pem is valid for 365 days from the day of generation
In PROD mode, you might see intermediate logs like this:
http: TLS handshake error from 127.0.0.1:51732: EOF
These logs are because of RestExport trying to check if the server is present by pinging it without using any certs and can be ignored.
Develop Python User Defined Functions using Jupyter Notebook
Jupyter Notebook is an open-source web application that allows you to create and share documents that contain live code, equations, visualizations, and narrative text. Jupyter Notebook supports the latest versions of the browsers such as Chrome, Firefox, Safari, Opera, and Edge. Some of the uses of Jupyter Notebook include:
Data cleaning and transformation
Numerical simulation
Statistical modeling
Data visualization
Machine learning, and so on.
The web-based IDE of Jupyter Notebook allows you to develop User Defined Functions (UDFs) in Python. This tool provides an interface for you to interact with the Jupyter Notebook to write, edit, experiment, and create python UDFs. It works along with the jupyter_connector([WORK_DIR]/IEdgeInsights/common/video/tree/master/udfs/python/jupyter_connector.py) UDF for enabling the IDE for UDF development. You can use a web browser or Visual Studio Code (VS Code) to use Jupyter Notebook for UDF development.
For more information on how to write and modify an OpenCV UDF, refer to the opencv_udf_template.ipynb([WORK_DIR]/IEdgeInsights/tools/JupyterNotebook/opencv_udf_template.ipynb) (sample OpenCV UDF template). This sample UDF uses the OpenCV APIs to write a sample text on the frames, which can be visualized in the Visualizer display. While using this UDF, ensure that the encoding is disabled. Enabling the encoding will automatically remove the text that is added to the frames.
Note
Custom UDFs like the
GVASafetyGearIngestionare specific to certain use cases only. Do not use Jupyter Notebook with these custom UDFs. Instead, modify theVideoIngestionpipeline to use theGVA ingestorpipeline and modify the config to use thejupyter_connector UDF.In this document, you will find labels of ‘Edge Insights for Industrial (EII)’ for filenames, paths, code snippets, and so on. Consider the references of EII as Open Edge Insights for Industrial (Open EII). This is due to the product name change of EII as Open EII.
Prerequisites for using Jupyter Notebooks
The following are the prerequisites for using Jupyter Notebook to develop UDFs:
Jupyter Notebook requires a set of configs, interfaces, and the public and private keys to be present in etcd. To meet this prerequisite, ensure that an entry for Jupyter Notebook with its relative path from the
IEdgeInsights([WORK_DIR]/IEdgeInsights/)directory is set in any of the.ymlfiles present in the build/usecases([WORK_DIR]/IEdgeInsights/tree/master/build/usecases) directory.Refer the following example to add the entry in the video-streaming.yml(
[WORK_DIR]/IEdgeInsights/tree/master/build/usecases/video-streaming.yml) file.AppContexts: ---snip--- - tools/JupyterNotebook
Ensure that in the config of either
VideoIngestionorVideoAnalyticsthe jupyter_connector([WORK_DIR]/IEdgeInsights/common/video/tree/master/udfs/python/jupyter_connector.py) UDF is enabled to connect to Jupyter Notebook. Refer the following example to connectVideoIngestiontoJupyterNotebook. Change the config in the config.json([WORK_DIR]/IEdgeInsights/VideoIngestion/config.json):{ "config": { "encoding": { "type": "jpeg", "level": 95 }, "ingestor": { "type": "opencv", "pipeline": "./test_videos/pcb_d2000.avi", "loop_video": true, "queue_size": 10, "poll_interval": 0.2 }, "sw_trigger": { "init_state": "running" }, "max_workers":4, "udfs": [{ "name": "jupyter_connector", "type": "python", "param1": 1, "param2": 2.0, "param3": "str" }] } }
Run Jupyter Notebook from web browsers
Perform the following steps to develop UDF using the Jupyter Notebook from a web browser:
In the terminal, run the following command:
python3 builder.py -f usecases/video-streaming.yml
Refer the IEdgeInsights/README.md to provision, build and run the tool along with the Open EII recipe or stack.
To see the logs, run the following command:
docker logs -f ia_jupyter_notebook
In the browser, from the logs, copy and paste the URL along with the token. Refer to the following sample URL:
http://127.0.0.1:8888/?token=5839f4d1425ecf4f4d0dd5971d1d61b7019ff2700804b973Note:
If you are accessing the server remotely, replace the IP address ‘127.0.0.1’ with the host IP.
After launching the
Jupyter Notebookservice in a browser, from the list of available files, run the main.ipynb([WORK_DIR]/IEdgeInsights/tools/JupyterNotebook/main.ipynb) file. Ensure that thePython3.8kernel is selected.If required, to experiment and test the UDF, you can modify and rerun the process method of the udf_template.ipynb(
[WORK_DIR]/IEdgeInsights/tools/JupyterNotebook/udf_template.ipynb) file.To send parameters to the custom UDF, add them in the
jupyter_connectorUDF config provided to eitherVideoIngestionorVideoAnalytics. You can access the parameters in the udf_template.ipynb([WORK_DIR]/IEdgeInsights/tools/JupyterNotebook/udf_template.ipynb) constructor in theudf_configparameter.Note:
The
udf_configparameter is a dictionary (dict) that contains all these parameters. For more information, refer to the sample UDF from the pcb_filter.py([WORK_DIR]/IEdgeInsights/common/video/udfs/python/pcb/pcb_filter.py) file. After modifying or creating a new UDF, runmain.ipynband then, restart VideoIngestion or VideoAnalytics with which you have enabled theJupyter Notebookservice.To save or export the UDF, click Download as and then, select (.py).
Note:
To use the downloaded UDF, place it in the ../../common/video/udfs/python(
[WORK_DIR]/IEdgeInsights/common/video/udfs/python) directory or integrate it with theCustom UDFs.
Run Jupyter Notebook using Visual Studio Code
Perform the following steps to use Visual Studio Code (VS Code) to develop a UDF:
In the terminal, run the following command:
python3 builder.py -f usecases/video-streaming.yml
Refer the IEdgeInsights/README.md to provision, build and run the tool along with the Open EII recipe or stack.
To see the logs, run the following command:
docker logs -f ia_jupyter_notebook
In the consolidated
build/docker-compose.ymlfile, for theia_jupyter_notebookservice, changeread_only: truetoread_only: false.Run the
docker-compose up -d ia_jupyter_notebookcommand.In VS Code, install the
Remote - Containersextension.Using the shortcut key combination
(Ctrl+Shift+P)access the Command Palette.In the Command Palette, run the
Remote-Containers: Attach to Running Containercommand.Select the
ia_jupyter_notebookcontainer.In the
ia_jupyter_notebookcontainer, install thePythonandJupyterextensions.In the Command Palette, run the
Jupyter: Specify Jupyter server for connectionscommand.Note: If the
Jupyter: Specify Jupyter server for connectionscommand is not available, then run theJupyter: Specify local or remote Jupyter server for connectionscommand.Choose
Existing: Specify the URI of an existing serverwhen prompted to select how to connect to Jupyter Notebook.Enter the server’s URI (hostname) with the authentication token (included with a ?token= URL parameter), when prompted to enter the URI of a Jupyter server. Refer to the sample URL mentioned in the previous procedure.
Open the
/home/eiiuserfolder to update the respective udf_template and the main notebooks and rerun.To create a Jupyter notebook, run the
Jupyter: Create New Jupyter Notebookcommand in the Command Palette.To save the UDF, go to More Actions (…), and then, select Export.
When prompted Export As, select Python Script.
From the File menu, click Save As.
Select Show Local.
Enter the name and save the file.
Note
You cannot upload files to the workspace in VS Code due to the limitation with the Jupyter Notebook plugin. To use this functionality, access the Jupyter notebook through a web browser.
MQTT publisher
MQTT publisher is a tool to help publish the sample sensor data.
Note
In this document, you will find labels of ‘Edge Insights for Industrial (EII)’ for file names, paths, code snippets, and so on. Consider the references of EII as Open Edge Insights for Industrial (Open EII). This is due to the product name change of EII as Open EII.
Usage
Note
This assumes you have already installed and configured Docker.
Provision, build and bring up the Open EII stack by following in the steps in the README.
Note By default the tool publishes temperature data. If the user wants to publish other data, he/she needs to modify the command option in “ia_mqtt_publisher” service in build/docker-compose.yml([WORK_DIR]/IEdgeInsights/build/docker-compose.yml) accordingly and recreate the container using docker-compose up -d command from build directory.
To publish temperature data to default topic, command option by default is set to:
["--temperature", "10:30"]
To publish temperature and humidity data together, change the command option to:
["--temperature", "10:30", "--humidity", "10:30", "--topic_humd", "temperature/simulated/0"]
To publish multiple sensor data(temperature, pressure, humidity) to default topic(temperature/simulated/0, pressure/simulated/0, humidity/simulated/0),change the command option to:
["--temperature", "10:30", "--pressure", "10:30", "--humidity", "10:30"]
To publish differnt topic instead of default topic, change the command option to:
["--temperature", "10:30", "--pressure", "10:30", "--humidity", "10:30", "--topic_temp", <temperature topic>, "--topic_pres", <pressure topic>, "--topic_humd", <humidity topic>]
It is possible to publish more than one sensor data into single topic, in that case, same topic name needs to be given for that sensor data.
For publishing data from csv row by row, change the command option to:
["--csv", "demo_datafile.csv", "--sampling_rate", "10", "--subsample", "1"]
To publish JSON files (to test random forest UDF), change the command option to:
["--topic", "test/rfc_data", "--json", "./json_files/*.json", "--streams", "1"]
If one wish to see the messages going over MQTT, run the subscriber with the following command:
   ./subscriber.sh <port>

Example:
If Broker runs at port 1883, to run subscriber use following command:
./subscriber.sh 1883
NodeRedHttpClientApp
This Node-RED in-built http node based client App acts as client for the Open EII RestDataExport and brings the Open EII Classifier data to Node-RED ecosystem.
Configure NodeRed
Node-RED provides various options to install and set up Node-RED in your environment. For more information on installation and setup, refer to the Node-RED documenation.
Note
For quick setup, install using docker
docker run -it -p 1880:1880 --name myNodeRed nodered/node-red
Getting Open EII UDF Classifier results data to Node-RED Environment Using Node-RED HTTPClient
Note
: RestDataExport should be running already as a prerequisite.
Refer to the RestDataExport Readme([WORK_DIR]/IEdgeInsights/RestDataExport)
Drag the
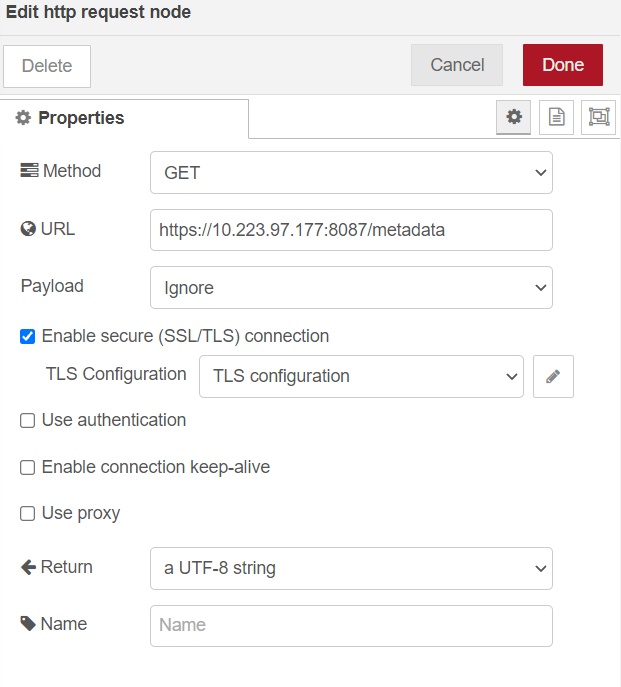
http requestnode of Node-RED’s default nodes to your existing workflow.
Update the
propertiesof node as follows:For
DEV mode:Refer to the dialog properties for setting up the
DEVmode in the Node-Red dashboard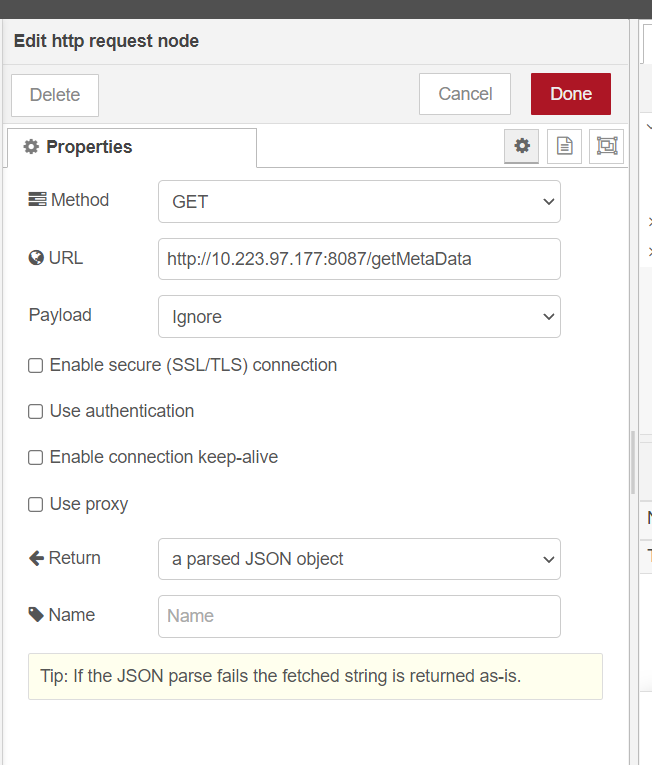
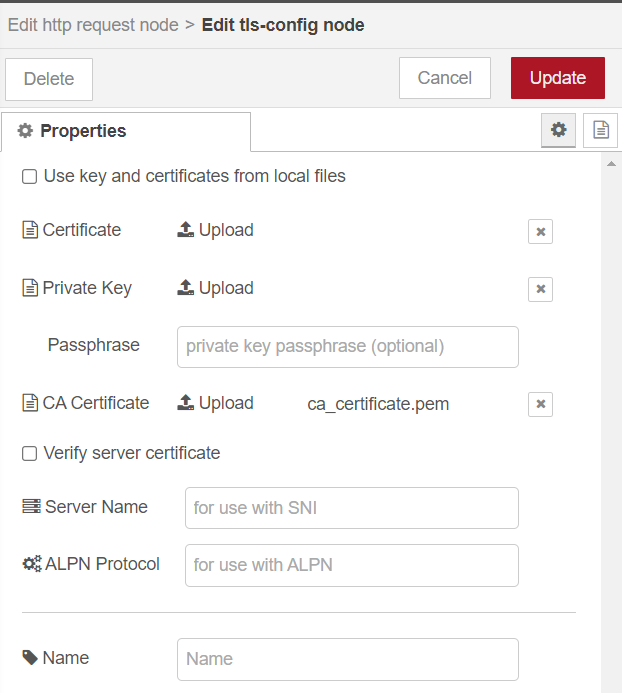
For
PROD Mode:Refer to the dialog properties for setting up the
PRODmode in the Node-RED dashboard
For Prod Mode TLS
ca_cert.pemimport. Note: Thisca_cert.pemwill be part of the Open EII certificate bundle. Refer the[WORKDIR]/IEdgeInsights/build/Certificates/directory.
Note:
For the
DEVmode, do not enable or attach the certificates.Update the
IPaddress as per theRestDataExportmodule running machine IP.For more details on Node-RED’s
http requestmodule, refer to Http requset.


Sample Workflow
The attached workflow document is sample workflow by updating the RestDataExport IP Address in the http request module,
Import the Sample Workflow flows.json(
[WORK_DIR]/IEdgeInsights/tools/NodeRedHttpClientApp/flows.json) file to NodeRed dashboard usingmenuicon in top right corner as follows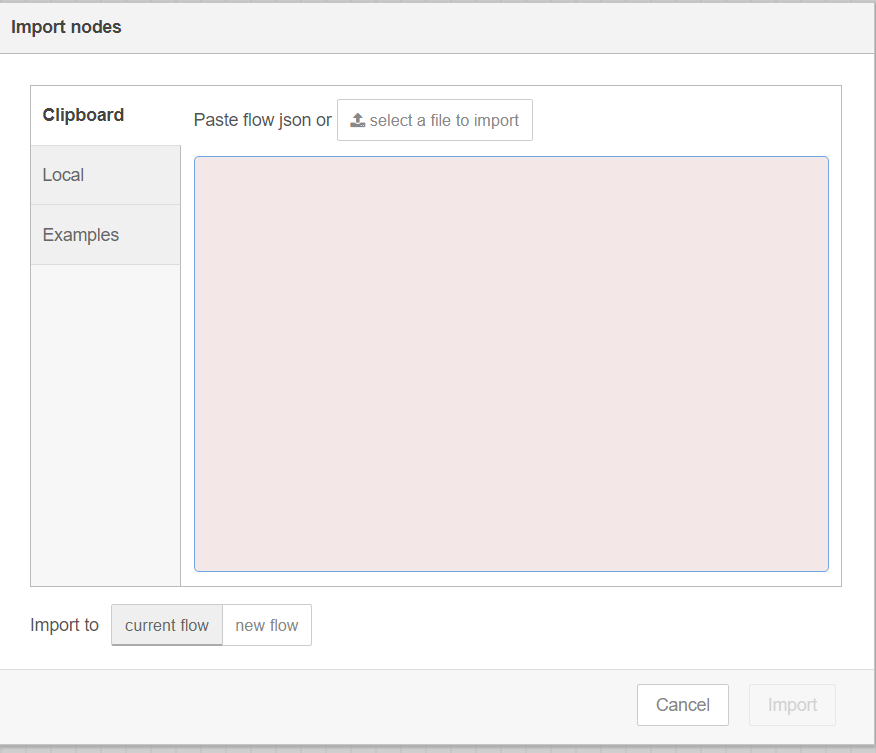
Click
ImportUpdate the
URLofhttp requestnode withRestDataExportmodule running the machine IP AddressNote:
For detail, refer to [import export] (https://nodered.org/docs/user-guide/editor/workspace/import-export)
The classifier results will be logged in the debug window.

Software Trigger Utility for VideoIngestion Module
This utility is used for invoking various software trigger features of VideoIngestion. The currently supported triggers to VideoIngestion module are:
START INGESTION - to start the ingestor
STOP_INGESTION - to stop the ingestor
SNAPSHOT - to get frame snapshot which feeds one only frame into the video data pipeline.
Note
In this document, you will find labels of ‘Edge Insights for Industrial (EII)’ for file names, paths, code snippets, and so on. Consider the references of EII as Open Edge Insights for Industrial (Open EII). This is due to the product name change of EII as Open EII.
Software Trigger Utilily Prerequisites
SWTriggerUtility expects a set of config, interfaces & public private keys to be present in ETCD as a prerequisite.
To achieve this, please ensure an entry for SWTriggerUtility with its relative path from IEdgeInsights([WORK_DIR]/IEdgeInsights/) directory is set in any of the .yml files present in build/usecases([WORK_DIR]/IEdgeInsights/tree/master/build/usecases) directory.
An example has been provided below to add the entry in video-streaming.yml(
[WORK_DIR]/IEdgeInsights/build/usecases/video-streaming.yml)AppContexts: ---snip--- - tools/SWTriggerUtility
Configuration file
config.json is the configuration file used for sw_trigger_utility.
Field |
Meaning |
Type of the value |
|---|---|---|
|
|
|
|
|
|
|
|
|
Note
When working with GigE cameras which requires
network_mode: host, update theEndPointkey of SWTriggerUtility interface in config.json([WORK_DIR]/IEdgeInsights/tools/SWTriggerUtility/config.json) to have the host system IP instead of the service name of the server.
Eg. In order to connect to ia_video_ingestion service which is configured with GigE camera refer the below EndPoint change in the SWTriggerUtility interface:
{
    "Clients": [
        {
            "EndPoint": "<HOST_SYSTEM_IP>:64013",
            "Name": "default",
            "ServerAppName": "VideoIngestion",
            "Type": "zmq_tcp"
        }
    ]
}
In case one needs to change the values in config.json(
[WORK_DIR]/IEdgeInsights/tools/SWTriggerUtility/config.json), then ensure to re-run the steps mentioned in pre-requisites section to see the updated changes are getting appliedORone can choose to update the config key of SWTriggerUtility app via ETCD UI and then restart the application.
This utility works in both dev & prod mode. As a pre-requisite make sure to turn ON the flag corresponding to “dev_mode” to true/false in the config.json file.
Running Software Trigger Utility
Open EII services can be running in prod or dev mode by setting
DEV_MODEvalue accordingly in build/.env([WORK_DIR]/IEdgeInsights/build/.env)Execute builder.py script:
cd [WORKDIR]/IEdgeInsights/build/
python3 builder.py -f usecases/video-streaming.yml
NOTE: The same yml file to which the SWTriggerUtility entry was added in pre-requisites has to be selected while running pre-requisites
Usage of Software Trigger Utility
By default the SW Trigger Utility container will not execute anything and one needs to interact with the running container to generate the trigger commands. Make sure VI service is up and ready to process the commands from the utility.
Software trigger utility can be used in following ways:
“START INGESTION” -> “Allows ingestion for default time (120 seconds being default)” -> “STOP INGESTION”
cd [WORKDIR]/IEdgeInsights/build
docker exec ia_sw_trigger_utility ./sw_trigger_utility
“START INGESTION” -> “Allows ingestion for user defined time (configurable time in seconds)” -> “STOP INGESTION”
cd [WORKDIR]/IEdgeInsights/build
docker exec ia_sw_trigger_utility ./sw_trigger_utility 300
Note: In the above example, VideoIngestion starts then does ingestion for 300 seconds then stops ingestion after 300 seconds & cycle repeats for number of cycles configured in the config.json.
Selectively send START_INGESTION software trigger:
cd [WORKDIR]/IEdgeInsights/build
docker exec ia_sw_trigger_utility ./sw_trigger_utility START_INGESTION
Selectively send STOP_INGESTION software trigger:
cd [WORKDIR]/IEdgeInsights/build
docker exec ia_sw_trigger_utility ./sw_trigger_utility STOP_INGESTION
Selectively send SNAPSHOT software trigger:
cd [WORKDIR]/IEdgeInsights/build
docker exec ia_sw_trigger_utility ./sw_trigger_utility SNAPSHOT
Note
If duplicate START_INGESTION or STOP_INGESTION sw_triggers are sent by client by mistake then the VI is capable of catching these duplicates & responds back to client conveying that duplicate triggers were sent & requets to send proper sw_triggers.
In order to send SNAPSHOT trigger, ensure that the ingestion is stopped. In case START_INGESTION trigger is sent previously then stop the ingestion using the STOP_INGESTION trigger.
Open EII TimeSeriesProfiler
#. This module calculates the SPS(samples per second) of any Open EII time-series modules based on the stream published by that respective module. #.
This module calculates the average e2e time for every sample data to process and it’s breakup. The e2e time end to end time required for a metric from mqtt-publisher to TimeSeriesProfiler (mqtt-publisher->telegraf->influx->kapacitor->influx->influxdbconnector-> TimeSeriesProfiler)
Note: In this document, you will find labels of ‘Edge Insights for Industrial (EII)’ for file names, paths, code snippets, and so on. Consider the references of EII as Open Edge Insights for Industrial (Open EII). This is due to the product name change of EII as Open EII.
Prerequisites
TimeSeriesProfiler expects a set of config, interfaces & public private keys to be present in ETCD as a prerequisite. To achieve this, please ensure an entry for TimeSeriesProfiler with its relative path from IEdgeInsights(
[WORK_DIR]/IEdgeInsights/) directory is set in the time-series.yml file present in build/usecases([WORK_DIR]/IEdgeInsights/tree/master/build/usecases) directory. An example has been provided below:AppContexts: - Grafana - InfluxDBConnector - Kapacitor - Telegraf - tools/TimeSeriesProfiler
With the above pre-requisite done, please run the below command:
python3 builder.py -f ./usecases/time-series.yml
Open EII TimeSeriesProfiler modes
By default the Open EII TimeSeriesProfiler supports two modes, which are ‘sps’ & ‘monitor’ mode.
SPS mode
Enabled by setting the ‘mode’ key in config(
[WORK_DIR]/IEdgeInsights/tools/TimeSeriesProfiler/config.json) to ‘sps’, this mode calculates the samples per second of any Open EII module by subscribing to that module’s respective stream."mode": "sps"
Monitor mode
Enabled by setting the ‘mode’ key in config(
[WORK_DIR]/IEdgeInsights/tools/TimeSeriesProfiler/config.json) to ‘monitor’, this mode calculates average & per sample statsRefer the below exmaple config where TimeSeriesProfiler is used in monitor mode.
    "config": {
    "mode": "monitor",
    "monitor_mode_settings": {
                                "display_metadata": false,
                                "per_sample_stats":false,
                                "avg_stats": true
                            },
    "total_number_of_samples" : 5,
    "export_to_csv" : false
}
"mode": "monitor"
The stats to be displayed by the tool in monitor_mode can be set in the monitor_mode_settings key of config.json(
[WORK_DIR]/IEdgeInsights/tools/TimeSeriesProfiler/config.json).‘display_metadata’: Displays the raw meta-data with timestamps associated with every sample.
‘per_sample_stats’: Continously displays the per sample metrics of every sample.
‘avg_stats’: Continously displays the average metrics of every sample.
Note
Prerequisite for running in profiling or monitor mode: Time series containers should be running with PROFILING_MODE set to true in .env(
[WORK_DIR]/IEdgeInsights/build/.env)For running TimeSeriesProfiler in SPS mode, it is recommended to keep PROFILING_MODE set to false in .env(
[WORK_DIR]/IEdgeInsights/build/.env) for better performance.
Open EII TimeSeriesProfiler configurations
total_number_of_samples
If mode is set to ‘sps’, the average SPS is calculated for the number of samples set by this variable. If mode is set to ‘monitor’, the average stats is calculated for the number of samples set by this variable. Setting it to (-1) will run the profiler forever unless terminated by stopping container TimeSeriesProfiler manually. total_number_of_samples should never be set as (-1) for ‘sps’ mode.
export_to_csv
Setting this switch to true exports csv files for the results obtained in TimeSeriesProfiler. For monitor_mode, runtime stats printed in the csv are based on the the following precdence: avg_stats, per_sample_stats, display_metadata.
Running TimeSeriesProfiler
Prerequisite:
Profiling UDF returns “ts_kapacitor_udf_entry” and “ts_kapacitor_udf_exit” timestamp.
These 2 as examples to refer:
profiling_udf.go(
[WORK_DIR]/IEdgeInsights/Kapacitor/udfs/profiling_udf.go)rfc_classifier.py(
[WORK_DIR]/IEdgeInsights/Kapacitor/udfs/rfc_classifier.py)
Additional: Adding timestamps in ingestion and UDFs:
In case user wants to enable his/her own ingestion and UDFs, timestamps need to be added to ingestion and UDFs modules respectively. The TS Profiler needs three timestamps.
#. “ts” timestamp which is to be filled by the ingestor (done by the mqtt-publisher app). #.
The udf to give “ts_kapacitor_udf_entry” and “ts_kapacitor_udf_exit” timestamps to profile the udf execution time.
ts_kapacitor_udf_entry : timestamp in UDF before execution of the of the algorithm
ts_kapacitor_udf_exit : timestamp in UDF after execution of the algorithm.
The sample profiling UDFs can be referred at profiling_udf.go(
[WORK_DIR]/IEdgeInsights/Kapacitor/udfs/profiling_udf.go) and rfc_classifier.py([WORK_DIR]/IEdgeInsights/Kapacitor/udfs/rfc_classifier.py).configuration required to run profiling_udf.go as profiling udf
In Kapacitor config.json(``[WORK_DIR]/IEdgeInsights/Kapacitor/config.json``) , update “task” key as below:
"task": [{
    "tick_script": "profiling_udf.tick",
    "task_name": "profiling_udf",
    "udfs": [{
       "type": "go",
       "name": "profiling_udf"
    }]
}]
In kapacitor.conf(``[WORK_DIR]/IEdgeInsights/Kapacitor/config/kapacitor.conf``) under udf section:
[udf.functions]
   [udf.functions.profiling_udf]
     socket = "/tmp/profiling_udf"
     timeout = "20s"
configuration required to run rfc_classifier.py as profiler udf In Kapacitor config.json(``[WORK_DIR]/IEdgeInsights/Kapacitor/config.json``) , update “task” key as below:
"task": [{
   {
    "tick_script": "rfc_task.tick",
    "task_name": "random_forest_sample"
    }
}]
In kapacitor.conf(``[WORK_DIR]/IEdgeInsights/Kapacitor/config/kapacitor.conf``) under udf section:
[udf.functions.rfc]
   prog = "python3.7"
   args = ["-u", "/EII/udfs/rfc_classifier.py"]
   timeout = "60s"
   [udf.functions.rfc.env]
      PYTHONPATH = "/EII/go/src/github.com/influxdata/kapacitor/udf/agent/py/"
keep config.json(``[WORK_DIR]/IEdgeInsights/tools/TimeSeriesProfiler/config.json``) file as following:
{
  "config": {
      "total_number_of_samples": 10,
      "export_to_csv": "False"
  },
  "interfaces": {
      "Subscribers": [
          {
              "Name": "default",
              "Type": "zmq_tcp",
              "EndPoint": "ia_influxdbconnector:65032",
              "PublisherAppName": "InfluxDBConnector",
              "Topics": [
                  "rfc_results"
              ]
          }
      ]
  }
}
In .env(
[WORK_DIR]/IEdgeInsights/build/.env): Set the profiling mode as true.
Set environment variables accordingly in config.json(
[WORK_DIR]/IEdgeInsights/tools/TimeSeriesProfiler/config.json)
#. Set the required output stream/streams and appropriate stream config in config.json([WORK_DIR]/IEdgeInsights/tools/TimeSeriesProfiler/config.json) file.
#.
To run this tool in IPC mode, User needs to modify subscribers interface section of config.json(``[WORK_DIR]/IEdgeInsights/tools/TimeSeriesProfiler/config.json``) as following
{
  "type": "zmq_ipc",
  "EndPoint": "/EII/sockets"
}
Refer README.md to provision, build and run the tool along with the Open EII time-series recipe/stack.
Run the following command to see the logs:
docker logs -f ia_timeseries_profiler
Open EII Video Profiler
This tool can be used to determine the complete metrics involved in the entire Video pipeline by measuring the time difference between every component of the pipeline and checking for Queue blockages at every component thereby determining the fast or slow components of the whole pipeline. It can also be used to calculate the FPS of any Open EII modules based on the stream published by that respective module.
Note
In this document, you will find labels of ‘Edge Insights for Industrial (EII)’ for file names, paths, code snippets, and so on. Consider the references of EII as Open Edge Insights for Industrial (Open EII). This is due to the product name change of EII as Open EII.
Open EII Video Profiler Prerequisites
- VideoProfiler expects a set of config, interfaces and public private keys to be present in ETCD as a prerequisite.
To achieve this, ensure an entry for VideoProfiler with its relative path from IEdgeInsights(
[WORK_DIR]/IEdgeInsights/) directory is set in any of the .yml files present in build/usecases([WORK_DIR]/IEdgeInsights/tree/master/build/usecases) directory. An example has been provided below:
AppContexts:
- VideoIngestion
- VideoAnalytics
- tools/VideoProfiler
With the above prerequisite done, run the below to command:
python3 builder.py -f usecases/video-streaming.yml
Open EII Video Profiler Modes
By default, the Open EII Video Profiler supports the FPS and the Monitor mode. The following are details for these modes:
FPS mode Enabled by setting the ‘mode’ key in config(
[WORK_DIR]/IEdgeInsights/tools/VideoProfiler/config.json) to ‘fps’, this mode calculates the frames per second of any Open EII module by subscribing to that module’s respective stream."mode": "fps"
Note: For running Video Profiler in the FPS mode, it is recommended to keep PROFILING_MODE set to false in .env(
[WORK_DIR]/IEdgeInsights/tree/master/build/.env) for better performance.Monitor mode Enabled by setting the ‘mode’ key in config(
[WORK_DIR]/IEdgeInsights/tools/VideoProfiler/config.json) to ‘monitor’, this mode calculates average & per frame stats for every frame while identifying if the frame was blocked at any queue of any module across the video pipeline thereby determining the fastest/slowest components in the pipeline. To be performant in profiling scenarios, VideoProfiler is enabled to work when subscribing only to a single topic in monitor mode.User must ensure that
ingestion_appnameandanalytics_appnamefields of themonitor_mode_settingsneed to be set accordingly for monitor mode.Refer the following example config where VideoProfiler is used in monitor mode to subscribe PySafetyGearAnalytics CustomUDF results.
    "config": {
    "mode": "monitor",
    "monitor_mode_settings": {
                                "ingestion_appname": "PySafetyGearIngestion",
                                "analytics_appname": "PySafetyGearAnalytics",
                                "display_metadata": false,
                                "per_frame_stats":false,
                                "avg_stats": true
                            },
    "total_number_of_frames" : 5,
    "export_to_csv" : false
}
"mode": "monitor"
The stats to be displayed by the tool in monitor_mode can be set in the monitor_mode_settings key of config.json([WORK_DIR]/IEdgeInsights/tools/VideoProfiler/config.json).
‘display_metadata’: Displays the raw meta-data with timestamps associated with every frame.
‘per_frame_stats’: Continously displays the per frame metrics of every frame.
‘avg_stats’: Continously displays the average metrics of every frame.
Note
As a prerequisite for running in profiling or monitor mode, VI/VA should be running with the PROFILING_MODE set to true in .env(
[WORK_DIR]/IEdgeInsights/tree/master/build/.env)It is mandatory to have a UDF for running in monitor mode. For instance GVASafetyGearIngestion does not have any udf(since it uses GVA elements) so it will not be supported in monitor mode. The workaround to use GVASafetyGearIngestion in monitor mode is to add dummy-udf in GVASafetyGearIngestion-config(
[WORK_DIR]/IEdgeInsights/CustomUdfs/GVASafetyGearIngestion/config.json).
Open EII Video Profiler Configurations
dev_mode
Setting this to false enables secure communication with the Open EII stack. User must ensure this switch is in sync with DEV_MODE in .env(
[WORK_DIR]/IEdgeInsights/tree/master/build/.env) With PROD mode enabled, the path for the certs mentioned in config([WORK_DIR]/IEdgeInsights/tools/VideoProfiler/config.json) can be changed by the user to point to the required certs.total_number_of_frames
If mode is set to ‘fps’, the average FPS is calculated for the number of frames set by this variable. If mode is set to ‘monitor’, the average stats is calculated for the number of frames set by this variable. Setting it to (-1) will run the profiler forever unless terminated by signal interrupts(‘Ctrl+C’). total_number_of_frames should never be set as (-1) for ‘fps’ mode.
export_to_csv
Setting this switch to true exports csv files for the results obtained in VideoProfiler. For monitor_mode, runtime stats printed in the csv are based on the the following precdence: avg_stats, per_frame_stats, display_metadata.
Run Video Profiler
Set environment variables accordingly in config.json(
[WORK_DIR]/IEdgeInsights/tools/VideoProfiler/config.json).Set the required output stream/streams and appropriate stream config in config.json(
[WORK_DIR]/IEdgeInsights/tools/VideoProfiler/config.json) file.If VideoProfiler is subscribing to multiple streams, ensure the AppName of VideoProfiler is added in the Clients list of all the publishers.
If using Video Profiler in IPC mode, make sure to set required permissions to socket file created in SOCKET_DIR in build/.env(
[WORK_DIR]/IEdgeInsights/build/.env).sudo chmod -R 777 /opt/intel/eii/sockets
Note:
This step is required everytime publisher is restarted in the IPC mode.
Caution: This step will make the streams insecure. Do not do it on a production machine.
Refer the below VideoProfiler interface example to subscribe to PyMultiClassificationIngestion CustomUDF results in the FPS mode.
"/VideoProfiler/interfaces": {
       "Subscribers": [
           {
               "EndPoint": "/EII/sockets",
               "Name": "default",
               "PublisherAppName": "PyMultiClassificationIngestion",
               "Topics": [
                   "py_multi_classification_results_stream"
               ],
               "Type": "zmq_ipc"
           }
       ]
   },
If running VideoProfiler with helm usecase or trying to subscribe to any external publishers outside the Open EII network, ensure the correct IP of publisher has been provided in the interfaces section in config(
[WORK_DIR]/IEdgeInsights/tools/VideoProfiler/config.json) and correct ETCD host & port are set in environment for ETCD_ENDPOINT & ETCD_HOST.For example, for helm use case, since the ETCD_HOST and ETCD_PORT are different, run the commands mentioned below wit the required HOST IP:
export ETCD_HOST="<HOST IP>"
export ETCD_ENDPOINT="<HOST IP>:32379"
Refer provision/README.md to provision, build and run the tool along with the Open EII video-streaming recipe/stack.
Run the following command to see the logs:
docker logs -f ia_video_profiler
The runtime stats of Video Profiler if enabled with export_to_csv switch can be found at video_profiler_runtime_stats(
[WORK_DIR]/IEdgeInsights/tools/VideoProfiler/video_profiler_runtime_stats.csv)Note:
poll_intervaloption in the VideoIngestion config([WORK_DIR]/IEdgeInsights/VideoIngestion/config.json) sets the delay(in seconds)to be induced after every consecutive frame is read by the opencv ingestor. Not setting it will ingest frames without any delay.
videorateelement in the VideoIngestion config([WORK_DIR]/IEdgeInsights/VideoIngestion/config.json) can be used to modify theingestion rate for gstreamer ingestor. More info available at README.
ZMQ_RECV_HWMoption shall set the high water mark for inbound messages on the subscriber socket.The high water is a hard limit on the maximum number of outstanding messages ZeroMQ shall queue in memory for any single peer that the specified socket is communicating with. If this limit has been reached, the socket shall enter an exeptional state and drop incoming messages.
- In case of running Video Profiler for GVA use case we do not display the stats of the algo running with GVA since no
UDFs are used.
- The rate at which the UDFs process the frames can be measured using the FPS UDF and ingestion rate can be monitored accordingly.
In case multiple UDFs are used, the FPS UDF is required to be added as the last UDF.
In case running this tool with VI and VA in two different nodes, same time needs to be set in both the nodes.
Run VideoProfiler in Helm Use Case
For running VideoProfiler in helm use case to subscribe to either VideoIngestion/VideoAnalytics or any other Open EII service, the etcd endpoint, volume mount for helm certs and service endpoints are to be updated.
For connecting to the etcd server running in helm environment, the endpoint and required volume mounts should be modified in the following manner in environment and volumes section of docker-compose.yml([WORK_DIR]/IEdgeInsights/tools/VideoProfiler/docker-compose.yml):
ia_video_profiler:
  depends_on:
    - ia_common
  ...
  environment:
  ...
    ETCD_HOST: ${ETCD_HOST}
    ETCD_CLIENT_PORT: ${ETCD_CLIENT_PORT}
    # Update this variable referring
    # for helm use case
    ETCD_ENDPOINT: <HOST_IP>:32379
    CONFIGMGR_CERT: "/run/secrets/VideoProfiler/VideoProfiler_client_certificate.pem"
    CONFIGMGR_KEY: "/run/secrets/VideoProfiler/VideoProfiler_client_key.pem"
    CONFIGMGR_CACERT: "/run/secrets/rootca/cacert.pem"
  ...
  volumes:
    - "${EII_INSTALL_PATH}/tools_output:/app/out"
    - "${EII_INSTALL_PATH}/sockets:${SOCKET_DIR}"
    - ./helm-eii/eii-deploy/Certificates/rootca:/run/secrets/rootca
    - ./helm-eii/eii-deploy/Certificates/VideoProfiler:/run/secrets/VideoProfiler
For connecting to any service running in helm usecase, the container IP associated with the specific service should be updated in the Endpoint section in VideoProfiler config([WORK_DIR]/IEdgeInsights/tools/VideoProfiler/config.json):
The IP associated with the service container can be obtained by checking the container pod IP using docker inspect. Assuming we are connecting to VideoAnalytics service, the command to be run would be:
docker inspect <VIDEOANALYTICS CONTAINER ID> | grep VIDEOANALYTICS
The output of the above command consists the IP of the VideoAnalytics container that can be updated in VideoProfiler config using EtcdUI:
"VIDEOANALYTICS_SERVICE_HOST=10.99.204.80"
The config can be updated with the obtained container IP in the following way:
{
    "interfaces": {
        "Subscribers": [
            {
                "Name": "default",
                "Type": "zmq_tcp",
                "EndPoint": "10.99.204.80:65013",
                "PublisherAppName": "VideoAnalytics",
                "Topics": [
                    "camera1_stream_results"
                ]
            }
        ]
    }
}
Optimize Open EII Video Pipeline by Analysing Video Profiler Results
VI ingestor/UDF input queue is blocked, consider reducing ingestion rate.
If this log is displayed by the Video Profiler tool, it indicates that the ingestion rate is too high or the VideoIngestion UDFs are slow and causing latency throughout the pipeline. As per the log suggests, the user can increase the poll_interval to a optimum value to reduce the blockage of VideoIngestion ingestor queue thereby optimizing the video pipeline in case using the opencv ingestor. if Gstreamer ingestor is used, the videorate option can be optimized by following the README.
VA subs/UDF input queue is blocked, consider reducing ZMQ_RECV_HWM value or reducing ingestion rate.
If this log is displayed by the Video Profiler tool, it indicates that the VideoAnalytics UDFs are slow and causing latency throughout the pipeline. As per the log suggests, the user can consider reducing ZMQ_RECV_HWM to an optimum value to free the VideoAnalytics UDF input/subscriber queue by dropping incoming frames or reducing the ingestion rate to a required value.
UDF VI output queue blocked.
If this log is displayed by the Video Profiler tool, it indicates that the VI to VA messagebus transfer is delayed.
User can consider reducing the ingestion rate to a required value.
User can increase ZMQ_RECV_HWM to an optimum value so as to not drop the frames when the queue is full or switching to IPC mode of communication.
UDF VA output queue blocked.
If this log is displayed by the Video Profiler tool, it indicates that the VA to VideoProfiler messagebus transfer is delayed.
User can consider reducing the ingestion rate to a required value.
User can increase ZMQ_RECV_HWM to an optimum value so as to not drop the frames when the queue is full or switching to IPC mode of communication.
Benchmarking with Multi-instance Config
Open EII supports multi-instance config generation for benchmarking purposes. This can be acheived by running the builder.py(
[WORK_DIR]/IEdgeInsights/build/builder.py) with certain parameters, please refer to the Multi-instance Config Generation section of Open EII Preeequisites in the README for more details.For running VideoProfiler for multiple streams, run the builder with the -v flag provided the pre-requisites mentioned above are done. The following is an example for generating 6 streams config:
python3 builder.py -f usecases/video-streaming.yml -v 6
Note
For multi-instance monitor mode use case, ensure only VideoIngestion & VideoAnalytics are used as AppName for Publishers.
Running VideoProfiler with CustomUDFs for monitor mode is supported for single stream only. If required for multiple streams, ensure VideoIngestion & VideoAnalytics are used as AppName.
In IPC mode, for accelerators:
MYRIAD,GPU, and USB 3.0 Vision cameras, adduser: rootin VideoProfiler-docker-compose.yml([WORK_DIR]/IEdgeInsights/docker-compose.yml) as the subscriber needs to run asrootif the publisher is running asroot.