Working with Timeseries Data
Telegraf
The EII comes with timeseries data ingesting capabilities using Telegraf, which runs as a separate container ingesting data into InfluxDB*. The configuration of Telegraf is available in [WORK_DIR]/IEdgeInsights/Telegraf/config/telegraf.conf. This configuration may need to be modified to select the right input plugin. The example used in the EII v2.x release is a sample temperature sensor application that sends temperature data over MQTT as a Telegraf plugin. The topic name and type of data is configured to work with this specific device. This will need to be updated in the configuration file for a different factory use case.
There is a Telegraf entry timeseries script that contacts the EII ConfigMgr and obtains the credentials for connecting to InfluxDB. The entry point script then starts Telegraf after updating the InfluxDB credentials as environment variables.
Purpose of Telegraf
Telegraf is one of the data entry points for IEdgeInsights. It supports many input plugins, which can be used for point data ingestion. In the above example, the MQTT input plugin of Telegraf is used. And below is the configuration of the plugin.
```
# # Read metrics from MQTT topic(s)
[[inputs.mqtt_consumer]]
#   ## MQTT broker URLs to be used. The format should be scheme://host:port,
#   ## schema can be tcp, ssl, or ws.
    servers = ["tcp://localhost:1883"]
#
#   ## MQTT QoS, must be 0, 1, or 2
#   qos = 0
#   ## Connection timeout for initial connection in seconds
#   connection_timeout = "30s"
#
#   ## Topics to subscribe to
    topics = [
    "temperature/simulated/0",
    ]
    name_override = "point_data"
    data_format = "json"
#
#   # if true, messages that can't be delivered while the subscriber is offline
#   # will be delivered when it comes back (such as on service restart).
#   # NOTE: if true, client_id MUST be set
    persistent_session = false
#   # If empty, a random client ID will be generated.
    client_id = ""
#
#   ## username and password to connect MQTT server.
    username = ""
    password = ""
```
The production mode Telegraf configuration file is Telegraf/config/telegraf.conf and in developer mode, the configuration file is Telegraf/config/telegraf_devmode.conf.
For more information on the supported input and output plugins please refer https://docs.influxdata.com/telegraf/v1.10/plugins/
Optional: Adding multiple telegraf instances
User can add multiple instances of Telegarf. For that user needs to add additional environment variable named ‘ConfigInstance’ in docker-compose.yml file. For every additional telegraf instance, there has to be additional compose section in the docker-compose.yml file.
The configuration for every instance has to be in the telegraf image. The standard to be followed is described as below.
For instance named $ConfigInstance the telegraf configuration has to be kept in the repository at config/$ConfigInstance/$ConfigInstance.conf (for production mode) and config/$ConfigInstance/$ConfigInstance_devmode.conf (for developer mode).
The same files will be available inside the respective container at ‘/etc/Telegraf/$ConfigInstance/$ConfigInstance.conf’ (for production mode) ‘/etc/Telegraf/$ConfigInstance/$ConfigInstance_devmode.conf’ (for developer mode)
Let’s have some of the examples.
Example1: For $ConfigInstance = ‘Telegraf1’
The location of the Telegraf configuration would be config/Telegraf1/Telegraf1.conf (for production mode) and config/Telegraf1/Telegraf1_devmode.conf (for developer mode)
The additional docker compose section which has to be manually added in the file ‘docker-compose.yml’ would be
ia_telegraf1:
  depends_on:
    - ia_common
  build:
    context: $PWD/../Telegraf
    dockerfile: $PWD/../Telegraf/Dockerfile
    args:
      EII_VERSION: ${EII_VERSION}
      EII_UID: ${EII_UID}
      EII_USER_NAME: ${EII_USER_NAME}
      TELEGRAF_SOURCE_TAG: ${TELEGRAF_SOURCE_TAG}
      TELEGRAF_GO_VERSION: ${TELEGRAF_GO_VERSION}
      UBUNTU_IMAGE_VERSION: ${UBUNTU_IMAGE_VERSION}
      CMAKE_INSTALL_PREFIX: ${EII_INSTALL_PATH}
  container_name: ia_telegraf1
  hostname: ia_telegraf1
  image: ${DOCKER_REGISTRY}ia_telegraf:${EII_VERSION}
  restart: unless-stopped
  ipc: "none"
  security_opt:
  - no-new-privileges
  read_only: true
  healthcheck:
    test: ["CMD-SHELL", "exit", "0"]
    interval: 5m
  environment:
    AppName: "Telegraf"
    ConfigInstance: "Telegraf1"
    CertType: "pem,zmq"
    DEV_MODE: ${DEV_MODE}
    no_proxy: "${ETCD_HOST},ia_influxdbconnector"
    NO_PROXY: "${ETCD_HOST},ia_influxdbconnector"
    ETCD_HOST: ${ETCD_HOST}
    ETCD_CLIENT_PORT: ${ETCD_CLIENT_PORT}
    MQTT_BROKER_HOST: 'ia_mqtt_broker'
    INFLUX_SERVER: 'ia_influxdbconnector'
    INFLUXDB_PORT: $INFLUXDB_PORT
    ETCD_PREFIX: ${ETCD_PREFIX}
  networks:
    - eii
  volumes:
    - "vol_temp_telegraf:/tmp/"
    - "vol_eii_socket:${SOCKET_DIR}"
  secrets:
    - ca_etcd
    - etcd_Telegraf_cert
    - etcd_Telegraf_key
Note
: If user wants to add telegraf output plugin in telegraf instance, modify docker-compose.yml, docker-compose.yml and telegraf configuration(.conf) files.
Add publisher configuration in config.json:
{
   "config": {

       ...,
       "<output plugin instance_name>": {
           "measurements": ["*"],
           "profiling": "true"
       }
   },
   "interfaces": {
       ...,
       "Publishers": [
           ...,
           {
               "Name": "<output plugin instance_name>",
               "Type": "zmq_tcp",
               "EndPoint": "0.0.0.0:<publisher port>",
               "Topics": [
                   "*"
               ],
               "AllowedClients": [
                   "*"
               ]
           }

       ]
   }
}
Example:
{
   "config": {

       ...,
       "publisher1": {
           "measurements": ["*"],
           "profiling": "true"
       }
   },
   "interfaces": {
       ...,
       "Publishers": [
           ...,
           {
               "Name": "publisher1",
               "Type": "zmq_tcp",
               "EndPoint": "0.0.0.0:65078",
               "Topics": [
                   "*"
               ],
               "AllowedClients": [
                   "*"
               ]
           }

       ]
   }
}
Expose “publisher port” in docker-compose.yml file:
ia_telegraf<ConfigInstance number>:
...
ports:
  - <publisher port>:<publisher port>
Example:
ia_telegraf<ConfigInstance number>:
...
ports:
  - 65078:65078
Add eii_msgbus output plugin in telegraf instance config file config/$ConfigInstance/$ConfigInstance.conf (for production mode) and config/$ConfigInstance/$ConfigInstance_devmode.conf (for developer mode).
[[outputs.eii_msgbus]] instance_name = “
“
Example: For $ConfigInstance = ‘Telegraf1’
User needs to add following section in config/Telegraf1/Telegraf1.conf (for production mode) and config/Telegraf1/Telegraf1_devmode.conf (for developer mode)
[[outputs.eii_msgbus]] instance_name = “publisher1”
After that, user will need to run the builder.py script command to allow the changes of the dockerfile take place.
$ cd [WORK_DIR]/IEdgeInsights/build
$ python3 builder.py
User will need to provision, build and bring up all the container again by using below command.
$ cd [WORK_DIR]/IEdgeInsights/build/provision
$ sudo ./provision.sh ../docker-compose.yml
$ cd ../
$ docker-compose -f docker-compose-build.yml build
$ docker-compose up -d
Based on above example, user can check the telegraf service will have multiple container as by using docker ps command.
Note: It’s been practice followed by many users, to keep the configuration in a modular way. One way to achieve the same could be keeping the additional configuration inside ‘Telegraf/config/$ConfigInstance/telegraf.d. For example:
create a directory ‘telegraf.d’ inside ‘Telegraf/config/config/$ConfigInstance’ :
$ mkdir config/$ConfigInstance/telegraf.d
$ cd config/$ConfigInstance/telegraf.d
keep additional configuration files inside that directory and pass the whole command to start the Telegraf in docker-compose.yml file as following:
command: ["telegraf -config=/etc/Telegraf/$ConfigInstance/$ConfigInstance.conf -config-directory=/etc/Telegraf/$ConfigInstance/telegraf.d"]
Enabling EII message bus input plugin in Telegraf
The purpose of this enablement is to allow telegraf received data from EII message bus and storing it into influxdb that able to be scalable.
Overview
The plugin subscribes to configured topic / topic prefixes. Plugin has component called subscriber which receives the data from eii message bus. After receiving the data, depending on configuration, the plugin process the data, either synchronously or asynchronously.
In synchronous processing**, the receiver thread (thread which receives the data from EII message bus) is also resposible for the processing of the data (json parsing). After processing the previous data only, the receiver thread process next data available on the EII message bus.
In asynchronous processing the receiver thread receives the data and put it into the queue. There will be pool of threads which will be dequeing the data from the queue and processing it.
Guidelines for choosing the data processing options are
Synchronous option: When the ingestion rate is consistent
Asynchronous options: There are two options
Topic specific queue+threadpool : Frequent spike in ingestion rate for a specific topic
Global queue+threadpool : Sometimes spike in ingestion rate for a specific topic
Configuration of the plugin
Configuration of the plugin is divided into two parts
ETCD configuration
Configuration in Telegraf.conf file config/Telegraf/Telegraf.conf
ETCD configuration
Since this is eii message bus plugin and so it’s part of EII framework, message bus configuration and plugin’s topic specific configuration is kept into etcd. Below is the sample configuration
{
    "config": {
        "influxdb": {
            "username": "admin",
            "password": "admin123",
            "dbname": "datain"
        },
        "default": {
            "topics_info": [
                "topic-pfx1:temperature:10:2",
                "topic-pfx2:pressure::",
                "topic-pfx3:humidity"
            ],
            "queue_len": 10,
            "num_worker": 2,
            "profiling": "false"
        }
    },
    "interfaces": {
        "Subscribers": [
            {
                "Name": "default",
                "Type": "zmq_tcp",
                "EndPoint": "ia_zmq_broker:60515",
                "Topics": [
                    "*"
                ],
                "PublisherAppName": "ZmqBroker"
            }
        ]
    }
}
Brief description of the configuration.
Like any other EII service Telegraf has ‘config’ and ‘interfaces’ sections. “interfaces” are the eii interface details. Let’s have more information of “config” section.
config : Contains the configuration of the influxdb (“influxdb”) and eii messagebus input plugin (“default”). In the above sample configuration, the “default” is an instance name. This instance name is referenced from the Telegraf’s configuration file config/Telegraf/Telegraf.conf
topics_info : This is an array of topic prefix configuration, where user specifies, how the data from topic-prefix should be processed. Below is the way every line in the topic information should be interpreted.
“topic-pfx1:temperature:10:2” : Process data from topic prefix ‘topic-pfx1’ asynchronously using the dedicated queue of length 10 and dedicated thread pool of size 2. And the processed data will be stored at measurement named ‘temperature’ in influxdb.
#. “topic-pfx2:pressure::” : Process data from topic prefix ‘topic-pfx2’ asynchronously using the global queue and global thread pool. And the processed data will be stored at measurement named ‘pressure’ in influxdb. #.
“topic-pfx3:humidity” : Process data synchronously. And the processed data will be stored at measurement named ‘humidity’ in influxdb.
Note : In case, topic specific configuration is not mentioned, then by default, data gets processed synchronously and measurement name would be, same as topic name.
queue_len : Global queue length.
num_worker : Global thread pool size.
profiling : This is to enable profiling mode of this plugin (value can be either “true” or “false”). In profiling mode every point will get the following information and will be kept into same measurement as that of point.
Total time spent in plugin (time in ns)
Time spent in queue (in case of asynchronous processing only and time in ns)
#. Time spend in json processing (time in ns) #.
The name of the thread pool and the thread id which processed the point.
Note: The name of the global thread pool is “GLOBAL”. For a topic specific thread pool, the name is “for-$topic-name”.
|
Configuration at Telegraf.conf file
The plugin instance name is an additional key, kept into plugin configuration section. This key is used to fetch the configuration from ETCD. Below is the minimmum, sample configuration with single plugin instance.
[[inputs.eii_msgbus]]
**instance_name = "default"**
data_format = "json"
json_strict = true
Here, the value ‘default’ acts as a key in the file `config.json <https://github.com/open-edge-insights/ts-telegraf/blob/master/config.json>`_**. For this key, there is configuration in the **’interfaces’ and ‘config’ sections of the file `config.json <https://github.com/open-edge-insights/ts-telegraf/blob/master/config.json>`_**. So the value of** ‘instance_name’ acts as a connect/glue between the Telegraf configuration **config.json** and the **ETCD configuration config.json**
Note: Since it’s telegraf input plugin, the telegraf’s parser configuration has to be in Telegraf.conf file. The more information of the telegraf json parser plugin can be be found at https://github.com/influxdata/telegraf/tree/master/plugins/parsers/json. In case if there are multiple telegraf instances, then the location of the Telegraf configuration files would be different. For more details please refer the section Optional: Adding multiple telegraf instance
Enabling EII message bus Output plugin in Telegraf
Purpose Receiving the data from Telegraf Input Plugin and publish data to eii msgbus.
Configuration of the plugin Configuration of the plugin is divided into two parts
ETCD configuration
Configuration in Telegraf.conf file config/Telegraf/Telegraf.conf
ETCD configuration Since this is eii message bus plugin and so it’s part of EII framework, message bus configuration and plugin’s topic specific configuration is kept into etcd. Below is the sample configuration
{
    "config": {
        "publisher": {
            "measurements": ["*"],
            "profiling": "false"
        }
    },
    "interfaces": {
        "Publishers": [
            {
                "Name": "publisher",
                "Type": "zmq_tcp",
                "EndPoint": "0.0.0.0:65077",
                "Topics": [
                    "*"
                ],
                "AllowedClients": [
                    "*"
                ]
            }
        ]
    }
}
Brief description of the configuration. Like any other EII service Telegraf has ‘config’ and ‘interfaces’ sections. “interfaces” are the eii interface details. Let’s have more information of “config” section.
config : Contains eii messagebus output plugin (“publisher”). In the above sample configuration, the “publisher” is an instance name. This instance name is referenced from the Telegraf’s configuration file config/Telegraf/Telegraf.conf
measurements : This is an array of measurements configuration, where user specifies, which measurement data should be published in msgbus.
profiling : This is to enable profiling mode of this plugin (value can be either “true” or “false”).
Configuration at Telegraf.conf file
The plugin instance name is an additional key, kept into plugin configuration section. This key is used to fetch the configuration from ETCD. Below is the minimmum, sample configuration with single plugin instance.
[[outputs.eii_msgbus]]
instance_name = "publisher"
Here, the value ‘publisher’ acts as a key in the file `config.json <https://github.com/open-edge-insights/ts-telegraf/blob/master/config.json>`_**. For this key, there is configuration in the **’interfaces’ and ‘config’ sections of the file `config.json <https://github.com/open-edge-insights/ts-telegraf/blob/master/config.json>`_**. So the value of** ‘instance_name’ acts as a connect/glue between the Telegraf configuration **config.json** and the **ETCD configuration config.json**
Advanced: Multiple plugin sections of EII message bus input plugin
Like any other Telegraf plugin user can keep multiple configuration sections of the EII message bus input plugin in the **config/Telegraf/Telegraf.conf** file.
Let’s have an example for the same. Let’s assume there are two EII apps, one with the AppName “EII_APP1” and another with the AppName “EII_APP2”, which are publishing the data to eii message bus. The Telegraf’s ETCD configuration for the same is
{
   "config":{
      "subscriber1":{
         "topics_info":[
            "topic-pfx1:temperature:10:2",
            "topic-pfx2:pressure::",
            "topic-pfx3:humidity"
         ],
         "queue_len":100,
         "num_worker":5,
         "profiling":"true"
      },
      "subscriber2":{
         "topics_info":[
            "topic-pfx21:temperature2:10:2",
            "topic-pfx22:pressure2::",
            "topic-pfx23:humidity2"
         ],
         "queue_len":100,
         "num_worker":10,
         "profiling":"true"
      }
   },
   "interfaces":{
      "Subscribers":[
         {
            "Name":"subscriber1",
            "EndPoint":"EII_APP1_container_name:5569",
            "Topics":[
               "*"
            ],
            "Type":"zmq_tcp",
            "PublisherAppName": "EII_APP1"
         },
         {
            "Name":"subscriber2",
            "EndPoint":"EII_APP2_container_name:5570",
            "Topics":[
               "topic-pfx21",
               "topic-pfx22",
               "topic-pfx23"
            ],
            "Type":"zmq_tcp",
            "PublisherAppName": "EII_APP2"
         }
      ]
   }
}
The Telegraf.conf configuration sections for the same is
[[inputs.eii_msgbus]]
instance_name = "subscriber1"
data_format = "json"
json_strict = true

[[inputs.eii_msgbus]]
instance_name = "subscriber2"
data_format = "json"
json_strict = true
Using input plugin
By default EII message bus input plugin is disabled. To Configure the EII input plugin, uncomment the following lines in **config/Telegraf/Telegraf_devmode.conf** and **config/Telegraf/Telegraf_devmode.conf**
[[inputs.eii_msgbus]]
instance_name = "default"
data_format = "json"
json_strict = true
tag_keys = [
  "my_tag_1",
  "my_tag_2"
]
json_string_fields = [
  "field1",
  "field2"
]
json_name_key = ""
Edit config.json to add EII message bus input plugin. .. code-block:
{
  "config": {
      ...
      "default": {
          "topics_info": [
              "topic-pfx1:temperature:10:2",
              "topic-pfx2:pressure::",
              "topic-pfx3:humidity"
          ],
          "queue_len": 10,
          "num_worker": 2,
          "profiling": "false"
      },
      ...
  },
  "interfaces": {
      "Subscribers": [
          {
              "Name": "default",
              "Type": "zmq_tcp",
              "EndPoint": "ia_zmq_broker:60515",
              "Topics": [
                  "*"
              ],
              "PublisherAppName": "ZmqBroker"
          }
      ],
      ...
  }
}
Advanced: Multiple plugin sections of EII message bus output plugin
Like any other Telegraf plugin user can keep multiple configuration sections of the EII message bus output plugin in the **config/Telegraf/Telegraf.conf** file.
The Telegraf’s ETCD configuration for the same is
{
    "config": {
        "publisher1": {
            "measurements": ["*"],
            "profiling": "false"
        },
        "publisher2": {
            "measurements": ["*"],
            "profiling": "false"
        }
    },
    "interfaces": {
        "Publishers": [
            {
                "Name": "publisher1",
                "Type": "zmq_tcp",
                "EndPoint": "0.0.0.0:65077",
                "Topics": [
                    "*"
                ],
                "AllowedClients": [
                    "*"
                ]
            },
            {
                "Name": "publisher2",
                "Type": "zmq_tcp",
                "EndPoint": "0.0.0.0:65078",
                "Topics": [
                    "*"
                ],
                "AllowedClients": [
                    "*"
                ]
            }
        ]
    }
}
The Telegraf.conf configuration sections for the same is
[[outputs.eii_msgbus]]
instance_name = "publisher1"

[[outputs.eii_msgbus]]
instance_name = "publisher2"
Kapacitor
Kapacitor* is a data processing engine in the TICK Stack. Users can plug in their own custom logic to process alerts with dynamic thresholds, match metrics for patterns, or identify statistical anomalies. We will use Kapacitor to read data from InfluxDB, generate alerts, and take appropriate action based on the needs. More details and architecture about Kapacitor can be found at https://www.influxdata.com/time-series-platform/kapacitor/
The Kapacitor will support UDFs that written in Python3 or Go*. The sample example of Go and Python UDF is available in the [WORK_DIR]/IEdgeInsights/Kapasitor/UDF directory.
Any integral value that gets generated over time, we can say it is a point data. The examples can be :
Temperature at a different time in a day.
Number of oil barrels processed per minute.
By doing the analytics over point data, the factory can have an anomaly detection mechanism. That’s where the PointDataAnalytics come into the picture.
IEdgeInsights uses the TICK stack to do point data analytics.
IEdgeInsights has a temperature anomaly detection example for demonstrating the time-series data analytics flow.
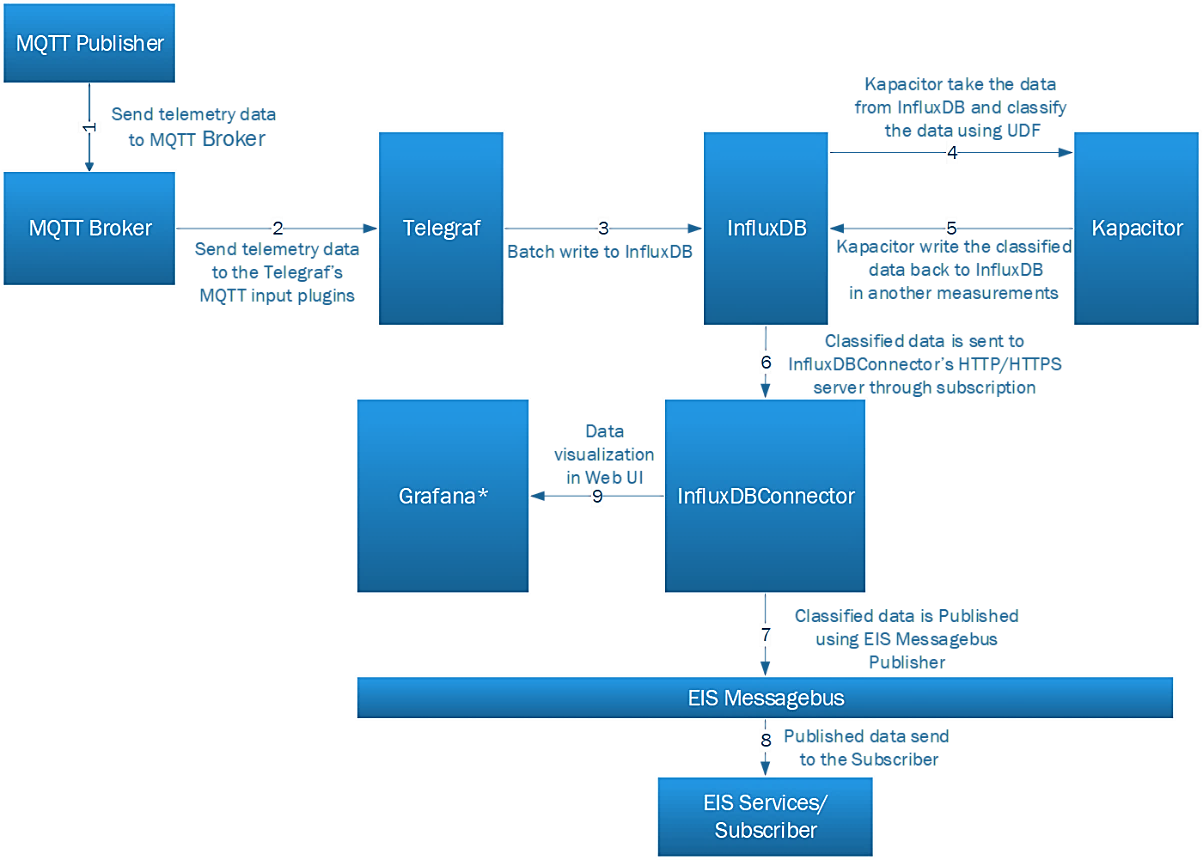
The high-level flow of the data, in the example, can be seen as MQTT-temp-sensor–>Telegraf–>Influx–>Kapacitor–>Influx.
MQTT-temp-sensor simulator sends the data to the Telegraf. Telegraf just sends the same data to the Influx and Influx send it to Kapacitor. Kapacitor does anomaly detection and publishes the results back to Influx.
Here, Telegraf is the TICK stack component and supporting the number of input plug-ins for data ingestion. Influx is a time-series database. Kapacitor is an analytics engine where users can write custom analytics plug-ins (TICK scripts).
Starting the example
To start the mqtt-temp-sensor, please refer tools/mqtt-publisher/README.md.
In case, if SI wants to use the IEdgeInsights only for Point Data Analytics, then comment Video use case containers ia_video_ingestion and ia_video_analytics in
../build/docker-compose.ymlStarting the EII. To start the EII in production mode, provisioning is required. For more information on provisioning please refer the README. After provisioning, please follow the below commands
cd build
docker-compose -f docker-compose-build.yml build
docker-compose up -d
To start the EII in developer mode, please refer to the README.
To verify the output please check the output of below command
docker logs -f ia_influxdbconnector
Below is the snapshot of sample output of the ia_influxdbconnector command.
I0822 09:03:01.705940       1 pubManager.go:111] Published message: map[data:point_classifier_results,host=ia_telegraf,topic=temperature/simulated/0 temperature=19.29358085726703,ts=1566464581.6201317 1566464581621377117]
I0822 09:03:01.927094       1 pubManager.go:111] Published message: map[data:point_classifier_results,host=ia_telegraf,topic=temperature/simulated/0 temperature=19.29358085726703,ts=1566464581.6201317 1566464581621377117]
I0822 09:03:02.704000       1 pubManager.go:111] Published message: map[data:point_data,host=ia_telegraf,topic=temperature/simulated/0 ts=1566464582.6218634,temperature=27.353740759929877 1566464582622771952]
The data can be visualized using the Grafana dashboard, to know more refer Grafana/README.md
Purpose of Kapacitor
About Kapacitor and UDF
User can write the custom anomaly detection algorithm in PYTHON/GOLANG. And these algorithms will be called as UDF (user-defined function). These algorithms have to follow certain API standards so that the Kapacitor will be able to call these UDFs at run time.
IEdgeInsights has come up with the sample UDF written in GOLANG. Kapacitor is subscribed to the InfluxDB, and gets the temperature data. After getting this data, Kapacitor calls these UDF, which detects the anomaly in the temperature and sends back the results to Influx.
The sample Go UDF is at go_classifier.go and the tick script is at go_point_classifier.tick
The sample Python UDF is at py_classifier.py and the tick script is at py_point_classifier.tick
For more details, on Kapacitor and UDF, please refer below links i) Writing a sample UDF at anomaly detection ii) UDF and kapacitor interaction here
In production mode the Kapacitor config file is Kapacitor/config/kapacitor.conf and in developer mode the config file would be Kapacitor/config/kapacitor_devmode.conf
Purpose of plugins
The plugins allow Kapacitor to interact directly with EII message bus. They use message bus publisher/subscriber interface. Using these plugins Kapacitor can now receive data from various EII publishers and send data to various EII subscribers. Hence, it’s possible to have a time-series use case without InfluxDB and Kapacitor can act as an independent analytical engine.
A simple use case flow can be:
MQTT-temp-sensor-->Telegraf-->Kapacitor-->TimeseriesProfiler
Using input plugin
Configure the EII input plugin in config/kapacitor_devmode.conf and config/kapacitor_devmode.conf For example:
[eii]
  enabled = true
Edit config.json to add a subscriber under interfaces.
For example, to receive data published by Telegraf:
TCP mode
"Subscribers": [
    {
        "Name": "telegraf_sub",
        "Type": "zmq_tcp",
        "EndPoint": "ia_telegraf:65077",
        "PublisherAppName": "Telegraf",
        "Topics": [
            "*"
        ]
    }
]
IPC mode
"Subscribers": [
    {
        "Name": "telegraf_sub",
        "Type": "zmq_ipc",
        "EndPoint": {
            "SocketDir": "/EII/sockets",
            "SocketFile": "telegraf-out"
        },
        "PublisherAppName": "Telegraf",
        "Topics": [
            "*"
        ]
    }
]
Note: For IPC mode, we need to specify the ‘EndPoint’ as a dict of ‘SocketDir’ and ‘SocketFile’ in case where ‘Topics’ is [*] (as in the above example). In case of single topic the ‘EndPoint’ can be defined as below (as in the example of Kapacitor o/p plugin):
"EndPoint": "/EII/sockets"
The received data will be available in the ‘eii’ storage for the tick scripts to use.
Create/modify a tick script to process the data and configure the same in config.json. For example, use the stock tick_scripts/eii_input_plugin_logging.tick which logs the data received from ‘eii’ storage onto the kapacitor log file (residing in the container at /tmp/log/kapacitor/kapacitor.log).
"task": [
   {
     "tick_script": "eii_input_plugin_logging.tick",
     "task_name": "eii_input_plugin_logging"
   }
]
Do the provisioning and run the EII stack.
The subscribed data will now be available in the above logs file which can be viewed with the command below:
docker exec ia_kapacitor tail -f /tmp/log/kapacitor/kapacitor.log
Using output plugin
Create/modify a tick script to use ‘eiiOut’ node to send the data using publisher interface For example, you may modify the profiling UDF as below:
dbrp "eii"."autogen"

var data0 = stream
    |from()
            .database('eii')
            .retentionPolicy('autogen')
            .measurement('point_data')
    @profiling_udf()
    |eiiOut()
            .pubname('sample_publisher')
            .topic('sample_topic')
Add a publisher interface added to config.json with the same publisher name and topic i.e. ‘sample_publisher’ and ‘sample_topic’ respectively as in the above example. For example:
TCP mode
"Publishers": [
    {
        "Name": "sample_publisher",
        "Type": "zmq_tcp",
        "EndPoint": "0.0.0.0:65034",
        "Topics": [
            "sample_topic"
        ],
        "AllowedClients": [
            "TimeSeriesProfiler"
        ]
    }
]
IPC mode
"Publishers": [
    {
        "Name": "sample_publisher",
        "Type": "zmq_ipc",
        "EndPoint": "/EII/sockets",
        "Topics": [
            "sample_topic"
        ],
        "AllowedClients": [
            "TimeSeriesProfiler"
        ]
    }
]
Do the provisioning and run the EII stack.
User-defined Functions
UDFs can communicate with Kapacitor to process data through TICK scripting. Kapacitor will stream data into it and the UDF can respond with new or modified data.
In the released version of EII, the UDF does the thresholding of temperature sensor data. The UDF will get timeseries data from InfluxDB and read temperature data. The classifier_results, which has the defect data, is sent as a response timeseries data from the UDF. The TICK script will save this back into InfluxDB.
Custom UDFs available in the udfs directory
UNIX Socket based UDFs
go_classifier.go: Filter the points based on temperature (data > 20 and < 25 filtered out).
py_classifier.py: Filter the points based on temperature (data > 20 and < 25 filtered out).
profiling_udf.go: Add the profiling (time taken to process the data) data in the points.
temperature_classifier.go: Filter the points based on temperature (data < 25 filtered out).
humidity_classifier.py: Filter the points based on humidity (data < 25 filtered out).
Process based UDFs
rfc_classifier.py: Random Forest Classification algo sample. This UDF can be used as profiling udf as well.
Steps to configure the UDFs in kapacitor.
Keep the custom UDFs in the tick_scripts directory and the TICK script in the tick_scripts directory.
Keep the training data set (if any) required for the custom UDFs in the training_data_sets directory.
For python UDFs, if any external python package dependency needs to be installed. To install the python package using pip, it can be added in the conda_requirements.txt file and to install the python package using conda, it can be added in the conda_requirements.txt file.
Modify the udf section in the kapacitor_devmode.conf and in the kapacitor_devmode.conf. Mention the custom UDF in the conf for example
[udf.functions.customUDF]
  socket = "/tmp/socket_file"
  timeout = "20s"
In case of go/python based UDF, update the values of keys named “type”, “name”, “tick_script”, “task_name”, in the config.jsonfile. for example
"task": [{
     "tick_script": "py_point_classifier.tick",
     "task_name": "py_point_classifier",
     "udfs": [{
         "type": "python",
         "name": "py_classifier"
     }]
}]
In case of, tick only UDF, update the values of keys named “tick_script”, “task_name”, in the config.jsonfile. for example
"task": [{
     "tick_script": "simple_logging.tick",
     "task_name": "simple_logging"
     }]
### Note:
By default, go_classifier and rfc_classifier is configured.
Mention the TICK script udf function same as configured in the Kapacitor config file. For example, UDF Node in the TICK script
@py_point_classifier()
should be same as
[udf.functions.py_point_classifier]
   socket = "/tmp/socket_file"
   timeout = "20s"
go/python based UDF should listen on the same socket file as mentioned in the the udf section in the kapacitor_devmode.conf and in the kapacitor_devmode.conf. For example
[udf.functions.customUDF]
  socket = "/tmp/socket_file"
  timeout = "20s"
In case of process based UDFs, provide the correct path of the code within the container in the kapacitor_devmode.conf and in the kapacitor_devmode.conf. By default, the files and directories will be copied into the container under “/EII” director. It is recommended to keep the custom UDFs in the udfs directory, the path of the custom UDF will be “/EII/udfs/customUDF_name” as shown in below example. If the UDF is kept in different path please modify the path in the args accordingly.
The PYTHONPATH of the Kapacitor agent directory is “/EII/go/src/github.com/influxdata/kapacitor/udf/agent/py/”. How to pass it is shown in the below example.
For example
[udf.functions.customUDF]
   prog = "python3.7"
   args = ["-u", "/EII/udfs/customUDF"]
   timeout = "60s"
   [udf.functions.customUDF.env]
      PYTHONPATH = "/go/src/github.com/influxdata/kapacitor/udf/agent/py/"
Do the provisioning and run the EII stack.
Interfaces Exposed for UDFs
There are six interfaces exposed for UDFs to communicate with Kapacitor:
info():
init():
snapshot():
restore():
begin_batch():
point():
For further details of these UDFs, kindly refer to URL: https://docs.influxdata.com/kapacitor/v1.5/guides/socket_udf/
Contents
Implementation of 2 simple examples to showcase the use of a single task with multiple UDFs and multiple tasks with single UDF in Kapacitor.
Sample implemented in single task with multiple UDFs. MQTT Publisher is publishing 2 parameters (temperature and humidity). TICK script is calling 2 UDFs (one written in GO, another one in python), Go-based UDF is filtering the data based on the condition (i.e. temperature > 25), similarly for the python based UDF the condition is set to “humidity > 25”, filtered data is written back to “point_classifier_results” measurement in InfluxDB.
Sample implemented in multiple tasks with single UDF. MQTT Publisher is publishing 2 parameters (temperature and humidity). One TICK script is calling Go UDF, it is filtering the data based on the condition “temperature > 25” and the data is written back to “point_classifier_results” measurement.
Second TICK script is calling python UDF, it is filtering the data based on the condition “humidity > 25” and the data is written back to “humidity_classifier_results” measurement.
Samples directory contain 3 directories, kapacitor_config which is common to both the samples and the tick scripts and eii config for each sample is kept in respective directory.
Steps to run the samples
It is recommended to take a backup of the following original files before running the below mentioned steps as it will replace the original file.
config directory.
config.json file.
Copy the sample config or config files based on prod or dev mode configuration of EII in the config directory.
$ cp kapacitor_config/kapacitor.conf kapacitor_config/kapacitor_devmode.conf ../config/
To run the multiple UDFs in a single task sample
Copy the config.json file and replace the config.json file.
$ cp multi_udfs_single_task/eii_config/config.json ../config.json
Copy the tick_scripts and paste it in the tick_scripts directory.
$ cp multi_udfs_single_task/tick_scripts/point_classifier.tick ../tick_scripts/
To run the multiple tasks with single UDF
Copy the config.json file and replace the config.json file.
$ cp single_udf_multi_tasks/eii_config/config.json ../config.json
Copy the tick_scripts and tick_scripts and paste it in the tick_scripts directory.
$ cp single_udf_multi_tasks/tick_scripts/humidity_classifier.tick ../tick_scripts/

$ cp single_udf_multi_tasks/tick_scripts/temperature_classifier.tick ../tick_scripts/
Please go through the below sections to bring up EII stack:
To start the mqtt-publisher with temperature and humidity data, please refer tools/mqtt-publisher/README.md
Steps to verify the results in single task with multiple UDFs
InfluxDBConnector logs output
Command
$ docker logs -f ia_influxdbconnector
Output
I0717 00:53:46.636838      10 pubManager.go:121] Published message: map[data:point_data,host=ia_telegraf,topic=temperature/simulated/0 humidity=28.57107003902059,ts=1594927426.634632,temperature=26.655493463976832 1594927426635557092 idbconn_pub:true]
I0717 00:53:46.639011      10 pubManager.go:121] Published message: map[data:point_classifier_results,host=ia_telegraf,topic=temperature/simulated/0 humidity=28.57107003902059,temperature=26.655493463976832,ts=1594927426.634632 1594927426635557092 idbconn_pub:true]
I0717 00:53:47.638366      10 pubManager.go:121] Published message: map[data:point_data,host=ia_telegraf,topic=temperature/simulated/0 temperature=22.619720484770554,humidity=16.731963502272897,ts=1594927427.6358457 1594927427636952571 idbconn_pub:true]
I0717 00:53:48.642098      10 pubManager.go:121] Published message: map[data:point_data,host=ia_telegraf,topic=temperature/simulated/0 ts=1594927428.6372812,temperature=17.571037421047784,humidity=23.928420142806388 1594927428640200053 idbconn_pub:true]
I0717 00:53:49.640132      10 pubManager.go:121] Published message: map[data:point_data,host=ia_telegraf,topic=temperature/simulated/0 ts=1594927429.6386497,temperature=13.926727845681501,humidity=14.61523554472623 1594927429639197778 idbconn_pub:true]
I0717 00:53:50.641966      10 pubManager.go:121] Published message: map[data:point_data,host=ia_telegraf,topic=temperature/simulated/0 ts=1594927430.6400163,temperature=29.535498572099197,humidity=17.40839676245851 1594927430640922707 idbconn_pub:true]
I0717 00:53:51.644246      10 pubManager.go:121] Published message: map[data:point_data,host=ia_telegraf,topic=temperature/simulated/0 ts=1594927431.6406047,temperature=22.014647866484523,humidity=23.24245661794304 1594927431641579125 idbconn_pub:true]
I0717 00:53:52.643982      10 pubManager.go:121] Published message: map[data:point_data,host=ia_telegraf,topic=temperature/simulated/0 ts=1594927432.641993,temperature=16.77923134191675,humidity=18.01282784469746 1594927432642890643 idbconn_pub:true]
I0717 00:53:53.644850      10 pubManager.go:121] Published message: map[data:point_data,host=ia_telegraf,topic=temperature/simulated/0 ts=1594927433.642745,temperature=11.96364985814431,humidity=24.91437844150262 1594927433643691025 idbconn_pub:true]
I0717 00:53:54.646171      10 pubManager.go:121] Published message: map[data:point_data,host=ia_telegraf,topic=temperature/simulated/0 temperature=27.031131147255834,humidity=29.017961635659024,ts=1594927434.6439903 1594927434644892174 idbconn_pub:true]
I0717 00:53:54.648654      10 pubManager.go:121] Published message: map[data:point_classifier_results,host=ia_telegraf,topic=temperature/simulated/0 humidity=29.017961635659024,temperature=27.031131147255834,ts=1594927434.6439903 1594927434644892174 idbconn_pub:true]
Check data in the InfluxDB
Enter in the container using the following command
$ docker exec -it ia_influxdbconnector bash
Use the following to enter into the database
prod mode
$ influx -ssl -unsafeSsl -username "username" -password "password" -database "database_name"
dev mode
$ influx -username "username" -password "password" -database "database_name"
replace the “username”, “database”, and “password” keys with your DB username, password and DB name.`
Use Influx CLI command to interact with DB.
$ show measurements
Output of the command
> show measurements
name: measurements
name
----
point_classifier_results
point_data
To see the data in point_classifier_results measurement use the following command
$ select * from point_classifier_results
Sample output of the command
name: point_classifier_results
time                host        humidity           temperature        topic                   ts
----                ----        --------           -----------        -----                   --
1594927630832507623 ia_telegraf 29.855404019751816 25.53367159780972  temperature/simulated/0 1594927630.8313158
1594927641839961485 ia_telegraf 29.913849074313813 25.18000949751805  temperature/simulated/0 1594927641.8386183
1594927644843838821 ia_telegraf 26.631081501636743 29.99623149385496  temperature/simulated/0 1594927644.842906
1594927678873799703 ia_telegraf 25.362676867888464 25.420215215181166 temperature/simulated/0 1594927678.872921
1594927703898638431 ia_telegraf 27.55019173839383  26.603218492677055 temperature/simulated/0 1594927703.8980274
1594927705900115913 ia_telegraf 26.309594644310167 25.68362497454113  temperature/simulated/0 1594927705.8995953
1594927709904380759 ia_telegraf 27.52768187637576  29.3945157174943   temperature/simulated/0 1594927709.9034615
1594927744936530293 ia_telegraf 26.844547285321887 29.498420224006598 temperature/simulated/0 1594927744.9355264
1594927753945020633 ia_telegraf 25.71321771687117  25.07137538609002  temperature/simulated/0 1594927753.9441714
Here, both the temperature and himidity data is above 25
Steps to verify the results in multiple tasks with single UDF
InfluxDBConnector logs output
Command
$ docker logs -f ia_influxdbconnector
Output
I0716 23:58:01.428896      10 pubManager.go:121] Published message: map[data:point_data,host=ia_telegraf,topic=temperature/simulated/0 humidity=23.50196006313319,ts=1594924081.4278295,temperature=25.758773258956786 1594924081428303867 idbconn_pub:true]
I0716 23:58:01.429801      10 pubManager.go:121] Published message: map[data:point_classifier_results,host=ia_telegraf,topic=temperature/simulated/0 humidity=23.50196006313319,temperature=25.758773258956786,ts=1594924081.4278295 1594924081428303867 idbconn_pub:true]
I0716 23:58:02.429889      10 pubManager.go:121] Published message: map[data:point_data,host=ia_telegraf,topic=temperature/simulated/0 humidity=12.785272290966788,ts=1594924082.4282343,temperature=25.88015317051446 1594924082428980179 idbconn_pub:true]
I0716 23:58:02.431062      10 pubManager.go:121] Published message: map[data:point_classifier_results,host=ia_telegraf,topic=temperature/simulated/0 humidity=12.785272290966788,temperature=25.88015317051446,ts=1594924082.4282343 1594924082428980179 idbconn_pub:true]
I0716 23:58:03.430484      10 pubManager.go:121] Published message: map[data:point_data,host=ia_telegraf,topic=temperature/simulated/0 humidity=27.393076181834594,ts=1594924083.4287212,temperature=18.16039229846337 1594924083429552256 idbconn_pub:true]
I0716 23:58:03.433508      10 pubManager.go:121] Published message: map[data:humidity_classifier_results,host=ia_telegraf,topic=temperature/simulated/0 humidity=27.393076181834594,temperature=18.16039229846337,ts=1594924083.4287212 1594924083429552256 idbconn_pub:true]
I0716 23:58:04.431786      10 pubManager.go:121] Published message: map[data:point_data,host=ia_telegraf,topic=temperature/simulated/0 temperature=27.32044250166733,humidity=12.040910740537647,ts=1594924084.430019 1594924084430766594 idbconn_pub:true]
I0716 23:58:04.433122      10 pubManager.go:121] Published message: map[data:point_classifier_results,host=ia_telegraf,topic=temperature/simulated/0 humidity=12.040910740537647,temperature=27.32044250166733,ts=1594924084.430019 1594924084430766594 idbconn_pub:true]
I0716 23:58:05.431732      10 pubManager.go:121] Published message: map[data:point_data,host=ia_telegraf,topic=temperature/simulated/0 ts=1594924085.4304821,temperature=24.03411329966985,humidity=17.1642901921084 1594924085431039073 idbconn_pub:true]
Check data in the InfluxDB
Enter in the container using the following command
$ docker exec -it ia_influxdbconnector bash
Use the following to enter into the database
prod mode
$ influx -ssl -unsafeSsl -username "username" -password "password" -database "database_name"
dev mode
$ influx -username "username" -password "password" -database "database_name"
replace the “username”, “database”, and “password” keys with your DB username, password and DB name.`
Use Influx CLI command to interact with DB.
$ show measurements
Output of the command
> show measurements
name: measurements
name
----
humidity_classifier_results
point_classifier_results
point_data
To see the data in point_classifier_results measurement use the following command
$ select * from point_classifier_results
Sample output of the command
name: point_classifier_results
time                host        humidity           temperature        topic                   ts
----                ----        --------           -----------        -----                   --
1594923545769758418 ia_telegraf 19.81604257073865  26.879897943430848 temperature/simulated/0 1594923545.7691243
1594923614838551423 ia_telegraf 28.95738078521109  29.250270883294515 temperature/simulated/0 1594923614.8377328
1594923616840732537 ia_telegraf 21.3038992065728   27.128756451611928 temperature/simulated/0 1594923616.839861
1594923621850408245 ia_telegraf 24.17081234022867  28.12092358748019  temperature/simulated/0 1594923621.8499172
1594923622851693103 ia_telegraf 16.991377116304164 25.942235861646243 temperature/simulated/0 1594923622.8506734
1594923625853194299 ia_telegraf 17.790742401040156 26.029039405898416 temperature/simulated/0 1594923625.8526921
1594923627854797339 ia_telegraf 18.636291434358817 29.326483056022322 temperature/simulated/0 1594923627.8538675
1594923629861235060 ia_telegraf 13.110781672981076 26.452111132568664 temperature/simulated/0 1594923629.8601944
1594923636868340122 ia_telegraf 27.663236146599328 26.29884980515991  temperature/simulated/0 1594923636.867832
1594923647880734785 ia_telegraf 25.3924565876123   28.078243101597526 temperature/simulated/0 1594923647.8796468
1594923648881486348 ia_telegraf 12.022217148202829 27.96651437168266  temperature/simulated/0 1594923648.8805144
1594923654886479873 ia_telegraf 17.333022980266087 28.368384241660806 temperature/simulated/0 1594923654.8855999
1594923655888191773 ia_telegraf 29.70650230680635  26.11839631300789  temperature/simulated/0 1594923655.8870778
1594923656888741310 ia_telegraf 17.591632563610442 27.549975342107892 temperature/simulated/0 1594923656.8878617
Here, all the temperature data is above 25
To see the data in humidity_classifier_results measurement use the following command
$ select * from humidity_classifier_results
Sample output of the command
name: humidity_classifier_results
time                host        humidity           temperature        topic                   ts
----                ----        --------           -----------        -----                   --
1594922435670934407 ia_telegraf 29.14477182235822  28.24835641087284  temperature/simulated/0 1594922435.6704926
1594922438672749397 ia_telegraf 28.333961058034408 23.79412059324136  temperature/simulated/0 1594922438.6722746
1594922440673573262 ia_telegraf 28.403412014434576 15.849326161213199 temperature/simulated/0 1594922440.6730607
1594922441674124435 ia_telegraf 27.629699521677637 13.964340936065131 temperature/simulated/0 1594922441.6733868
1594922451683956862 ia_telegraf 26.31819680956764  11.757978239277323 temperature/simulated/0 1594922451.6834583
1594922452684404597 ia_telegraf 26.942886935205237 27.954762973394395 temperature/simulated/0 1594922452.6838408
1594922454685507436 ia_telegraf 28.198384986303513 21.958077952286747 temperature/simulated/0 1594922454.6847117
1594922459691136679 ia_telegraf 28.928009573873968 27.33375706494249  temperature/simulated/0 1594922459.6906385
1594922461692967897 ia_telegraf 27.300210084769425 21.84679722208667  temperature/simulated/0 1594922461.6924229
1594922464695220305 ia_telegraf 26.031621145742253 19.33596257126575  temperature/simulated/0 1594922464.694672
1594922465696773126 ia_telegraf 25.312548153267265 25.93090843830029  temperature/simulated/0 1594922465.695979
1594922466697439030 ia_telegraf 29.384297962446905 27.409752918067007 temperature/simulated/0 1594922466.6964452
1594922472701537004 ia_telegraf 27.621241070234706 26.68898759908584  temperature/simulated/0 1594922472.7007167
1594922473703266299 ia_telegraf 28.558485895926765 21.455033422854758 temperature/simulated/0 1594922473.7021594
1594922475704646142 ia_telegraf 27.423792582269076 12.596418464102804 temperature/simulated/0 1594922475.7040672
1594922479707734013 ia_telegraf 27.770484735726605 19.20584244268835  temperature/simulated/0 1594922479.706727
Here, all the humidity data is above 25
Working with Kapacitor*
Kapacitor uses a Domain Specific Language (DSL) named TICK script to define tasks involving the extraction, transformation and loading of data. One common task is defining alerts. TICK script is coded in .tick files to define pipelines for processing data. The TICK script language is designed to chain together the invocation of data processing operations defined in nodes.
In TICK script, the fundamental type is the node. A node has properties and, as mentioned, chaining methods. A new node can be created from a parent or sibling node using a chaining method of that parent or sibling node. For each node type the signature of this method will be the same, regardless of the parent or sibling node type. The chaining method can accept zero or more arguments used to initialize internal properties of the new node instance. Common node types are batch, query, stream, from, eval and alert, though there are dozens of others.
The top-level nodes establish the processing type of the task to be defined, either stream and batch, and are simply declared and take no arguments. Nodes with more complex sets of properties rely on Property methods for their internal configuration.
In TICK, each node type needs data in either batch or stream mode. Some can handle both. Each node type also provides data in batch or stream mode. Some can also provide both. This needs/provides pattern is important to understanding how nodes work together. Taking into consideration the needs/provides pattern, four general node use cases can be defined:
need a batch and provide a stream - for example, when computing an average or a minimum or a maximum.
need a batch and provide a batch - for example, when identifying outliers in a batch of data.
need a stream and provide a batch - for example, when grouping together similar data points.
need a stream and provide a stream - for example, when applying a mathematical function like a logarithm to a value in a point
More details and documentation on the TICK Scripting can be found at https://docs.influxdata.com/kapacitor/v1.4/tick/introduction/
Grafana is an open source metric analytics & visualization suite. It is most commonly used for visualizing time series data for infrastructure and application analytics but many use it in other domains including industrial sensors, home automation, weather, and process control.
Grafana supports many different storage backends for our time series data (Data Source). Here in EII we are using InfluxDB as datasource.
Grafana connects to the InfluxDB datasource which has been preconfigured as a part of grafana setup. The data source i.e. ia_influxdbconnector service must be running in order for grafana to collect time series data.
Once the data source is working, we can visualize the incoming data using the preconfigured dashboard. We can aslo edit the dashboard as per our convenience.
There is a sample application in EIIv2.x used for generating random temperature sensor data. This data is streamed through mqtt to influxDB with the high-level flow below explained in Section 10.3.1.
The high-level flow of the data in the example can be seen as mqtt-temp-sensor -> Telegraf -> Influx -> Kapacitor -> Influx.
The classified results can be visualized using Grafana as per the preconfigured example in Figure 8.

Configuration
- dashboard.json
This is the dashboard json file that is loaded when grafana starts. It has been preconfigured to display time-series data.
- dashboard_sample.yml
This is the config file for all the dashboards. It specifies the path where all the dashboard json files will be looked for.
- datasource_sample.yml
This is the config file for setting up the datasource. It has got various fields for datasource configuration.
- grafana_template.ini
This is the config for Grafana itself. It specifies how grafana should start up, once it has been configured.
NOTE: The contents of these files can be edited according to the requirement.
Procedure to run Grafana
Open docker-compose.yml and uncomment ia_grafana.
Check ia_influxdbconnector, ia_kapacitor, ia_telegraph are running for time-series data.
Check publisher is running.
#. Use “docker-compose build” to build image. #.
Use “docker-compose up” to run the service.
Prod mode [To be followed when running in PROD mode, skip if DEV mode]
Import ‘ca_certificate.pem’ from ‘build/provision/Certificates/ca’ Directory to your Browser Certifcates.
Steps to Import Certificates
Go to Settings in Chrome
Search Manage Certificates Under Privacy & Security
Select Manage Certificates Option
Under Authorities Tab Click Import Button
With Import Wizard navigate to IEdgeInsights/build/provision/Certificates/ca Dir
Select ca_certificate.pem file
Select All CheckBoxes and Click Import Button.
Dev mode [To be followed when running in DEV mode]
Once ia_grafana service is up, go to http://< host ip >:3000 .
Provide default username: “admin” and password: “admin”.
On “Home Dashboard” page, click on Dashboards icon from the left corner.
Click on Manage Dashboards tab, it will list out all the preconfigured dashboards.
Click on “Point_Data_Dashboard” which is a preconfigured dashboard.
Click on “Panel Title” and select the “edit” option.
Now you will be on Point_Data_Dashboard page and here you can make modifications to the query.
Note
Using the MQTT default port 1883 may result in the following error:
Error starting userland proxy: listen tcp 0.0.0.0:1883: bind: address already in use
To check if port 1883 has been occupied, use command:
$ netstat -tulnp | grep 1883
To stop release port 1883, use command:
$ sudo kill `sudo lsof -t -i:1883`
Access Grafana from the web browser at http://localhost:3000
Steps to execute query
Once landed on the
Point_Data_Dashboard, green spikes visible in the graph are the results of the default queryIn the “FROM” section of query, by default it will have ‘default point_classifier_results WHERE +’, click on ‘default_classifier_results’, drop down will open with the name of Measurements present in InfluxDB. If any other measurement is set the graph will switch to the measurement query results.
In the “SELECT” section, by default it will have ‘field(temperature) mean() +’. Click on ‘temperature’, a drop down will open with the fields tags present in the schema of the measurements set in the FROM section. Select any options the graph will react accordingly.
InfluxDBConnector service stores the timeseries/video metadata received over the EII messagebus to InfluxDB database.
The high level logical flow of InfluxDBConnector service is as below:
InfluxDBConnector service will subscribe to the InfluxDB and start the EII messagebus publisher, EII messagebus subscriber threads, and EII messagebus request reply thread based on PubTopics, SubTopics and QueryTopics configuration.
EII messagebus subscriber thread connects to the PUB socket of messagebus on which the data is published by VideoAnalytics and push it to the InfluxDB
EII messagebus publisher thread will publish the point data ingested by the telegraf and the classifier result coming out of the point data analytics.
EII messagebus reply request service will receive the InfluxDB select query and response with the historical data.