Advanced Guide
Adding New Services to Intel® Edge Insights System Stack
This section provides information about adding a service, subscribing to the EdgeVideoAnalyticsMicroservice([WORK_DIR]/IEdgeInsights/EdgeVideoAnalyticsMicroservice), and publishing it on a new port.
Add a service to the Intel® Edge Insights System stack as a new directory in the IEdgeInsights([WORK_DIR]/IEdgeInsights/) directory. The Builder registers and runs any service present in its own directory in the IEdgeInsights([WORK_DIR]/IEdgeInsights/) directory. The directory should contain the following:
A
docker-compose.ymlfile to deploy the service as a docker container. TheAppNameis present in theenvironmentsection in thedocker-compose.ymlfile. Before adding theAppNameto the mainbuild/eii_config.json, it is appended to theconfigandinterfacesas/AppName/configand/AppName/interfaces.A
config.jsonfile that contains the required config for the service to run after it is deployed. Theconfig.jsonconsists of the following:A
configsection, which includes the configuration-related parameters that are required to run the application.An
interfacessection, which includes the configuration of how the service interacts with other services of the Intel® Edge Insights System stack.
Note
For more information on adding new Intel® Edge Insights System services, refer to the Intel® Edge Insights System sample apps at Samples written in C++, Python, and Golang using the Intel® Edge Insights System core libraries.
The following example shows:
How to write the config.json for any new service
Subscribe to EdgeVideoAnalyticsMicroservice
Publish on a new port
{
    "config": {
        "paramOne": "Value",
        "paramTwo": [1, 2, 3],
        "paramThree": 4000,
        "paramFour": true
    },
    "interfaces": {
        "Subscribers": [
            {
                "Name": "default",
                "Type": "zmq_tcp",
                "EndPoint": "127.0.0.1:65114",
                "PublisherAppName": "EdgeVideoAnalyticsMicroservice",
                "Topics": [
                    "edge_video_analytics_results"
                ]
            }
        ],
        "Publishers": [
            {
                "Name": "default",
                "Type": "zmq_tcp",
                "EndPoint": "127.0.0.1:65113",
                "Topics": [
                    "publish_stream"
                ],
                "AllowedClients": [
                    "ClientOne",
                    "ClientTwo",
                    "ClientThree"
                ]
            }
        ]
    }
}
The config.json file consists of the following key and values:
Value of the
configkey is the config required by the service to run.Value of the
interfaceskey is the config required by the service to interact with other services of Intel® Edge Insights System stack over the Message Bus.The
Subscribersvalue in theinterfacessection denotes that this service should act as a subscriber to the stream being published by the value specified byPublisherAppNameon the endpoint mentioned in value specified byEndPointon topics specified in value ofTopickey.The
Publishersvalue in theinterfacessection denotes that this service publishes a stream of data after obtaining and processing it fromEdgeVideoAnalyticsMicroservice. The stream is published on the endpoint mentioned in value ofEndPointkey on topics mentioned in the value ofTopicskey.The services mentioned in the value of
AllowedClientsare the only clients that can subscribe to the published stream, if it is published securely over the Message Bus.
Note
Like the interface keys, Intel® Edge Insights System services can also have
ServersandClientsinterface keys.For more information on the
interfaceskey responsible for the Message Bus endpoint configuration, refer to README.For the etcd secrets configuration, in the new Intel® Edge Insights System service or app
docker-compose.ymlfile, add the following volume mounts with the rightAppNameenv value:
...
 volumes:
   - ./Certificates/[AppName]:/run/secrets/[AppName]:ro
   - ./Certificates/rootca/cacert.pem:/run/secrets/rootca/cacert.pem:ro
Running With Multiple Use Cases
Builder uses a yml file for configuration. The config yml file consists of a list of services to include. You can mention the service name as the path relative to IEdgeInsights or full path to the service in the config yml file.
To include only a certain number of services in the Intel® Edge Insights System stack, you can add the -f or yml_file flag of builder.py. You can find the examples of yml files for different use cases as follows:
Azure(
[WORK_DIR]/IEdgeInsights/build/usecases/video-streaming-azure.yml)The following example shows running Builder with the -f flag:
python3 builder.py -f usecases/video-streaming.yml
Main Use Cases
Use case |
yaml file |
|---|---|
Video + Time Series |
build/usecases/video-timeseries.yml( |
Video |
build/usecases/video.yml( |
Time Series |
build/usecases/time-series.yml( |
Video Pipeline Sub Use Cases
Use case |
yaml file |
|---|---|
Video streaming with EVAM |
build/usecases/video-streaming-evam.yml( |
Video streaming and historical |
build/usecases/video-streaming-evam-datastore.yml( |
Video streaming with DataCollection |
build/usecases/video-streaming-dcaas-evam-datastore.yml( |
Video streaming with ModelRegistry |
build/usecases/evam-datastore-model-registry.yml( |
When you run the multi-instance config, a build/multi_instance directory is created in the build directory. Based on the number of video_pipeline_instances specified, that many directories of EdgeVideoAnalyticsMicroservice are created in the build/multi_instance directory.
The following section provides an example for running the Builder to generate the multi-instance boiler plate config for 3 streams of video-streaming use case.
If required, you can generate the multi-instance docker-compose.yml and config.json files using the Builder. You can use the -v or video_pipeline_instances flag of the Builder to generate boiler plate config for the multiple-stream use cases. The -v or video_pipeline_instances flag creates the multi-stream boiler plate config for the docker-compose.yml and eii_config.json files.
The following example shows running builder to generate the multi-instance boiler plate config for 3 streams of video-streaming use case:
python3 builder.py -v 3 -f usecases/video-streaming-evam.yml
Using the previous command for 3 instances, the build/multi_instance directory consists of the following directories
EdgeVideoAnalyticsMicroservice1
EdgeVideoAnalyticsMicroservice2
EdgeVideoAnalyticsMicroservice3
Initially each directory will have the default config.json and the docker-compose.yml files that are present within the EdgeVideoAnalyticsMicroservice/eii directory.
      ./build/multi_instance/
      |-- EdgeVideoAnalyticsMicroservice1
      |   |-- config.json
      |   `-- docker-compose.yml
      |-- EdgeVideoAnalyticsMicroservice2
      |   |-- config.json
      |   `-- docker-compose.yml
      |-- EdgeVideoAnalyticsMicroservice3
      |   |-- config.json
      |   `-- docker-compose.yml

You can edit the config of each of these streams within the ``build/multi_instance`` directory. To generate the consolidated ``docker compose`` and ``eii_config.json`` file, rerun the ``builder.py`` command.
Note
The multi-instance feature support of Builder works only for the video pipeline that is the usecases/video-streaming.yml and video-streaming-evam.yml use case and not with any other use case yml files like usecases/video-streaming-storage.yml and so on. Also, it doesn’t work for cases without the
-fswitch. The previous example will work with any positive number for-v.If you are running the multi-instance config for the first time, it is recommended not to change the default
config.jsonfile and thedocker-compose.ymlfile in theEdgeVideoAnalyticsMicroservice/eiidirectory.If you are not running the multi-instance config for the first time, the existing
config.jsonanddocker-compose.ymlfiles in thebuild/multi_instancedirectory will be used to generate the consolidatedeii-config.jsonanddocker-composefiles. If you want to useconfig.jsonanddocker-compose.ymlfiles fromEdgeVideoAnalyticsMicroservice/eiidirectory then delete thebuild/multi_instancedirectory.The
docker-compose.ymlfiles present within thebuild/multi_instancedirectory will have the following:the updated service_name, container_name, hostname, AppName, ports and secrets for that respective instance.
The
config.json filein thebuild/multi_instancedirectory will have the following:the updated Name, Type, Topics, Endpoint, PublisherAppname, ServerAppName, and AllowedClients for the interfaces section.
the incremented RTSP port number for the config section of that respective instance.
Ensure that all containers are down before running the multi-instance configuration. Run the
docker compose down -vcommand or before running thebuilder.pyscript for the multi-instance configuration.
Video Analytics Pipeline
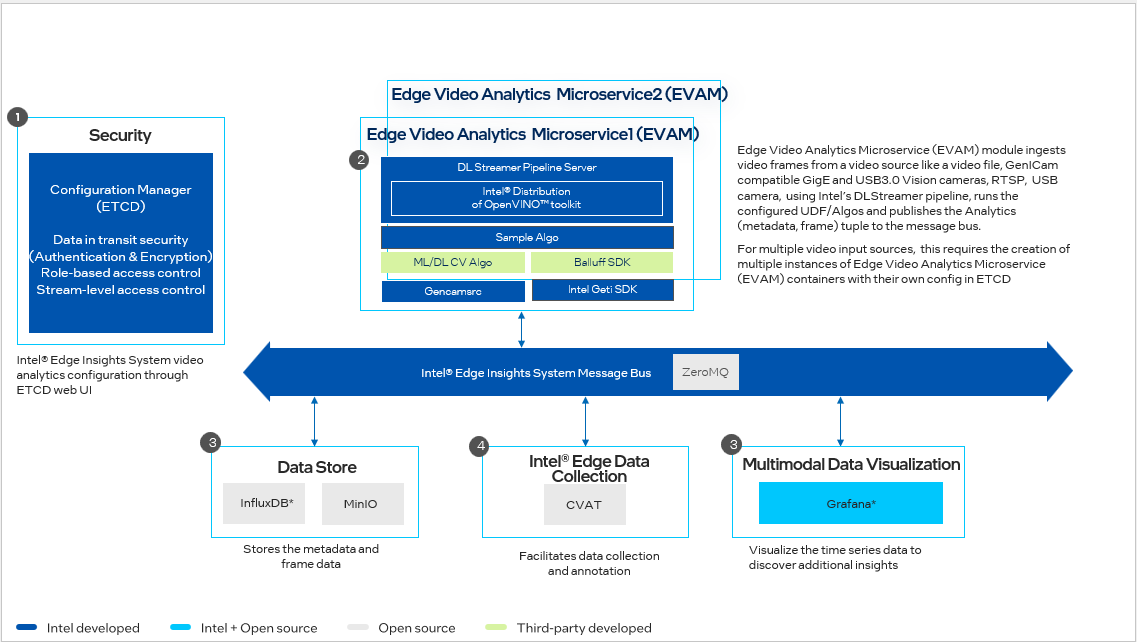
Figure 1. Vision Ingestion and Analytics Workflow
Timeseries Analytics Pipeline
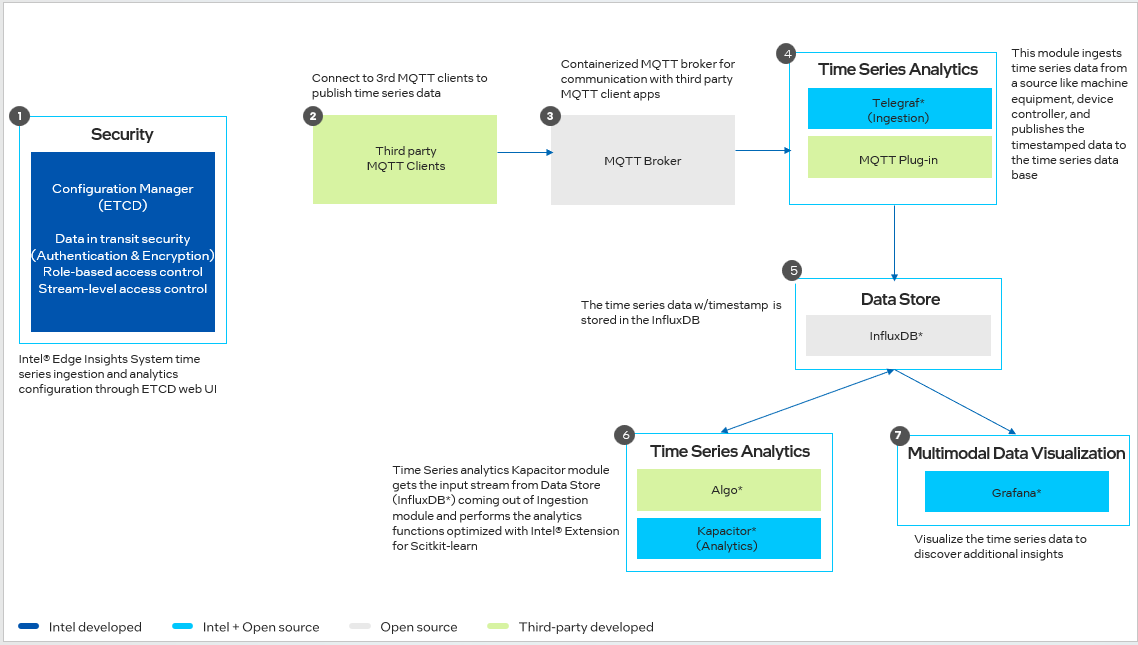
Figure 1. Time Series Ingestion and Analytics Workflow
List of Intel® Edge Insights System Services
Based on requirement, you can include or exclude the following Intel® Edge Insights System services in the [WORKDIR]/IEdgeInsights/build/docker-compose.yml file:
Config Manager Agent
Config Manager Agent is an Intel® Edge Insights System service, that is responsible for the following:
Puts the EII services configs to the Intel® Edge Insights System config manager data store
Additionally in PROD mode, generates the following:
Required config manager data store keys/certificates to interact with EII config manager data store like etcd and puts in the volume mounts to be shared with other Intel® Edge Insights System services
Required messagebus keys for Intel® Edge Insights System services communication
Creates required provisioning folders with the right permissions needed for other Intel® Edge Insights System services via volume mounts
Note: Intel® Edge Insights System Certificates will be re-generated everytime the ConfigMgrAgent service brought up By default, the Intel® Edge Insights System Certificates, configs and secrets (etcd certs, zmq keys, pem/der certs) will not be regenerated upon container restarts and if one has to force this recreation, then you have to delete the docker volume by either running
docker compose down -vordocker volume rm edgeinsightssoftware_vol_cma_status_file
docker exec -it ia_configmgr_agent ./scripts/etcd_capture.sh
ETCD UI
Etcd web UI is exposed via the ConfigMgrAgent service. It can be accessed with the following steps. Configuration changes are made for respective EII container services.
Open the browser and enter the address: https://$(HOST_IP):7071/etcdkeeper/ (when EII is running in secure mode). In this case, CA cert has to be imported in the browser. For insecure mode i.e. DEV mode, it can be accessed at https://$(HOST_IP):7071/etcdkeeper/.
Click on the version of the title to select the version of ETcd. By default the version is V3. Reopening will remember user’s choice.
Right-click on the tree node to add or delete.
For secure mode, authentication is required. User name and password needs to be entered in the dialogue box.
Username is the ‘root’ and default password is located at ETCDROOT_PASSWORD key under environment section in docker-compose.yml
This service is accessed from a remote system at address: https://$(HOST_IP):7071 (when EII is running in secure mode). In this case, CA cert has to be imported in the browser. For insecure mode i.e. DEV mode, it is accessed at http://$(HOST_IP):7071
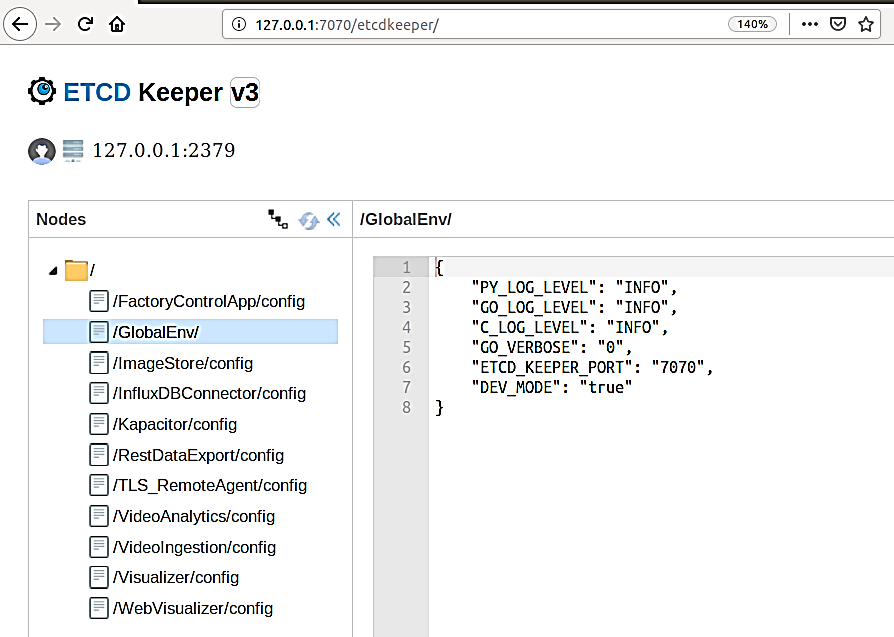
ETCD UI Interface
Note:
If ETCDROOT_PASSWORD is changed, there must be consolidated docker-compose.yml generated using builder script and EII must to be provisioned again. Run the following commands:
cd [WORKDIR]/IEdgeInsights/build
python3 builder.py -f usecases/<usecase.ml>
docker compose up -d ia_configmgr_agent
The ETCD watch capability is enabled for video and timeseries services. It will auto-restart microservices when microservices config/interface changes are done via the EtcdUI interface. Any changes done to these keys are reflected at runtime in EII.
For changes done to any other keys, the EII stack needs to be restarted to be effective. Run the following commands in the working directory, to build or restart EII:
cd [WORKDIR]/IEdgeInsights/build
docker compose down -v
docker compose up -d
Refer prerequisites for video accelerators and prerequisities for cameras before changing the configuration dynamically through ETcdUI.
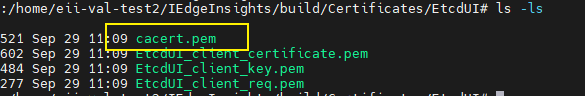
Steps to Add Self Signed Certificate as Trusted in local Browser
Go to Build Directory of the repo
cd <workdir>/IEdgeInsights/build/Certificates/ConfigMgrAgent/
Download Root CA Cert from the EtcdUI
Import the RootCA certificates as Trusted Root Certificate in browser For Chrome Browser, Follow the below steps i. Open Chrome settings, scroll to the bottom, and click Privacy and security ii. Click Manage devices certificates…
 iii. Click the Trusted
Root Certification Authorities tab, then click the Import…
button. This opens the Certificate Import Wizard. Click Next to
get to the File to Import screen. iv. Click Browse… and under
File Type select All Files and select the certificate file you saved
earlier, then click Next.
iii. Click the Trusted
Root Certification Authorities tab, then click the Import…
button. This opens the Certificate Import Wizard. Click Next to
get to the File to Import screen. iv. Click Browse… and under
File Type select All Files and select the certificate file you saved
earlier, then click Next. 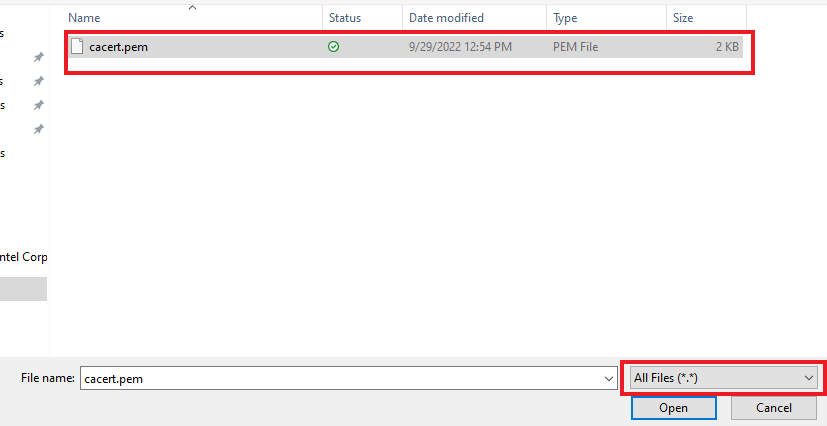 v. Select Place all
certificates in the following store. The selected store should be
Trusted Root Certification Authorities. If it isn’t, click
Browse… and select it. Click Next and Finish vi. Click
Yes on the security warning. vii. Restart Chrome.
v. Select Place all
certificates in the following store. The selected store should be
Trusted Root Certification Authorities. If it isn’t, click
Browse… and select it. Click Next and Finish vi. Click
Yes on the security warning. vii. Restart Chrome.
Edge Video Analytics Microservice
The Edge Video Analytics Microservice (EVAM) combines video ingestion and analytics capabilities provided by Intel® Edge Insights System visual ingestion and analytics modules. This directory provides the Intel® Deep Learning Streamer (Intel® DL Streamer) pipelines to perform object detection on an input URI source and send the ingested frames and inference results using the MsgBus Publisher. It also provides a Docker compose and config file to use EVAM with the Edge insights software stack.
Configuration
Refer edge-video-analytics-microservice/eii/config.json([WORK_DIR]/IEdgeInsights/EdgeVideoAnalyticsMicroservice/eii/config.json) file for the configuration of EVAM. The default configuration will start the
object_detection demo for Intel® Edge Insights System.
The config file is divided into two sections as follows:
Parameter |
Description |
|---|---|
|
Type of Intel® Edge Insights System certs to be created. This should be |
|
Source of the frames. This should be |
|
The name of the DL Streamer pipeline to use. This should correspond to a directory in the pipelines directory. |
|
The version of the pipeline to use. This typically is a subdirectory of a pipeline in the pipelines directory. |
|
Additional information to store with frame metadata. e.g. camera location/orientation of video input |
|
The Boolean flag for whether to publish raw frame. |
|
Encodes the image in jpeg or png format. |
|
Publishes frame/metadata to mqtt broker. |
|
Converts inference results to Intel Edge Data Collection standardized format. |
Note
For
jpegencoding type, level is the quality from 0 to 100. A higher value means better quality.For
pngencoding type, level is the compression level from 0 to 9. A higher value means a smaller size and longer compression time.Encoding elements can be used in the
pipelineas an alternative to specifying theencodingparameters. Refer to the below pipeline for usingjpegencin config.json. .. code-block:: javascript“pipeline”: “multifilesrc loop=FALSE stop-index=0 location=/home/pipeline-server/resources/pcb_d2000.avi name=source ! h264parse ! decodebin ! videoconvert ! video/x-raw,format=BGR ! udfloader name=udfloader ! jpegenc ! appsink name=destination”,
Refer to the below pipeline for using
pngencin config.json. .. code-block:: javascript“pipeline”: “multifilesrc loop=FALSE stop-index=0 location=/home/pipeline-server/resources/pcb_d2000.avi name=source ! h264parse ! decodebin ! videoconvert ! video/x-raw,format=BGR ! udfloader name=udfloader ! videoconvert ! pngenc ! appsink name=destination”,
convert_metadata_to_dcaas_format, when set totruein config.json converts the metadata to Intel Edge Data Collection compatible format. Currently this has been tested forgvadetectelement used in the pipeline. Refer to the below pipeline for example, .. code-block:: javascript“pipeline”: “multifilesrc loop=TRUE stop-index=0 location=/home/pipeline-server/resources/classroom.avi name=source ! h264parse ! decodebin ! queue max-size-buffers=10 ! videoconvert ! video/x-raw,format=BGR ! gvadetect model=/home/pipeline-server/models/object_detection/person/FP32/person-detection-retail-0013.xml model-proc=/home/pipeline-server/models/object_detection/person/person-detection-retail-0013.json ! jpegenc ! appsink name=destination”,
Interfaces
Currently in the Intel® Edge Insights System mode, EVAM supports launching a single pipeline and publishing on a single topic. This implies that in the configuration file (“config.json”), the single JSON object in the Publisher list is where the configuration resides for the published data. For more details on the structure, refer to the documentaions.
EVAM also supports subscribing and publishing messages or frames using the Message Bus. The endpoint details for the Intel® Edge Insights System service you need to subscribe from are to be provided in the Subscribers section in the config([WORK_DIR]/IEdgeInsights/EdgeVideoAnalyticsMicroservice/eii/config.json) file and the endpoints where you need to publish to are to be provided in Publishers section in the config([WORK_DIR]/IEdgeInsights/EdgeVideoAnalyticsMicroservice/eii/config.json) file.
To enable injection of frames into the GStreamer pipeline obtained from Message Bus, ensure to make the following changes:
The source parameter in the config(
[WORK_DIR]/IEdgeInsights/EdgeVideoAnalyticsMicroservice/eii/config.json) file is set to msgbus. Refer to the following code snippet:"config": { "source": "msgbus" }
The pipeline is set to appsrc as source instead of uridecodebin. Refer to the following code snippet:
{
    "pipeline": "appsrc name=source ! rawvideoparse ! appsink name=destination"
}
MQTT publishing
Prior to publishing, MQTT broker/subscriber needs to be configured and started. Broker receives messages from EVAM publisher and forwards the messages to subscribers. Subscriber receives messages from broker by subscribing to a topic. Refer to [mosquitto](https://mosquitto.org/man/mosquitto-8.html) and [mosquitto_sub](https://mosquitto.org/man/mosquitto_sub-1.html) for starting broker/subscriber.
Add below configuration in IEdgeInsights/EdgeVideoAnalyticsMicroservice/eii/config.json to enable publishing to the mqtt broker.
"mqtt_publisher": {
  "host": "<mqtt broker address>",
  "port": 1883
}
host mqtt broker hostname or IP address
port port to connect to the broker
topic topic to which message will be published. Defaults to edge_video_analytics_results (optional)
- publish_frame whether to publish only metadata or both frames and metadata can be published to the mqtt broker. Defaults to false (optional)
When publish_frame is false, only metadata will be published.
When publish_frame is true, both metadata and frame will be published.
qos quality of service level to use which defaults to 0. Values can be 0, 1, 2. (optional)
More details on the QoS levels can be found [here](https://www.hivemq.com/blog/mqtt-essentials-part-6-mqtt-quality-of-service-levels)
protocol protocol version to use which defaults to 4 i.e. MQTTv311. Values can be 3, 4, 5 based on the versions MQTTv3, MQTTv311, MQTTv5 respectively (optional)
MQTT publishing to broker could be over a secure communication channel providing encryption and authentication over SSL/TLS. MQTT broker should be configured for SSL/TLS connection. More details on the broker configuration options can be found [here](https://mosquitto.org/man/mosquitto-conf-5.html) and the files required for SSL/TLS support are specified [here](https://mosquitto.org/man/mosquitto-tls-7.html).
Add below configuration in IEdgeInsights/EdgeVideoAnalyticsMicroservice/eii/config.json to enable secure publishing to the mqtt broker.
"mqtt_publisher": {
  "host": "<mqtt broker address>",
  "port": 8883,
  "tls": {
    "ca_cert": "/MqttCerts/ca.crt",
    "client_key": "/MqttCerts/client/client.key",
    "client_cert": "/MqttCerts/client/client.crt"
  }
}
Refer to the document MQTT docs for details on prerequisities, configuration, filtering and error handling.
MQTT publishing can be enabled along with Intel® Edge Insights System Message Bus publishing.
Object Tracking
For enabling object tracking in the pipeline, refer object_tracking
Camera Configurations
You need to make changes to the config.json([WORK_DIR]/IEdgeInsights/EdgeVideoAnalyticsMicroservice/eii/config.json) and the templates section of the pipeline.json([WORK_DIR]/IEdgeInsights/pipeline.json) files while configuring cameras.
By default the pipeline.json([WORK_DIR]/IEdgeInsights/pipeline.json) file has the RTSP camera configurations.
The camera configurations for the Edge Video Analytics Microservice module are as follows:
GenICam GigE or USB3 Cameras
Prerequisites for Working with the GenICam Compliant Cameras
The following are the pre-requisites for working with the GeniCam compliant cameras.
For GenICam compliant GigE cameras:
Update the ETCD_HOST key with the current system’s IP in the .env([WORK_DIR]/IEdgeInsights/build/.env) file.
ETCD_HOST=<HOST_IP>
Add network_mode: host in the docker-compose.yml([WORK_DIR]/IEdgeInsights/EdgeVideoAnalyticsMicroservice/eii/docker-compose.yml) file and comment/remove networks and ports sections.
Make the following changes in the docker-compose.yml([WORK_DIR]/IEdgeInsights/EdgeVideoAnalyticsMicroservice/eii/docker-compose.yml) file.
ia_edge_video_analytics_microservice:
  # Add network mode host
  network_mode: host
  ...
  environment:
  ...
    # Please make sure only environment variables are added under environment section in docker compose file.
    # Add HOST_IP to no_proxy and ETCD_HOST
    no_proxy: "<eii_no_proxy>,${RTSP_CAMERA_IP},<HOST_IP>"
    ETCD_HOST: ${ETCD_HOST}
  ...
  # Comment networks section will throw an error when network mode host is used.
  # networks:
    # - eii
  # Comment ports section as following
  # ports:
  #   - '65114:65114'
For GenICam compliant USB3.0 cameras:
Increase the USBFS buffer size to at least 256 MB or even more depending on your application.
By default, USB-FS on Linux system allows only 16MB buffer limit which will not be sufficient to work with high framerate/resolution cameras and multi-camera setup. In such scenarios increase USB-FS buffer size. Check USB-FS buffer size by using command cat /sys/module/usbcore/parameters/usbfs_memory_mb. If it is less than 256MB, then follow these [steps to increase the USBFS value](https://assets.balluff.com/documents/DRF_957345_AA_000/Troubleshooting_section_Checklist_USB3_Settings.html#Troubleshooting_Checklist_USB3_IncreasingTheKernelMemory).
Refer the following pipeline for configuring the config.json([WORK_DIR]/IEdgeInsights/EdgeVideoAnalyticsMicroservice/eii/config.json) file for GenICam GigE/USB3.0 cameras.
"pipeline": "gencamsrc serial=<DEVICE_SERIAL_NUMBER> pixel-format=<PIXEL_FORMAT> name=source ! videoconvert ! video/x-raw,format=BGR ! appsink name=destination"
After making the changes, run the command python3 builder.py -f <usecase> from [WORKDIR]/IEdgeInsights/build directory to generate the consolidated files.
For more information or configuration details for the GenICam GigE or the USB3 camera support, refer to the Generic Plugin docs.
For other cameras such as RSTP, and USB (v4l2 driver compliant) revert the changes that are mentioned in this section.
Refer to the Basler docs for more information/configuration on Basler camera.
Note
Generic Plugin can work only with GenICam compliant cameras and only with gstreamer ingestor.
The above gstreamer pipeline was tested with Basler and IDS GigE cameras.
If serial is not provided, then the first connected camera in the device list will be used.
If pixel-format is not provided then the default mono8 pixel format will be used.
If width and height properties are not set then gencamsrc plugin will set the maximum resolution supported by the camera.
Camera field of view getting cropped is an expected behavior when a lower resolution is set using height or width parameter. Setting these parameters would create an Image ROI which will originate from the top left corner of the sensor. Refer https://docs.baslerweb.com/image-roi for more details.
Using a higher resolution might have other side effects like “lag issue in the pipeline” when the model is compute intensive.
By default, exposure-auto property is set to on. If the camera is not placed under sufficient light then with auto exposure, exposure-time can be set to very large value which will increase the time taken to grab frame. This can lead to No frame received error. Hence it is recommended to manually set exposure as in the following sample pipeline when the camera is not placed under good lighting conditions.
throughput-limit is the bandwidth limit for streaming out data from the camera(in bytes per second). Setting this property to a higher value might result in better FPS but make sure that the system and the application can handle the data load otherwise it might lead to memory bloat.
- Refer the below example pipeline to use the above mentioned properties:
`javascript
"pipeline": "gencamsrc serial=<DEVICE_SERIAL_NUMBER> pixel-format=ycbcr422_8 width=1920 height=1080 exposure-time=5000 exposure-mode=timed exposure-auto=off throughput-limit=300000000 name=source ! videoconvert ! video/x-raw,format=BGR ! appsink name=destination"
`
By default, USB-FS on Linux system allows only 16MB buffer limit which might not be sufficient to work with high framerate, high resolution cameras and multiple camera setup. In such scenarios configure USB-FS to increase the buffer memory limit for USB3 vision camera. While using the basler USB3.0 camera, ensure that the USBFS limit is set to 1000MB. You can verify this value by using command cat /sys/module/usbcore/parameters/usbfs_memory_mb. If it is less than 256MB, then follow these [steps to increase the USBFS value](https://assets.balluff.com/documents/DRF_957345_AA_000/Troubleshooting_section_Checklist_USB3_Settings.html#Troubleshooting_Checklist_USB3_IncreasingTheKernelMemory).
If the GenICam cameras do not get initialized during the runtime, then on the host system, run the docker system prune command. After that, remove the GenICam specific semaphore files from the /dev/shm/ path of the host system. The docker system prune command will remove all the stopped containers, networks that are not used (by at least one container), any dangling images, and build cache which could prevent the plugin from accessing the device.
Known Limitation:
If one observes Feature not writable message while working with the GenICam cameras, then reset the device using the camera software or using the reset property of the Generic Plugin. For more information, refer Gencamsrc docs.
Xiris Cameras
Prerequisites for Working with Xiris Camera
The following are the prerequisites for working with Xiris cameras.
Update the ETCD_HOST key with the current system’s IP in the .env([WORK_DIR]/IEdgeInsights/build/.env) file.
ETCD_HOST=<HOST_IP>
Add network_mode: host in the docker-compose.yml([WORK_DIR]/IEdgeInsights/EdgeVideoAnalyticsMicroservice/eii/docker-compose.yml) file and comment/remove networks and ports sections.
Make the following changes in the docker-compose.yml([WORK_DIR]/IEdgeInsights/EdgeVideoAnalyticsMicroservice/eii/docker-compose.yml) file.
ia_edge_video_analytics_microservice:
  # Add network mode host
  network_mode: host
  # Make sure that the above commands are not added under the environment section and also take care about the indentations in the compose file.
  ...
  environment:
  ...
    # Add HOST_IP to no_proxy and ETCD_HOST
    no_proxy: "<eii_no_proxy>,${RTSP_CAMERA_IP},<HOST_IP>"
    ETCD_HOST: ${ETCD_HOST}
  ...
  # Comment networks section will throw an error when network mode host is used.
  # networks:
    # - eii
  # Comment ports section as following
  # ports:
  #   - '65114:65114'
The ip_address parameter in the config(
[WORK_DIR]/IEdgeInsights/EdgeVideoAnalyticsMicroservice/eii/config.json) file must be set to IP address of the camera.The frame_rate parameter in the config(
[WORK_DIR]/IEdgeInsights/EdgeVideoAnalyticsMicroservice/eii/config.json) file must be set to the desired ingestion frame rate from the camera.The pixel_depth parameter in the config(
[WORK_DIR]/IEdgeInsights/EdgeVideoAnalyticsMicroservice/eii/config.json) file must be set to the required pixel depth (in bits). It can take one of the following four values: 8, 12, 14 or 16. Note that the pixel_depth parameter has no bearing on the monochrome camera XVC-1000 that has been tested.The flip_mode parameter in the config(
[WORK_DIR]/IEdgeInsights/EdgeVideoAnalyticsMicroservice/eii/config.json) file must be set accordingly. It describes how an image is flipped. It can take one of the following four values: “None”, “FlipVertical”, “FlipHorizontal” or “FlipBoth”.None: No flip performed.
FlipVertical: Flip the image vertically.
FlipHorizontal: Flip the image horizontally.
FlipBoth: Flip both horizontally and vertically. Equivalent to 180 degree rotation.
The set_sharpen parameter in the config(
[WORK_DIR]/IEdgeInsights/EdgeVideoAnalyticsMicroservice/eii/config.json) sets a value which controls if a sharpening filter is applied to the image or not. This parameter can take either “true” or “false” values.The focus parameter in the config(
[WORK_DIR]/IEdgeInsights/EdgeVideoAnalyticsMicroservice/eii/config.json) file sets a value indicating the commanded position of the focus adjustment.The tone_map_curve_type parameter in the config(
[WORK_DIR]/IEdgeInsights/EdgeVideoAnalyticsMicroservice/eii/config.json) file sets the shape of the tonemapping curve. Tone mapping is the process of building a displayable image from an HDR image. The type of curve specified controls the distribution of the contrast in the displayable image, and in some cases can be used to adjust the color balance of the image. The different values this parameter can take are:linear: means that the contrast is mapped evenly.
gamma: accentuates the contrast in the darker areas using a y = pow(x, gamma) type of relationship.
scurve (unsupported at the moment): uses a curve in the general form of y = 1 / (1 + pow((alpha * x) / (1 - x), -beta).
The tone_map_curve_value parameter in the config(
[WORK_DIR]/IEdgeInsights/EdgeVideoAnalyticsMicroservice/eii/config.json) file sets a value to the above mentioned curve type.For linear curve, set this parameter value to 1
For gamma curve, it can take values in the range [-5, 5]. This is to reflect the WeldStudio’s gamma slider range. Note: WeldStudio is the camera GUI software from Xiris
For scurve: unsupported at the moment
Refer to the following code snippet:
"config": {
    "xiris": {
       "ip_address": "<set-xiris-camera-IP-here>",
       "frame_rate": 10,
       "pixel_depth": 8.
       "flip_mode": "FlipHorizontal",
       "set_sharpen": "false",
       "focus": 0,
       "tone_map_curve_type": "gamma",
       "tone_map_curve_value": "0"
    }
}
The source parameter in the config(
[WORK_DIR]/IEdgeInsights/EdgeVideoAnalyticsMicroservice/eii/config.json) file must be set toingestor. Refer to the following code snippet:"config": { "source": "ingestor" }
The pipeline is set to
appsrcas source andrawvideoparseelement should be updated with theheight,widthandformatof the Xiris frame. Refer to the following code snippet:{ "pipeline": "appsrc name=source ! rawvideoparse height=1024 width=1280 format=gray8 ! videoconvert ! video/x-raw,format=BGR ! appsink name=destination" }
Note
Xiris Camera model tested is XVC-1000(monochrome)
Only PixelDepth=8 (camera outputs 8 bits per pixel) is supported. In case of any frame rendering issues please check PixelDepth value from the logs and make sure it is set to 8.
In case a wrong or an invalid IP is provided for connecting to Xiris camera using
XirisCameraIPenv variable, ingestion will not work and there will be no error logs printed. Make sure correct IP is provided for ingestion to work.To find the IP address of the camera please use the GUI tool provided by the Xiris (currently available on windows) or run the LinuxSample app under weldsdk installation directory on the hostsystem to find the available cameras.
RTSP Cameras
Update the RTSP camera IP or the simulated source IP to the RTSP_CAMERA_IP variable in the .env([WORK_DIR]/IEdgeInsights/build/.env) file. Refer to the RTSP docs. for information/configuration on RTSP camera.
Refer the following configuration for configuring the config.json(
[WORK_DIR]/IEdgeInsights/EdgeVideoAnalyticsMicroservice/eii/config.json) file for RTSP camera.
"pipeline": "rtspsrc location=\"rtsp://<USERNAME>:<PASSWORD>@<RTSP_CAMERA_IP>:<PORT>/<FEED>\" latency=100 name=source ! rtph264depay ! h264parse ! vaapih264dec ! vaapipostproc format=bgrx ! videoconvert ! video/x-raw,format=BGR ! appsink name=destination"
Note
The RTSP URI of the physical camera depends on how it is configured using the camera software. You can use VLC Network Stream to verify the RTSP URI to confirm the RTSP source.
USB v4l2 Cameras
For information or configurations details on the USB cameras, refer to USB v4l2 docs.
Refer the following configuration for configuring the config.json(
[WORK_DIR]/IEdgeInsights/EdgeVideoAnalyticsMicroservice/eii/config.json) file for USB v4l2 camera.
"pipeline": "v4l2src device=/dev/<DEVICE_VIDEO_NODE> name=source ! video/x-raw,format=YUY2 ! videoconvert ! video/x-raw,format=BGR ! appsink name=destination"
Anomalib
Anomalib is a deep learning library that aims to collect state-of-the-art anomaly detection algorithms for benchmarking on both public and private datasets. Anomalib provides several ready-to-use implementations of anomaly detection algorithms described in the recent literature, as well as a set of tools that facilitate the development and implementation of custom models.
For more information on anomalib, refer to Anomalib docs .
Supported version in EVAM
v0.7.0
Training
Anomalib includes ready to use anomaly detection models. A model can be trained based on default config provided for the model or can be customized for a particular dataset and category.
More details on Training and exporting a trained model can be found in training section of this [document](https://github.com/openvinotoolkit/anomalib/tree/v0.7.0).
Supported models in EVAM
Currently a subset of available anomaly detection models in anomalib are supported in EVAM: - [STFPM](https://github.com/openvinotoolkit/anomalib/blob/v0.7.0/src/anomalib/models/stfpm) - [PADIM](https://github.com/openvinotoolkit/anomalib/blob/v0.7.0/src/anomalib/models/padim) - [DFM](https://github.com/openvinotoolkit/anomalib/blob/v0.7.0/src/anomalib/models/dfm)
Inference using Anomalib UDF
When trained/exported model is available, the UDF IEdgeInsights/EdgeVideoAnalyticsMicroservice/user_scripts/udfs/python/anomalib_udf/ can be used for running inference. As an example, a custom STFPM model trained on [Amazon’s Visual Anomaly (Visa) dataset](https://registry.opendata.aws/visa/) is included to detect anomalies in PCB.
Inferencing could be configured to be based on - openvino - default openvino inferencer provided by Anomalib or - openvino_nomask - custom openvino no mask inferencer derived from openvino inferencer which allows for image resolution to not have an impact on inference time.
Inference using Anomalib UDF
When trained/exported model is available, anomalib udf can be used for running inference. As an example, a custom STFPM model trained on [Amazon’s Visual Anomaly (Visa) dataset](https://registry.opendata.aws/visa/) is included to detect anomalies in PCB.
Inferencing could be configured to be based on - openvino - default openvino inferencer provided by Anomalib or - openvino_nomask - custom openvino no mask inferencer derived from openvino inferencer which allows for image resolution to not have an impact on inference time.
Refer the below sample configuration to run the Anomalib UDF.
"udfs": [
          {
              "device": "CPU",
              "task": "classification",
              "inferencer": "openvino_nomask",
              "model_metadata": "/home/pipeline-server/udfs/python/anomalib_udf/stfpm/metadata.json",
              "name": "python.anomalib_udf.inference",
              "type": "python",
              "weights": "/home/pipeline-server/udfs/python/anomalib_udf/stfpm/model.onnx"
          }
      ]
Note
inferencer config parameter can be used to change b/w the default openvino inferencer provided by anomalib and the openvino_nomask inferencer which inherits from openvino inferencer.
Person Detection
This Geti udf supports deploying a project for local inference with OpenVINO using Intel® Geti™ SDK python package. It uses a Geti based person detection model.
Refer the below config for the default config used for this Geti udf:
"udfs": [
           {
               "name": "python.geti_udf.geti_udf",
               "type": "python",
               "device": "CPU",
               "deployment": "./resources/geti/person_detection/deployment",
               "visualize": "false",
               "metadata_converter": "geti_to_dcaas"
           }
       ]
Add Label
This is developed to facilitate anomalib training data collection where one is pointing camera on anomalous or non-anomalous product. While you point a camera to a given category of scene, default label value which is a configurable field (“anomalous”: “true” or “anomalous”: “false”) in this UDF is applied to every frame. This process needs to be repeated to every type of class (“anomalous”: “true” or “anomalous”: “false”) that you want to capture from the scene for training.
The following example shows the configuration for add label UDF.
"udfs": [
    {
        "type": "python",
        "name": "python.add_label",
        "anomalous": "true"
    }
]
There is no AI model involved. It is a simple UDF script that labels the data with default label values and saves in DataStore which is further expected to be consumed by Visualizer microservice and Intel® Edge Data Collection microservice.
Compatibility with other microservices
Visualizer
In case you want to add your custom UDF and make it compatible with Visualizer, ensure that the following fields are present in the metadata published by the UDF. Any missing key here will result in an error.
Keys with sample values.
"task": "classification"
"detected_class": "anomalous"
"anomalous": predictions.pred_score
Note
task: Refers to classification/object_detection model
detected_class: Refers to anomalous/non-anomalous or the applicable class name
anomalous: Refers to the confidence score for anomalous class or the applicable class
Edge Data Collection
In case you want to add your custom UDF and make it compatible with Intel® Edge Data Collection microservice, ensure that the following fields are present in the metadata published by the UDF. Any missing key here will result in an error.
Keys with sample values.
"last_modified": time_ns()
"export_code": 0
"annotation_type": "auto"
"annotations": {"objects":[]}
Note
last_modified: Mandatory. Refers to the last time the metadata was modified. The value should be in nanoseconds.export_code: Mandatory. Refers to the status of the data export. The following export codes are supported:0: Data has not been exported1: Data has been exported
annotation_type: Mandatory. Refers to the type of annotation. The following annotation types are supported:auto: for auto annotationhuman: for human annotation
annotations: Mandatory. Refers to the annotations for objects detection in the image.objects: A list of objects detected in the image. If present, each object should have the following keys:label: The label of the objectscore: The confidence score of the objectbbox: The bounding box of the object. It is list of bbox coordinates in top-left and bottom-right format. For example,[x1, y1, x2, y2]
It is important that the objects within the annotations dictionary have bounding box dimensions in top-left and bottom-right format. Some models may have bounding box predicted as top-left coordinates, width and height. In that case, the UDF must convert it to the expected top-left and bottom-right format to avoid incorrect bounding box dimensions during data export or visualization.
Data Store Microservice
Data Store microservice supports Video and Time series use cases. The Data Store microservice supports two type of Data:
JSON Datatype (InfluxDB)
Blob Datatype (MinIO Object Storage)
DataStore Configuration
The configurations for Data Store service is added in etcd. The
configuration details are available in the docker-compose file, under
AppName in the environment section of the app’s service definition.
For the scenario, when the AppName is DataStore, the following
example shows how the app’s config will look for /DataStore/config
key in etcd:
"datatypes": {
  "json": {
       "host" : "ia_influxdb",
       "port": 8086,
       "dbname": "datain",
       "verifySsl": false,
       "ignoreKeys": [
         "defects"
       ],
       "tagKeys": [],
       "retention": "1h",
       "topics": [
         "*"
       ],
       "retentionPollInterval": "60s"
   },
  "blob": {
       "host" : "ia_miniodb",
       "port": 9000,
       "dbname": "image-store-bucket",
       "retention": "1h",
       "topics": [
         "edge_video_analytics_results"
       ],
       "retentionPollInterval": "60s",
       "ignoreKeys": [
         "model-registry"
       ]
  }
}
The following are the details of the keys in the above config: -
datatype (required)
The
hostis optional parameter in configuration, which is used for connecting the respective Database servers (Local/Remote). If the parameter is not provided, by default JSON Datatype will be selected withia_influxdband Blob Datatype will be selected withia_miniodbThe
portis optional parameter in configuration, which is used for connecting the respective Database servers port(Local/Remote). If the parameter is not provided, by default JSON Datatype will be selected with8086forInflux DBand Blob Datatype will be selected with9000forMinio Object StorageThe
topicskey determines which messages are to be processed by the corresponding DB microservice. Only the messages with a topic listed intopicskey are processed by the individual module. Iftopicscontain\*, then all the messages are processed. - Theretentionis required parameter in configuration. The retention parameter specifies the retention policy to apply for the images stored in MinIO object storage. In case of infinite retention time, set it to ““. Suitable duration string value as mentioned at https://golang.org/pkg/time/#ParseDuration.The
retentionPollIntervalis required parameter in configuration. Used to set the time interval for checking images for expiration. Expired images will become candidates for deletion and no longer retained. In case of infinite retention time, this attribute will be ignored. Suitable duration string value as mentioned at https://golang.org/pkg/time/#ParseDurationThe
ignoreKeysis list of string which allows to add keys. For JSON, this list will be used parser to choose whether to parse the nested json or save as string to database. For BLOB, this list will be used for not applying the retention policy for the respective buckets.
restserver
The
Portkey is used to configure the port exposed to access the REST APIs.Note: Same should be updated under Port section in* docker-compose.yml
The
cacertnamekey is filename of pem certificateThe
caprivatekeykey is filename of pem keyTo use different certificates for
restserverchange the LHS of the volume mount path in docker-compose.yml for line item./Certificates/DataStore_Server/:/run/secrets/RestAPI_Server:ro, update thecacertnameandcaprivatekeywith respective file names in config.jsonRefer Tutorial 2 in REST API Endpoints.
Swagger(API Documentation)is available at/docs. To access swagger, after starting data store open browser and enter urlhttps://<ip>:8889. ForDEV_MODEastrue, usehttp://<ip>:8889Note: Please note due to some cert issue, the Data Store swagger documentation at https://localhost:8889 in PROD mode OR http://localhost:8889 in DEV mode will not be accessible.
By default, both the DBs will be enabled. If you want to disable any of the above DBs, remove the corresponding key and its value from the config.
For Example, if you are not using MinIO object storage, you can disable the same and modify the config as below:
"datatypes": {
  "json": {
       "host" : "ia_influxdb",
       "port": 8086,
       "dbname": "datain",
       "verifySsl": false,
       "ignoreKeys": [
         "defects"
       ],
       "tagKeys": [],
       "retention": "1h",
       "topics": [
         "*"
       ],
       "retentionPollInterval": "60s"
   }
}
For Backuping up the Json and Blob data following configuration is provided in config.json
"storage": {
  "enabled": false,
  "type": "local",
  "autoSyncIntervalInSec": 3600,
  "blobIdentifier": "img_handle"
}
NOTE: Enabling storage feature with type
localas above will backup both json and blob data which would lead to high disk space consumption on the host system and the consumption will be more in case of multi streams.For example 1hr of data for a single stream with image resolution as 1920 * 1200 consumes 3.1Gb of disk space.
The following are the details of the keys in the above config:
The
enabledis by default false but if the backup of data is needed then set theenabledflag as true.The
typedenotes the type of storage needed i.e. either local or cloud.The
autoSyncIntervalInSecdenotes the time interval in seconds indicating how often the database had to be queried to backup the data.The
blobIdentifierdenotes the identifier used for BLOB data. For example below is a Edge Video Analytics Microservice’s data snipet where the blobIdentifier will beimg_handle
{'height': 1200, 'width': 1920, 'channels': 3, 'img_handle': 'cd3a30e5c3', 'defects': [], 'encoding_type': 'jpeg', 'encoding_level': 95}
- NOTE
The backed up data is stored at /opt/intel/eii/data/ds_backup/ folder which consist of two subfolder one for json data and one for blob data.
The json data is stored in the json format with filename is made up of json i.e edge_video_analytics_results_2024-01-23-14_44_58.json
For blob data the format is taken from ‘encoding_type’ field of Edge Video Analytics Microservice’s data with file name is made up of and blob data is stored in the folder blob/ i.e blob/2024-02-01-16:25:32/edge_video_analytics_results_ff875f1df.jpeg
JSON Datatype (InfluxDB)
For nested json data, by default, Data Store will flatten the nested
json and push the flat data to InfluxDB to avoid the flattening of any
particular nested key mention the tag key in the
config.json file. Currently the defects key is
ignored from flattening. Every key to be ignored has to be in a new
line.
For example,
ignore_keys = [ "Key1", "Key2", "Key3" ]
By default, all the keys in the data schema will be pushed to InfluxDB as fields. If tags are present in data schema, it can be mentioned in the config.json file then the data pushed to InfluxDB, will have fields and tags both. At present, no tags are visible in the data scheme and tag_keys are kept blank in the config file.
For Example,
tag_keys = [ "Tag1", "Tag2" ]
Blob Datatype (MinIO Object Storage)
The MinIO object storage primarily subscribes to the stream that comes out of the EdgeVideoAnalayticsMicroservice app via Intel® Edge Insights System messagebus and stores the frame into minio for historical analysis.
The high-level logical flow of MinIO object storage is as follows:
The Intel® Edge Insights System messagebus subscriber in MinIO object storage will subscribe to the EdgeVideoAnalayticsMicroservice published classified result (metadata, frame) on the Intel® Edge Insights System messagebus. The img_handle is extracted out of the metadata and is used as the key and the frame is stored as a value for that key in minio persistent storage.
Intel® Edge Insights System Msgbus Interface
Data Store will start the Intel® Edge Insights System messagebus Publisher, Intel® Edge Insights System messagebus Subscriber threads, and Intel® Edge Insights System messagebus request reply thread based on PubTopics, SubTopics and Server configuration.
Intel® Edge Insights System messagebus Subscriber thread connects to the PUB socket of Intel® Edge Insights System messagebus on which the data is published by EdgeVideoAnalayticsMicroservice and push it to the InfluxDB(Metadata).
Intel® Edge Insights System messagebus Publisher thread will publish the point data ingested by the telegraf and the classifier result coming out of the point data analytics.
Intel® Edge Insights System Msgbus/REST Request-Response Interface
For a historical analysis of the stored classified images or metadata, Data Store starts a Intel® Edge Insights System Messagebus/gRPC/REST Request-Response Interface server which provides the read, write, update, list, clear, delete interfaces.
The payload format for Intel® Edge Insights System Msgbus/gRPC Request-Response Endpoints is available as part of Tutorial 1 in Intel® Edge Insights System Msgbus/gRPC Request-Response Endpoints.
The payload format for Intel® Edge Insights System REST API Endpoints is available as part of Tutorial 2 in REST API Endpoints.
Note: 1. The gRPC request-response interface server currently supports DEV mode only.
DB Server Supported Version
Currently, DB Handlers are supported and tested with the following versions for respective DB Servers:
S.No |
DB Server |
Supported Version |
|---|---|---|
1 |
Influx |
1.8.7 |
2 |
Minio |
RELEASE 2020-12-12T08:39:07Z |
Intel® Edge Data Collection
Intel® Edge Data Collection is a microservice that helps in collection and annotation of input video data. The collected/annotated data can then be used for AI model training/fine-tuning and statistical analysis.
Note: We’ll be using the terms Intel® Edge Data Collection, EdgeDataCollection and data collection microservice interchangeably in this document. They refer to the same microservice.
Features and Modes
The microservice can offer the following features based on the configuration it is run.
Features |
Description |
|---|---|
Human Anntoation |
Allows user to review and/or annotate images stored in DataStore as tasks in CVAT |
Auto Anntoation |
Allows the microservice to annotate images live as is being ingested from source i.e. EVAM and store in DataStore. The annotating algorithm is a user defined functions (UDFs) configurable in the microservice’s |
Remote Storage |
Allows user to export object detection data or classfication data from DataStore in MS-COCO and imagenet data formats respectively to a persistent file storage. |
Data Filter |
Drops frames live as is being ingested from source i.e. EVAM to avoid storing in DataStore. The filtering algorithm a user defined functions (UDFs) and is configurable in the microservice’s |
Configuration Changes and Deployment behavior
Being deployed as part of Edge Insights System microservices stack, the behavior of Edge Data Collection microservice depends on the configuration currently set for it in the consolidated eii_config.json.
This configuration file can be found in [WORK_DIR]/IEdgeInsights/build/eii_config.json. The microservice’s configuration is under DataCollectionMicroservice/config section.
By default, human annotation is enabled where as features such as remote storage, auto annotation and data filter are disabled. Users can enable these features by updating the configuration in the following two ways.
If user wants to persist the change, the consolidated
eii_config.jsonhas to be updated before a redeployment. Upon re-deployment, the microservice will pick up the new configuration and run accordingly.If user wants to make a temporary change without re-deploying the entire Edge Insights System stack, the microservice’s configuration can be updated in the EtCd UI. The changes will restart the microservice and run as per the new configuration.
The description of each feature alongwith their sub-configuration and the steps to enable them are provided below.
Human Annotation Mode
The data collection microservice allows user to select a set of images already stored in DataStore and add/update annotations to them. The annotation tool used is CVAT offered as a separate microservice but is provided along with data collection microservice. Users can choose which set of images to annotate alongwith other options provided as part of data collection microservice’s configuration.
In order to enable human annotation, the following steps need to be followed.
Pre-requsites
Edit the
[WORK_DIR]/IEdgeInsights/build/.envfile and add the entries that are related to CVAT as shown below.# CVAT related config CVAT_SUPERUSER_NAME=cvat_user # For CVAT_SUPERUSER_PASSWORD, the length must be a minimum of 9 characters (alphanumerics). Do not use commonly used passwords. Do not use any special characters in your password. Ensure that the password is not entirely numeric. Example, somerandom123. More rules to be followed for successful password creation can be found here: https://docs.djangoproject.com/en/2.0/topics/auth/passwords/#password-validation CVAT_SUPERUSER_PASSWORD= # For CVAT_HOST, provide the host machine IP if the system is connected to an external network - In this case, CVAT can be accessed from any machine on the same network. If the system is not connected to an external network then provide the docker system host IP - In this case, CVAT can only be accessed from the same machine where it is running. The docker system host IP can be obtained by running the following command: # docker network inspect bridge -f '{{range .IPAM.Config}}{{.Gateway}}{{end}}' # Generally, the IP is found to be 172.17.0.1, but can vary and hence it is better to always obtain it from the above command CVAT_HOST=172.17.0.1 CVAT_PORT=8443 CVAT_HTTPS=true
Note: In order to ensure successful CVAT_SUPERUSER_PASSWORD creation, length must be a minimum of 9 characters (alphanumerics). Do not use commonly used passwords or any special characters in it. Ensure that the password is not entirely numeric. More rules to be followed for successful password creation can be found here. Examples of commonly used passwords to avoid can be found here
Configuration
The configuration for the human annotation sub-section can be found in the microservice’s config.json file, under the annotation section. The default configuration is as follows, but users can modify the values according to their needs.
"annotation": {
    "categories": [
        "anomalous"
    ],
    "human_annotation": {
        "enabled": true,
        "image_selection_for_annotation_policies": {
            "img_handles": [],
            "last_x_seconds_of_images": 0,
            "start_date": "2024-01-01T00:00:00Z",
            "end_date": "2024-01-01T13:00:00Z",
            "image_type": "annotated",
            "db_topics": [
                "edge_video_analytics_results"
            ]
        },
        "task_sync_policies": {
            "is_auto_sync": true,
            "auto_sync_interval_in_sec": 30
        },
        "cvat": {
            "task_creation_policies": {
                "max_images_per_task": 100,
                "max_images_per_job": 5,
                "max_images_per_live_task": 5
            },
            "login_retry_limit": 10
        }
    },
    "auto_annotation":{
        "enabled": false,
        ...
    }
},
Options to configure “human_annotation” in config.json(
[WORK_DIR]/IEdgeInsights/DataCollectionMicroservice/config.json)annotation.categoriesMandatory. Specify the categories which need to be supported in CVAT for human annotation.
Example:
"categories":["vehicle", "Person"]
enabledMandatory. Ensure that you have set
"enabled": truefor “human_annotation”Also ensure that you have set
"enabled": falsefor “auto_annotation” since human annotation and auto annotation should not be enabled at the same time.
image_selection_for_annotation_policies
start_dateandend_dateUpdate the above policies in YYYY-MM-DDTHH:MM:SSZ format.
Example:
"start_date": "2022-09-02T00:00:00Z"and"end_date": "2022-09-10T00:00:00Z"if you would like to see CVAT tasks for images in image store ranging from 2022-09-02 (inclusive) to 2022-09-10 (inclusive).Note: Ensure that both
start_dateandend_dateare within the retention policy of DataStore. Refer DataStore (readme) for more details.
last_x_seconds_of_imagesSpecify a value in seconds in order to retrieve the last “x” seconds worth of images for creating human annotation tasks in CVAT
Example: A value of 60 would create human annotation task(s) in CVAT for the images that were stored in Data Store in the last 60 seconds.
Note:
Provide a value of 0 if you do not want this configuration setting to override the
start_dateandend_dateconfiguration settings.
img_handlesSpecify image handles for creating human annotation tasks in CVAT
Example:
"img_handles": ["1b387bad73", "5b387bad73"]would create CVAT task(s) for the mentioned image handlesNote:
Provide a value of
"img_handles": []if you do not want this configuration setting to override thestart_date,end_dateandlast_x_seconds_of_imagesconfiguration settings.This configuration setting works regardless of whether image handles are annotated or not.
image_typeUpdate this policy to “annotated”, “unannotated” or “all” to create annotation tasks in CVAT for the respective images.
Example 1:
"image_type": "annotated"would create tasks in CVAT only for images that already have annotation associated with them in influxdb. Such tasks can be termed as “review tasks” that are meant for reviewing already existing annotation (that are present due to auto annotation module or human annotation module)Example 2:
"image_type": "unannotated"would create tasks in CVAT only for images that do not have any annotation associated with them in influxdb. Such tasks are meant to perform annotation for the first time.Example 3:
"image_type": "all"would create tasks in CVAT for images regardless of whether they have annotation associated with them in influxdb. These are hybrid tasks that are meant to perform review of existing annotation for certain images and to perform fresh annotation on the rest of the images.
db_topicsThe topics/tables in the data store that need human annotation tasks. In multi-stream configuration, the topics are auto-populated with the topic names of all the streams.
task_sync_policies
is_auto_syncUpdate this policy to either
trueorfalse.Example 1:
"is_auto_sync": true. In this case, auto sync will happen in regular intervals as specified by theauto_sync_interval_in_secpolicy in the below point.Example 2:
"is_auto_sync": false. In this case, no annotations from CVAT will be synced with influxdb.
auto_sync_interval_in_secUpdate this policy to a value (in seconds) that defines how often you would like to poll the CVAT tasks list. This polling is necessary to update the influxdb with annotations from cvat. Note that the update to influxdb happens only when the task has been updated since the last time auto sync ran.
Example:
"auto_sync_interval_in_sec": 60polls the CVAT tasks list every 60 seconds and if any particular task happens to be updated since the last time auto sync ran (60 seconds ago), then the task data (annotation) is synced with influxdb.Note: If there is a CVAT task that contains one or more images without annotation, then the respective CVAT job has to be marked as “completed” by clicking on
Menu->Finish the job(and just clicking on “save” in the job is not enough) in order to update theannotation_typein influxdb ashumanfor those images with empty annotation. This is necessary to have accurate annotation available for deep learning model training to avoid false positives/negatives.Explanation with the help of an example: Let us say that there are 10 images in a certain CVAT task. 2 of them have annotation and the rest 8 do not. Upon clicking “save” within the CVAT job, the next time auto sync mechanism in Edge Data Collection runs, the annotations for the 2 images and their annotation type as human will be synced with influxdb. However, for the other 8 images that do not have any annotation, the empty annotation and the annotation type as human will be updated as human in influxdb by auto sync mechanism only upon completion (and not just “save”) of the CVAT job.
cvat task_creation_policies
max_images_per_taskUpdate this policy to set a limit on maximum images that a CVAT task can hold
Example:
"max_images_per_task": 100. This would mean that every task that gets created in CVAT can hold a maximum of 100 images. The actual amount of images that goes into a particular task is decided by the intersection with other policies:start_date,end_dateandimage_typeNote: Set this policy to
0if you do not want any tasks to be created.
max_images_per_jobUpdate this policy to set a limit on maximum images that a CVAT job in a given task can hold
Example:
"max_images_per_job": 1. This would mean that every job that gets created in CVAT can hold a maximum of 1 image.Note: Setting this policy to a value greater than
1would mean that, when a given job is saved, all images in the job, during auto sync, gets synced back to DataStore as ‘human’ annotated even though all those images might not have had modified annotation by the user.
max_images_per_live_taskUpdate this policy to set a limit on maximum images that a live task in CVAT can hold. The images in this case come from live feed. Consider giving this policy a lower number if you face frame drop issues.
Example:
"max_images_per_live_task": 50Note: Set this policy to
0if you do not want any live tasks to be created.
login_retry_limitUpdate this policy to a reasonable number which decides how many times login to CVAT will be attempted by the microservice before giving up.
Example:
"login_retry_limit": 5
Note: After running
eii_start.sh, open the CVAT web application by navigating tohttps://<host_machine_IP>:8443in google chrome and login using the superuser credentials you provided in the .env file. Perform annotation as necessary for the created tasks. Annotators within the team could create accounts for themselves using the CVAT web app and perform annotations as well for the tasks that the superuser assigned to them.IMPORTANT
Ensure not to logout of CVAT in browser as it causes issues in interaction with Edge Data Collection. In case you do logout, after you log back in, restart the Edge Data Collection container.
Google Chrome is the only browser that is supported by CVAT. For more details, see link
Auto Annotation Mode
Edge Data Collection also allows users to annotate images automatically as are being ingested from the source i.e. EVAM. The annotating algorithm is a user defined functions (UDFs). This is helpful in a scenario where user would like to run a AI model to generate a first set of annotations for the images and store it in DataStore. These annotations for the images can later be reviewed by a subject matter expert using the microservice in human annotation mode.
Since DataStore will now subscribe to the data collection microservice instead of EVAM, the following interface changes have to be done.
Pre-requsites
Remove
"DataCollectionMicroservice": ""from the"subscriber_list"in[WORKDIR]/IEdgeInsights/build/builder_config.jsonif it already existsAdd the following subscriber and publisher to DataCollectionMicroservice
interfacein config.json([WORK_DIR]/IEdgeInsights/DataCollectionMicroservice/config.json)"Publishers": [ { "AllowedClients": [ "*" ], "EndPoint": "/EII/sockets", "Name": "default", "Topics": [ "dcaas_data" ], "Type": "zmq_ipc" } ], "Subscribers": [ { "EndPoint": "/EII/sockets", "Name": "default", "PublisherAppName": "EdgeVideoAnalyticsMicroservice", "Topics": [ "edge_video_analytics_results" ], "Type": "zmq_ipc", "zmq_recv_hwm": 50 } ]
Add the following subscriber to DataStore’s config.json interface at
[WORKDIR]/IEdgeInsights/DataStore/config.json"Subscribers": [ { "EndPoint": "/EII/sockets", "Name": "default", "PublisherAppName": "DataCollectionMicroservice", "Topics": [ "dcaas_data" ], "Type": "zmq_ipc", "zmq_recv_hwm": 50 } ]
With the above changes, Edge Data Collection will now subscribe to EVAM for the frames and metadata, auto-annotate it when enabled and publish for DataStore subscribe and store it.
Configuration
The configuration for the auto annotation sub-section can be found in the microservice’s config.json file, under the annotation section. Disabled by default.
"simple_storage": {
    "enabled": true
},
"annotation": {
    "categories": [
        "anomalous"
    ],
    "auto_annotation": {
        "enabled": true,
        "udfs": [
            {
                "deployment": "/udfs/person_detection/deployment",
                "device": "CPU",
                "name": "person_detection.geti_udf",
                "type": "python",
                "visualize": "false",
                "metadata_converter": "geti_to_dcaas",
                "is_data_filter": false,
                "filter_threshold":-1
            }
        ]
    },
    "human_annotation":{
        "enabled": false,
        ...
    }
},
Options to configure “auto_annotation” in config.json(
[WORK_DIR]/IEdgeInsights/DataCollectionMicroservice/config.json)enabledEnsure that you have set
"enabled": truefor “auto_annotation”Ensure that you have set
"enabled": truefor “simple_storage”Also ensure that you have set
"enabled": falsefor “human_annotation” since human annotation and auto annotation should not be enabled at the same time.
categoriesSpecify the categories which need to be supported in auto annotation
Example:
"categories":["No object","Person"]. Ensure that all the possible labels that the udf would output is present in this categories list.
udfsFor auto annotation in Edge Data Collection, your model of choice is run as a User Defined Function (UDF). Obtain the required model files and the UDF script and place it under
DataCollectionMicroservice/udfsdirectory.Currently only python UDFs are supported. So, ensure that
"type": "python"is set and"name"is provided mandatorily.
Data Filter
The Edge Data Collection microservice allows user to filter incoming frame data so that they are not processed and stored to DataStore. This is helpful in scenarios where user would like to drop frames that are not of interest to them. The filtering algorithm is a user defined functions (UDFs).
The subscriber and publisher interface setup is similar to auto-annotation modem, where ingested frames are subscribed from EVAM and published to DataStore.
Configuration
The configuration for the data filter sub-section can be found in the microservice’s config.json file, under the data_filters section. Disabled by default.
"data_filters": {
    "enabled": true,
    "udfs": [
        {
            "deployment": "/udfs/person_detection/deployment",
            "device": "CPU",
            "name": "person_detection.geti_udf",
            "type": "python",
            "visualize": "false",
            "metadata_converter": "geti_to_dcaas",
            "is_data_filter": true,
            "filter_threshold":0.7
        }
    ]
},
Options to configure “data_filters” in config.json([WORK_DIR]/IEdgeInsights/DataCollectionMicroservice/config.json)
enabledSet
"enabled": truefor “data_filters” to run or set"enabled": falseto disable it.
udfsThe data filter in Edge Data Collection uses a person detection model to filter frames containing people. This model is run as an User Defined Function (UDF). Obtain the required model files and the UDF script and place it under
DataCollectionMicroservice/udfsdirectory.Currently, it only supports python UDFs. So, ensure that
"type": "python"is set and"name"is provided mandatorily.
Note: A Geti based person detection model has already been provided as a data filter in the udfs/(
[WORK_DIR]/IEdgeInsights/DataCollectionMicroservice/udfs/person_detection) directory with configuration set inconfig.json(disabled by default). It uses a threshold value of 0.7 to drop image frames that are detected to have at least one person with a confidence beyond 0.7. If you wish to add your own custom filter, please add the appropriate data filter in theudfs/directory and update the data filter section in config.json.
Remote Storage
Edge Data Collection provides optional remote storage feature that allows user to export object detection data or classfication data in MS-COCO and imagenet data formats respectively to a persistent file storage. The file storage could be a local disk or a network mounted volume as set in the environment DCAAS_STORAGE_DIR in IEdgeInsights/build/.env file. If one has valid azure storage credentials, they also make use of uploading the exact data to azure blob storage service. The data export feature can be run periodically (autosync) or as a one-time(snapshot) activity. Read further below for more.
Configuration
Remote storage provides following options to configure in
config.json. Sample config below."annotation": { "categories": [ "anomalous" ], ... }, "storage":{ "mode": 0, "device":"disk", "auto_sync_interval_in_sec": 30, "ingestion_fps": 9, "db_topics": ["edge_video_analytics_results"] "img_recognition_configs":[ { "type": "classification", "export_format": "imagenet", "classification_threshold": {"anomalous": 0.5}, "filter": { "annotation_type": ["auto", "human"], "start_date": "2023-06-06T00:00:00Z", "end_date": "2024-12-30T13:00:00Z" } } ] }
modeMandatory. set it to
0if you wish to turn off remote storage feature. That would make other options in the storage config irrelevant. The following modes are supported:
0: turn off data export functionality
1: snapshot mode: a one time data export based on the img recognition config options provided.
2: autosync mode: a periodic data export based on the img recognition config options provided.
deviceMandatory. Refers to the type of storage to be used. The following device types are supported:
disk: when set, the target directory is a disk path (can be host or network mounted). the path is set byDCAAS_LOCAL_STORAGE_DIRin[WORK_DIR]/IEdgeInsights/build/.envfile. Ensure that the path has necessary write permission for the microservice. Read further on how to do that.
azure: when set, the target directory is an azure storage container https://learn.microsoft.com/en-us/azure/storage/blobs/storage-blobs-introduction#containers. User must have a valid azure storage subscription before being able to run remote storage in azure mode. Following additional account keys and azure storage container path needs to be added as environment variable to the build .env file besidesDCAAS_LOCAL_STORAGE_DIR. See Additional Info section on how to retrieve these values from Azure.AZURE_STORAGE_CONNECTION_STRING = # <storage account connection string> AZURE_STORAGE_CONTAINER = # <container or directory in azure cloud where data will be uploaded>NOTE: Regardless of storage device used -
diskorazure, theDCAAS_LOCAL_STORAGE_DIRmust be set. When storage type isdisk, this is the target directory whereas, when storage type isazure, a subdirectory calledtmpis created inside this path and is used as a temporary directory for caching local changes before being uploaded to azure. The contents stored in the temporary directory are not guaranteed to persist unlike indiskstorage type.
auto_sync_interval_in_sec: Mandatory. Refers to the time interval (in sec) at which auto-sync runs
ingestion_fps: Mandatory. An estimated number of frames being published per second. defaults to 9. This helps remote storage algorithm to adjust/limit the number of rows to fetch from datastore during auto sync. Higher value will increase the the max number of rows to be fetched upon every query at a possible larger response time and vice-versa. Cannot be 0 or negative
db_topics: Mandatory. List of topics/tables in the data store to be queried by the remote storage. Needs at least 1 topic if storagemodeis set to 1 or 2. In case of multi-stream configuration, the topics are auto-populated with the topic names of all the streams.
img_recognition_configs: Mandatory. Refers to sub config related to specific image recognition type.sample
classficationtype config"img_recognition_configs": [ { "type": "classification", "export_format": "imagenet", "classification_threshold": {"anomalous":0.5}, "filter": { "annotation_type": ["auto", "human"], "start_date": "2023-06-06T00:00:00Z", "end_date": "2024-12-30T13:00:00Z" } } ]sample
object_detectiontype config"img_recognition_configs": [ { "type": "object_detection", "export_format": "COCO", "filter": { "label_score": {"Person": 0.45, "vehicle": 0.6}, "annotation_type": ["auto", "human"], "start_date": "2023-06-06T00:00:00Z", "end_date": "2024-12-30T13:00:00Z" } } ]
typeMandatory. Refers to the type of image recognition. The following types are supported:
classification: for classification type of image recognition
object_detection: for object detection type of image recognitionNote: Both types of configs together is not supported at the moment due to database schema challenges.
export_formatMandatory. Refers to the format in which the data is exported. The following formats are supported:
imagenet: for classification type of image recognition
coco: for object detection type of image recognition
classification_thresholdOptional. Specific to classification type. Defaults to 0.5 for a class not provided. Refers to A key-value pair referring to class label that will set the threshold >= which data is exported. For exmple, a metadata has a label named anomalous score of 0.45, and in the config, classficiation_threshold is set to 0.5, the export for this particular metadata will be ignored."classification_threshold": {"anomalous": 0.5}
filterMandatory in snapshot_mode(mode=1). Refers to the filter criteria for the data to be exported. The following filter criteria are supported. Data in DataStore satisfying these filter combination (AND of all the options provided) will only be exported.
annotation_type: Optional. Refers to a list of annotation types to be exported. The following annotation types are supported:
auto: for auto annotation
human: for human annotation
start_date: Mandatory when in snapshot mode(mode=1). Irrelevant in autosync mode(mode=2). The start date for the data to be exported in UTC. The date should be in the formatYYYY-MM-DDTHH:MM:SSZ.
end_date: Must ifstart_dateis also provided. Mandatory when in snapshot mode(mode=1). Irrelevant in autosync mode(mode=2) The end date for the data to be exported in UTC. The date should be in the formatYYYY-MM-DDTHH:MM:SSZ.
- Note:
Ensure that both
start_dateandend_dateare within the retention policy of DataStore. Refer DataStore (readme) for more details.When in autosync mode,
start_dateandend_datedoesnot matter and can be removed.
label_score: Optional. Specific to object_detection. Refers to a key-value pair refererring to bounding box labels and their score, >= which the frame metadata export will be exported. Any one bbox if found violating the label-score, the export for entire frame is dropped.All filter values are optional. If ommitted, they just won’t be the part of where clause in search query thus widening the search criteria.
Export behavior
Depending upon the image_recognition type chosen, the exported directory structure can vary. For both, topic wise parent directories are created within which data is exported.
Classification
For classfication type of export, inside the topic directory, a class wise folder structure is created containing images tagged to that particular class. This particular method of seggregating images is also known as ImageNet data format for classification. Before export to relevant label directory, we identify the type of export whether it is a binary class export or multi-class export. We make use of the labels present in
categorylist in theannotationsection microservice’sconfig.jsonfor this. The directory assignment logic for export is as follows.
If only one category is present in
categorylist, the export is considered as a binary class export,
For an image handle, if the label (from
categorylist) is found to be NEGATIVE class (i.e.<threshold), it is moved intonon-<label>dirFor an image handle, if the label (from
categorylist) is found to be POSITIVE class (i.e.>=threshold), it is moved into its<label>dirHowever, if multiple cateogies are present in category list, the export is considered as multi-class export:
For an image handle, if all the labels found in db are all NEGATIVE class(i.e.<threshold), it is moved to
no_classdirFor an image handle, any/all labels are found to be POSITIVE class(i.e.>=threshold), it is copied to their respective
<label>dirFor example, for the following metadata in influx for the table
edge_video_analytics_results,
img_handle
cat
dog
person
A
0
0
0
B
1
C
0
1
0
D
1
1
if category list has [cat, dog, person],
└── edge_video_analytics_results
    ├── dog
    │   ├── C.jpg
    │   └── D.jpg
    ├── no_class
    │   └── A.jpg
    └── person
        ├── B.jpg
        └── D.jpg
if category list has only [person],
└── edge_video_analytics_results
    ├── non_person
    │   ├── A.jpg
    │   └── C.jpg
    └── person
        ├── B.jpg
        └── D.jpg
Object Detection
For object detection type of export, data format used is MS-COCO. Similar to classfication export, data is grouped inside a topic directory. The data is seggregated into daywise subdirectory depending on their ingestion time into influx (YYYYMMDD format). Inside it, the data in COCO format exported. See sample structure below.
└── edge_video_analytics_results
    ├── 20241702
    │   ├── annotations
    │   │   └── instances_20241702.json
    │   └── images
    │       ├── x.jpg
    │       └── y.jpg
    └── 20241703
        ├── annotations
        │   └── instances_20241703.json
        └── images
            ├── a.jpg
            ├── b.jpg
            └── c.jpg
Note if data is exported with snapshot mode on, the above exported data will be kept in a separate directory with folder name as time of run to distinguish between other snapshot exports, if any.
Unsupported features
Both object detection and classification data export are supported with following exclusions.
Unsupported features for classification type data export
devicetype azure is not supported fortypeisclassification.Category Labels
Ensure that the labels provied in
classification_thresholdor inlabel_scoreare present in annotation.categories list in Edge Data Collection’s config.(e.g.anomalousin the given example config.)Permissions for storage dir
If remote storage is enabled in config, set the target path for storage and enable permissions as follows. In the
.envfile, setDCAAS_STORAGE_DIRto the directory where you wish to remotely save the annotations and images (ex: /path/to/persistent/remote/storage). As a better alternative tosudo chmod 777 /path/to/persistent/remote/storage(since this allows anyone to read/write the data), please ensure that write permissions are given to the persistent remote storage path for the user mentioned in env variableEII_USERwhich defaults toeiiuser.
Configuring other options
Configuring “options” in config.json([WORK_DIR]/IEdgeInsights/DataCollectionMicroservice/config.json)
input_queueStores raw frames from video ingestion.
data_filter_queueStores frames from data filter.
output_queueStores processed frames that are ready to be published.
max_sizeforinput_queue,data_filter_queueandoutput_queue.Sets the size of the mentioned queues.
Consider giving it a higher value if you face frame drop issues.
If value is
<=0, queue size is infinite.
Mandatory Metadata Fields & Compatible UDFs
Features like Annotation and Remote Storage provided by Edge Data Collection requires certain fields to be present in the frame metadata to operate. These fields carry annotation information, track data export status and other important details. Since User Defined Functions (UDFs) are usually attached with ingestion source such as EdgeVideoAnalyticsMicroservice (EVAM), we let UDFs add these fields along with any other fields it already adds as part of its functionality. Users need to add these UDFs are added to EVAM’s configuration file.
Mandatory Fields
In case you want to add your custom UDF and make it compatible with Edge Data Collection, ensure that the following fields are present in the metadata published by the UDF. Any missing key here will result in an error. Keys with sample values.
"last_modified": time_ns()
"export_code": 0
"annotation_type": "auto"
"annotations": {"objects":[]}
last_modified: Mandatory. Refers to the last time the metadata was modified. The value should be in nanoseconds.
export_code: Mandatory. Refers to the status of the data export. The following export codes are supported:
0: Data has not been exported
1: Data has been exported
annotation_type: Mandatory. Refers to the type of annotation. The following annotation types are supported:
auto: for auto annotation
human: for human annotation
annotations: Mandatory. Refers to the annotations for objects detection in the image.
objects: A list of objects detected in the image. If present, each object should have the following keys:
label: The label of the object
score: The confidence score of the object
bbox: The bounding box of the object. It is list of bbox coordinates in top-left and bottom-right format. For example,[x1, y1, x2, y2]It is important that the objects within the annotations dictionary have bounding box dimensions in top-left and bottom-right format. Some models may have bounding box predicted as top-left coordinates, width and height. In that case, the UDF must convert it to the expected top-left and bottom-right format to avoid incorrect bounding box dimensions during data export or visualization.
Classification label fields
The
annotationskey value pair only carries bounding box information from an object detection model. However, if the UDF is a classification model, ensure that a classification label key field with score value is also present in the metadata published by the UDF in addition to the mandatory ones above. For example: A UDF that classifies an image to be ofPersonclass with a confidence score of0.45, the published metadata must have the key-value pair-"Person": 0.45. If a data export is to be done, the classification labelPersonshould be present incategoriesfield of[WORK_DIR]/IEdgeInsights/DataCollectionMicroservice/config.json. See Remote storage section for more details. Theannotationsfield is still required for classification type of UDFs but can have emptyobjectslist as shown in the sample earlier.Sample compatible UDFs
Certain sample UDFs are already provided with EVAM that adds these metadata fields making them Edge Data Collection compatible.
Viewing logs
To check Edge Data Collection container logs
Run
docker logs ia_data_collection_microservice --follow
To verify that the corresponding image meta-data (**ex: human/auto annotation**) is being saved properly in the local database:
docker exec -it ia_datastore /bin/bash

influx -precision rfc3339 -database datain -username <INFLUXDB_USERNAME_provided_in_.env_file> -password <INFLUXDB_PASSWORD_provided_in_.env_file> -ssl -unsafeSsl

select * from dcaas_data # Or any desired influx query that helps validate your use case
Annotation Filtering
A script has been provided to perform offline aggregation and filtering of images and their corresponding annotations and can be found under helpers/filter_annotations.py.
Before running the script, install cocojson using pip install cocojson
The script provides the following command line arguments
--input_path(required): Path to the Edge Data Collection remote storage directory--output_path(required): Path to the directory where output should be written--topics: A list of 0 or more topics being subscribed to that should be included in the output--labels: A list of 0 or more categories of objects identified in the images that should be included--annotation_types: A list of 0 or more methods of how the images were annotated e.x.humanorauto. If left empty, all types will be included.–creation_start_date: The earliest date when images were ingested by Edge Data Collection. Should be in the format yyyy-mm-ddTHH:MM:SS
If this parameter is provided,
--creation_end_datemust also be provided
–creation_end_date: The latest date when images were ingested by Edge Data Collection. Should be in the format yyyy-mm-ddTHH:MM:SS
If this parameter is provided,
--creation_start_datemust also be provided
–last_modified_start_date: The earliest date when images were last modified. Should be in the format yyyy-mm-ddTHH:MM:SS
If this parameter is provided,
--last_modified_end_datemust also be provided
–last_modified_end_date: The latest date when images were last modified. Should be in the format yyyy-mm-ddTHH:MM:SS
If this parameter is provided,
--last_modified_start_datemust also be provided
--log_level: The level of logs that should be displayed to the user. Defaults to INFO
Example Usage
python3 filter_annotations.py \
--input_path='/home/user/dcaas_remote_store/' \
--output_path '/home/user/Downloads' \
--topics dcaas_data \
--annotation_types auto human \
--creation_start_date=2023-02-28T00:00:00 \
--creation_end_date=2023-02-28T23:59:59 \
--last_modified_start_date=2023-02-28T00:00:00 \
--last_modified_end_date=2023-02-28T23:59:59 \
--labels box "No Object"
Status Notification
Edge Data Collection export statuses of task creation and data export progress for snapshots in the form of a json file.
For both, progress in terms of no of images processed is continuously updated and status is set to COMPLETED or IN_PROGRESS depending upon whether all the frames have been processed or not.
The notification file can be found in ${EII_INSTALL_PATH}/data/dcaas/dcaas_notification.json
Here is a sample of notification json file (comments added for explanation).
{
    "services": [   # list of enabled services with status
        "remote_storage",
        "human_annotation"
    ],
    "remote_storage": {   # remote storage specific status
        "snapshot_list": [
            "2024-02-14-193903"   # list of snapshot. currently only 1 i.e.latest is mentioned
        ],
        "2024-02-14-193903": {    # snapshot instance details
            "time_utc": "2024-02-14T19:39:03",
            "config": {
                "mode": 1,
                "device": "disk",
                "auto_sync_interval_in_sec": 30,
                "ingestion_fps": 9,
                "img_recognition_configs": [
                    {
                        "type": "classification",
                        "export_format": "imagenet",
                        "filter": {
                            "start_date": "2023-06-06T00:00:00Z",
                            "end_date": "2024-12-30T13:00:00Z",
                            "annotation_type": [
                                "auto",
                                "human"
                            ]
                        },
                        "classification_threshold": {
                            "anomalous": 0.4
                        }
                    }
                ],
                "db_topics": [
                    "edge_video_analytics_results"
                ]
            },
            "status": "IN_PROGRESS",    # export status, 'COMPLETED' when done
            "export_dir": "/storage/2024-02-14-193903",   # exported relative dir
            "processed_frames": 200,    # frames exported till now
            "total_frames": 402
        }
    },
    "human_annotation": {   # human annotation specific status
        "time_utc": "2024-02-14T19:39:22.443201Z",
        "config": {
            "cvat": {
                "login_retry_limit": 10,
                "task_creation_policies": {
                    "max_images_per_job": 5,
                    "max_images_per_live_task": 5,
                    "max_images_per_task": 100
                }
            },
            "enabled": true,
            "image_selection_for_annotation_policies": {
                "db_topics": [
                    "edge_video_analytics_results"
                ],
                "end_date": "9999-12-30T13:00:00Z",
                "image_type": "annotated",
                "img_handles": [],
                "last_x_seconds_of_images": 0,
                "start_date": "2024-01-02T00:00:00Z"
            },
            "task_sync_policies": {
                "auto_sync_interval_in_sec": 30,
                "is_auto_sync": true
            }
        },
        "status": "COMPLETED",    # task creation status
        "processed_frames": 561,    # net frames processed as task are being created
        "total_frames": 561
    }
}
Behavior With and Without other Edge Insights System services
Sync of manually reviewed annotations and remote backup of annotations/images is dependent on availability of that particular data in DataStore as per its retention policy.
Edge Data Collection waits 5 mins for DataStore to provide a response for queried data. After the elapsed time, Edge Data Collection doesn’t error out in the hope that during the next iteration of the query API call to DataStore, meaningful results will be obtained.
Incase of a fatal error in Edge Data Collection, there is no guarantee of successful completion of remote data backup.
Edge Data Collection requires certain bare minimum key-value to be present in metadata. EdgeVideoAnalyticsMicroservice being the direct source of metadata, it is upto the EVAM and its UDFs to ensure that these fields are present in the metadata. To learn more on this, refer Mandatory Metadata Fields & Compatible UDFs section in this document.
Useful statistics to consider before running Edge Data Collection
Please find the table below that gives the approximate disk space consumption for the mentioned video ingestion (image) configuration with single stream. So, based on how long you plan to run Edge Data Collection microservice, please ensure that there is a relevant amount of disk space available on the edge node.
Mode of execution |
Image resolution (height x width) |
Image encoding type |
Image encoding level |
FPS |
Disk space consumption |
|---|---|---|---|---|---|
Simple Storage or Auto Annotation |
432 x 768 |
jpeg |
95 |
30 |
~30 GB for ~24 hours |
Human Annotation* |
432 x 768 |
jpeg |
95 |
30 |
~70 GB for ~24 hours |
*Human Annotation configured with “image_type: all” and with live task creation turned ON.
Unit tests
To run the unit tests, navigate to Edge Data Collection repo root directory and run the following
make build
make test
Note for developers
Disclaimer: The below details on gracefully shutting down Edge Data Collection are valid only until Intel® Edge Insights System supports ‘depends_on’ flag in builder.py while generating the consolidated docker-compose.yml file.
For gracefully shutting down Edge Data Collection container completing all the necessary data sync, there is a need for the other Intel® Edge Insights System containers to be up and running (e.g. cvat, ia_imagestore etc.). These dependencies can be manually added to ‘depends_on’ flag in the consolidated docker-compose.yml.
Edge Data Collection does not do color conversion of the input frame i.e., BGR to RGB or vice versa. Any desired color format for processing in the UDF that is plugged in to Edge Data Collection needs to be taken care of in the UDF itself. All images are considered to be in BGR mode by default in Edge Data Collection.
Additional Info
Retrieving Azure keys
Before being able to retrieve the required Azure keys, make sure you have a valid azure storage subscription. If not, please contact your system administrator.
AZURE_STORAGE_CONNECTION_STRING: This connection string can be found in the azure web portal. Login to Azure portal. Navigate to Storage Accounts. Find the storage account available to you or your team. Under Security + networking section, select Access keys. This should link to a page where the key(s) associated to your storage account are available. If there are multiple keys, choose any one and click Show, and then copy its “Connection string”. This string should be set to theAZURE_STORAGE_CONNECTION_STRINGin.envfile inside your IEdgeInsightsbuild directory.AZURE_STORAGE_CONTAINER: This is the name of thecontainerwhere the exported annotations and images will be uploaded by Edge Data Collection.containeris a directory in Azure storage terms. To create one, login to Azure portal. Navigate to Storage Accounts. Find the storage account available to you or your team. Under Data storage section, select Containers. This should open a portal that lists all thecontainerscreated within this storage account. Click on + Container link at the top. Enter a name you wish to give it to the container. Click Create. This string should be set to theAZURE_STORAGE_CONTAINERin.envfile inside your IEdgeInsightsbuild directory. If you are using an existing container please set the value to that name. To learn more, goto container.Logs from azcopy may contain proxy information of your network. While sharing the logs, if you donot want this or any similar information, please redact them from the logs.
License
License details can be found in License.pdf([WORK_DIR]/IEdgeInsights/DataCollectionMicroservice/License.pdf)
Troubleshooting
-
For any issues or abnormal behavior, it is a good idea to have a look at the container health status by running
docker psin a terminal and check if its healthy or unhealty.docker psIn case the container status in
Unhealthyor isRestarting, have a look at the logs of the Edge Data Collection container.docker logs -f ia_data_collection_microservice
Remote storage or Human Annotation does not exports or create tasks after DataStore is cleaned
This is an expected behavior.
When DataStore is cleaned up and the services are started again, Edge Data Collection executes the queries to fetch data for Remote storage or Human Anntoation. It is highly possible that data has not arrived to DataStore yet from the ingestion service i.e. EVAM and made available to read from.
For this particular scenario, if the user restarts Edge Data Collection microservice, the the same queries would re-run (unless explicitly changed) and would fetch data from DataStore. Edge Data Collection can be restarted like any other microservice as below
docker restart ia_data_collection_microservice
Edge Data Collection cannot read blobs for specific img_handles
This happens if metadata for queried image handles is available in Influx but not in MinIO.
One of the reasons this might happen is when the retention policy in MinIO has run and cleared the image blobs. Both Influx and MinIO db have their poll cycles to run retention policies. In case they are out of sync, metadata might appear in Influx but not in MinIO or vice-versa.
Ensure that the data being queried in remote storage or human annotation falls within the retention period of both Influx and MinIO and has not expired. The query period is set in
start_dateandend_datekeys of respective sub-section (storage and human annotation) of Edge Data Collectionconfig.json. Retention period for Influx and MinIO can be set in DataStore’s config present at[WORK_DIR]/IEdgeInsights/DataStore/config.json. User may prefer to increase the retention period (by default 1 hour) or should query data only within the set retention period. To learn more on DataStore configuration, see hereExported COCO data cannot be loaded in Intel® Geti™ tool
There is an issue with data export feature for COCO data format where image file references inside annotation json file are set to .jpg file regardless of actual image encoding. Please check if the exported image files have a different extension. If yes, please rename the extension of the images to .jpg and try again. If your are in Ubuntu, you can try the following command to rename the files. For example to change all jpeg files to jpg, cd into the image directory and run the following command.
rename.ul .jpeg .jpg *.jpeg
If you are unable to resolve the issues on your own, please raise an issue and attach full Edge Data Collection log.
docker logs ia_data_collection_microservice &> edgedatacollection.log
Visualization Microservice Overview
The Multimodal Data Visualization microservice provides functionality to represent the data graphically. Using this service, you can visualize the video streaming and Time Series data. The following containers run as a part of the Multimodal Data Visualization microservice:
multimodal-data-visualization
multimodal-data-visualization-streaming
The multimodal-data-visualization-streaming container gets the
ingested frames and the inference results from the MsgBus subscriber and
it then renders the video to a webpage. This webpage is embedded in
Grafana* to visualize the video stream and the Time Series data on the
same dashboard.
Visualizer Streaming Service
Grafana supports various storage backends for the Time Series data (data
source). EII uses InfluxDB as the data source. Grafana connects to the
InfluxDB data source that is preconfigured as a part of the Grafana
setup. The ia_influxdbconnector and ia_webservice service must
be running for Grafana to be able to collect the Time Series data and
stream the video respectively. After the data source starts working, you
can use the preconfigured dashboard to visualize the incoming data. You
can also edit the dashboard as required.
After the Multimodal Data Visualization microservice is up, you can access Grafana at http://:3000
Grafana Configuration
The following are the configuration details for Grafana:
dashboard.json: This is the dashboard json file that is loaded when Grafana starts. It is preconfigured to display the Time Series data.
dashboards.yml: This is the config file for all the dashboards. It specifies the path to locate all the dashboard json files.
datasources.yml: This is the config file for setting up the data source. It has various fields for data source configuration.
grafana.ini: This is the config file for Grafana. It specifies how Grafana should start after it is configured.
Note: You can edit the contents of these files based on your requirement.
Run Grafana in the PROD Mode
Note: Skip this section, if you are running Grafana in the DEV mode.
To run Grafana in the PROD mode, import cacert.pem from the
build/Certificates/rootca/ directory to the browser certificates.
Complete the following steps to import certificates:
In Chrome browser, go to Settings.
In Search settings, enter Manage certificates.
In Privacy and security, click Security.
On the Advanced section, click Manage certificates.
On the Certificates window, click the Trusted Root Certification Authorities tab.
Click Import.
On the Certificate Import Wizard, click Next.
Click Browse.
Go to the
IEdgeInsights/build/Certificates/rootca/directory.Select the cacert.pem file, and provide the necessary permissions, if required.
Select all checkboxes and then, click Import.
Run Grafana for a Video Use Case
Complete the following steps to run Grafana for a video use case:
Ensure that the endpoint of the publisher, that you want to subscribe to, is mentioned in the Subscribers section of the config file.
Use root as the Username and eii123 Password both for first login, password can be changed if required when prompted after logging in.
On the Home Dashboard page, on the left corner, click the Dashboards icon.
Click the Manage Dashboards tab, to view the list of all the preconfigured dashboards.
Select EII Video and Time Series Dashboard, to view multiple panels with topic names of the subscriber as the panel names along with a time-series panel named
Time Series.Hover over the topic name. The panel title will display multiple options.
Click View to view the subscribed frames for each topic.
Note:
Changing gridPos for the video frame panels is prohibited since these values are altered internally to support multi-instance.
Grafana does not support visualization for GVA and CustomUDF streams.
Metadata Configuration
MDVM’s backend, multimodal-data-visualization-streaming, is like all EII
componenets controlled by config.json in EII mode. This
configuartion file includes a schema that the backend uses to read
metadata messages and provide overlays in the visualization stream. Your
configuration may vary based on your use case.
Modifying EII Mode with Various Configs
MDVM provides various configs depending on your usecase, available in
<root>/multimodal-data-visualization-streaming/eii/configs
Available Configuration Files
default_anomlib_config.json: anomalib default detection (default config)This config is the application default. It provides a classification visualization of an anomaly detection pipeline from EVAM
geti_udf_config.json: generic GeTI UDF configurationThis config
old_person_detection_config.json: (deprecated) person detection pipeline configurationThis config was used for the original person detection pipeline. It is now deperecated, but provided for posterity
person_detection_udf_config.json: person detection udf pipeline configurationThis config provides compatiblity with the Geti person detection UDF.
weld_udf_config.json: weld detection UDF configurationThis config provides compatiblility with the Geti weld detection UDF.
To use one of these premade configs, you can copy the config file to
<root>/multimodal-data-visualization-streaming/eii, overwriting the
existing config.json.
cp ./multimodal-data-visualization-streaming/eii/configs/person_detection_udf_config.json ./multimodal-data-visualization-streaming/eii/config.json
Note: This will overwrite any changes you have made to your existing
config.json
Enabling New Configuration File
To enable the new configuration file, the EII config builder will need to be re-run.
cd ../build
python ./builder.py -f usecases/video-streaming-evam.yml
docker compose down -v && docker compose build && docker compose up
Example Metadata for Object Detection
These are generic metadata JSON objects, to provide an example of the schema used by Visualizer.
Metadata Config for Object Detection (and GeTI UDFs)
"evam_metadata": {
    "task": "object_detection",
    "detection_name":"defects",
    "nested_detections":"off",
    "parent_detection_name":"",
    "bb_type":"tlbr",
    "bb_corner_type":["tl","br"],
    "label_type": "type",
    "label_location":"config",
    "confidence":"off",
    "conf_name":""
},
Metadata Config for Classification
"evam_metadata": {
    "task": "classification",
    "class_list":["true"],
    "multi_class": "false",
    "label_display":"all"
},
Metadata Schema
Visualizer requires a specific style of metadata message from EVAM in order to properly display the image and any provided overlay. Without changes to the config.json, in blackbox environments Visualizer supports three types of metadata: - Object Detection (GeTI) UDF - Classification UDF - None
Object Detection (GeTI) Metadata
Below is a compatible sample metadata for a GeTI UDF-based pipeline, for in this case Person Detection:
{
    "task": "object_detection",
    "height": 1080,
    "width": 1920,
    "channels": 3,
    "caps": "image/jpeg, sof-marker=(int)4, width=(int)1920, height=(int)1080, pixel-aspect-ratio=(fraction)1/1, framerate=(fraction)30/1, interlace-mode=(string)progressive, colorimetry=(string)1:1:5:1",
    "img_handle": "fd2c79f099",
    "annotation_type": "auto",
    "export_code": 0,
    "last_modified": 1.7105374906927688e+18,
    "annotations": {
        "objects": [
            {
                "label": "Person",
                "score": 0.5268639326095581,
                "bbox": [
                    199,
                    569,
                    467,
                    899
                ],
                "attributes": {
                    "rotation": 0,
                    "occluded": 0
                }
            },
            {
                "label": "Person",
                "score": 0.5125662684440613,
                "bbox": [
                    875,
                    486,
                    1047,
                    696
                ],
                "attributes": {
                    "rotation": 0,
                    "occluded": 0
                }
            },
            {
                "label": "Person",
                "score": 0.4905177354812622,
                "bbox": [
                    450,
                    495,
                    630,
                    697
                ],
                "attributes": {
                    "rotation": 0,
                    "occluded": 0
                }
            },
            {
                "label": "Person",
                "score": 0.44751977920532227,
                "bbox": [
                    1235,
                    361,
                    1524,
                    1004
                ],
                "attributes": {
                    "rotation": 0,
                    "occluded": 0
                }
            }
        ]
    },
    "gva_meta": [],
    "encoding_type": "jpeg",
    "encoding_level": 85,
    "pipeline": {
        "name": "user_defined_pipelines",
        "version": "eii_pipeline",
        "instance_id": "77f34394e31111eebbb80242ac1d0004",
        "status": {
            "avg_fps": 9.072869897474506,
            "avg_pipeline_latency": "None",
            "elapsed_time": 19.067820072174072,
            "id": "77f34394e31111eebbb80242ac1d0004",
            "message": "",
            "start_time": 1710537471.6407547,
            "state": "RUNNING"
        }
    },
    "frame_id": 172
}
For Visualizer to work properly without additional configuration, it needs a specific set of keys provided in the metadata. Below is the most basic message that Visualizer can accept. Of note is the task key, which is necessary to prevent Visualizer from falling back on pre-configured values:
{
    "task": "object_detection",
    "height": 1080,
    "width": 1920,
    "annotations": {
        "objects": [
            {
                "label": "Person",
                "score": 0.5268639326095581,
                "bbox": [
                    199,
                    569,
                    467,
                    899
                ],
            }
        ]
    }
}
Keys
Key |
Comments |
Required |
Notes on Value Type |
|---|---|---|---|
task |
Tells Visualizer what workload to target |
* |
“ob ject_detection” or “c lassification”, though for GeTI udfs that report a bounding box this should be “ob ject_detection” |
height |
Necessary for calculating image-relative overlay sizing |
* |
int |
width |
Necessary for calculating image-relative overlay sizing |
* |
int |
annotations |
Must contain an ‘objects’ list inside of it. No other data will be read. |
* |
Must be “annotations”. Any other values will cause a KeyError |
objects |
Must be a list of detection objects, and must be inside of the “annotations” key. Can be of any size. If empty, Visualizer will show an image without any overlay. |
* |
|
label |
Provides the label for the detection |
* |
Must be “label”.Any other key will produce a KeyError |
score |
Provides the confidence score |
* |
Must be “score”. Any other key will produce a KeyError. Value must be a float, do not cast your confidence value before building your metadata message. |
bbox |
Contains coordinates for bounding box rendering. Must have 4 coordinates, of [LeftX, BottomY, RightX, TopY] for Visualizer’s internal conversion to an OpenCV bounding box be successful |
* |
Must be labeled ‘bbox’, and must contain s lid 9` 4 int values |
Classification
Below is a sample metadata message for a Classification workload, in this case the default anomalib pipeline:
{
    "task":"classification",
    "height": 1070,
    "width": 1404,
    "channels": 3,
    "caps": "image/jpeg, sof-marker=(int)4, width=(int)1404, height=(int)1070, pixel-aspect-ratio=(fraction)1/1, framerate=(fraction)1/1, interlace-mode=(string)progressive, colorimetry=(string)sRGB",
    "img_handle": "d923dd34c8",
    "annotation_type": "auto",
    "export_code": 0,
    "last_modified": 1.7105349394753446e+18,
    "classes": [
        "anomalous"
    ],
    "detected_class":"anomalous",
    "annotations": {
        "objects": []
    },
    "gva_meta": [],
    "encoding_type": "jpeg",
    "encoding_level": 85,
    "pipeline": {
        "name": "user_defined_pipelines",
        "version": "eii_pipeline",
        "instance_id": "758d3e76e30b11ee9b480242ac1b0005",
        "status": {
            "avg_fps": 11.662714780555865,
            "avg_pipeline_latency": "None",
            "elapsed_time": 48.87368988990784,
            "id": "758d3e76e30b11ee9b480242ac1b0005",
            "message": "",
            "start_time": 1710534890.6156614,
            "state": "RUNNING"
        }
    },
    "frame_id": 569
}
For Visualizer to work properly without additional configuration, it needs a specific set of keys provided in the metadata. Below is the most basic message that Visualizer can accept. Of note is the task key, which is necessary to prevent Visualizer from falling back on pre-configured values:
{
    "task": "classification",
    "height": 1080,
    "width": 1920,
    "detected_class":"anomalous"
}
Keys
Key |
Comments |
Required |
Notes on Value Type |
|---|---|---|---|
task |
Tells Visualizer what workload to target |
* |
“ob ject_detection” or “c lassification”, though for classification udfs that report a class list this should be “ classification” |
height |
Necessary for calculating image-relative overlay sizing |
* |
int |
width |
Necessary for calculating image-relative overlay sizing |
* |
int |
classes |
an array of classes with corresponding confidence values. Visualizer will display the highest |
* |
Must be a list of key/value pairs, with the key as a string and the value as a float |
None (Passthrough)
Visualizer can support image passthrough for pipelines without additional metadata. Below is a sample metadata message:
{
    "height": 1070,
    "width": 1404,
    "channels": 3,
    "caps": "image/jpeg, sof-marker=(int)4, width=(int)1404, height=(int)1070, pixel-aspect-ratio=(fraction)1/1, framerate=(fraction)1/1, interlace-mode=(string)progressive, colorimetry=(string)sRGB",
    "img_handle": "U98LDI74J9",
    "gva_meta": [],
    "encoding_type": "jpeg",
    "encoding_level": 85,
    "pipeline": {
        "name": "user_defined_pipelines",
        "version": "eii_pipeline",
        "instance_id": "30132378e31111ee80500242ac1c0005",
        "status": {
            "avg_fps": 53.750640600004544,
            "avg_pipeline_latency": "None",
            "elapsed_time": 5.674346923828125,
            "id": "30132378e31111ee80500242ac1c0005",
            "message": "",
            "start_time": 1710537345.6629918,
            "state": "RUNNING"
        }
    },
    "frame_id": 304
}
No minimum message is necessary to enable passthrough. If the metadata message lacks the information for a bounding box or label overlay, visualizer will skip rendering on the image and will pass it to the webUI without modification.
Telegraf Microservice
Telegraf is a part of the TICKstack. It is a plugin-based agent that has many input and output plugins. In Intel® Edge Insights System’s basic configuration, it’s being used for data ingestion and sending data to influxDB. However, the Intel® Edge Insights System framework does not restrict any features of Telegraf.
Telegraf’s Default Configuration
Telegraf starts with the default configuration which is present at config/Telegraf/Telegraf.conf(
[WORK_DIR]/IEdgeInsights/Telegraf/config/Telegraf/Telegraf.conf) (for the dev mode the name is ‘Telegraf_devmode.conf’). By default the below plugins are enabled:
MQTT input plugin ([[inputs.mqtt_consumer]])
Influxdb output plugin ([[outputs.influxdb]])
Telegraf will be started using script ‘telegraf_start.py. This script will get the configuration from ETCD first and then it will start the Telegraf service by picking the right configuration depending on the developer/production mode. By default, only a single instance of the Telegraf container runs (named ‘ia_telegraf’).
Volume Mounting of Telegraf Configuration Files
In the DEV mode (DEV_MODE=true in [WORK_DIR]/IEdgeInsights/build/.env), telegraf conf files are being volume mounted inside the Telegraf container image as can be seen in it’s docker-compose-dev.override.yml. This gives the flexibility for the developers to update the conf file on the host machine and see the changes being reflected in Telegraf, this can be done by just restarting the Telegraf container without the need to rebuilding the telegraf container image.
Note
If Telegraf is being run as Multi Telegraf, then make sure that the same file path is volume mounted. Example: If volume mount Telegraf1 instance, the volume mount would look like:
volumes:
   - ./config/Telegraf1/:/etc/Telegraf/Telegraf1
MQTT Sample Configuration and the Testing Tool
To test with MQTT publisher in k8s helm environment, update ‘MQTT_BROKER_HOST’ Environment Variables in values.yaml(
[WORK_DIR]/IEdgeInsights/Telegraf/helm/values.yaml) with HOST IP address of the system where MQTT Broker is running.To test with remote MQTT broker in docker environment, update ‘MQTT_BROKER_HOST’ Environment Variables in docker-compose.yml(
[WORK_DIR]/IEdgeInsights/Telegraf/docker-compose.yml) with HOST IP address of the system where MQTT Broker is running.
ia_telegraf:
  environment:
    ...
    MQTT_BROKER_HOST: '<HOST IP address of the system where MQTT Broker is running>'
Telegraf instance can be configured with pressure point data ingestion. In the following example, the MQTT input plugin of Telegraf is configured to read pressure point data and stored into the ‘point_pressure_data’ measurement.
# # Read metrics from MQTT topic(s)
[[inputs.mqtt_consumer]]
#   ## MQTT broker URLs to be used. The format should be scheme://host:port,
#   ## schema can be tcp, ssl, or ws.
servers = ["tcp://localhost:1883"]
#
#   ## MQTT QoS, must be 0, 1, or 2
#   qos = 0
#   ## Connection timeout for initial connection in seconds
#   connection_timeout = "30s"
#
#   ## Topics to subscribe to
topics = [
"pressure/simulated/0",
]
name_override = "point_pressure_data"
data_format = "json"
#
#   # if true, messages that can't be delivered while the subscriber is offline
#   # will be delivered when it comes back (such as on service restart).
#   # NOTE: if true, client_id MUST be set
persistent_session = false
#   # If empty, a random client ID will be generated.
client_id = ""
#
#   ## username and password to connect MQTT server.
username = ""
password = ""
To start the MQTT-Publisher with pressure data,
cd ../tools/mqtt/publisher/
Change the command option in docker-compose.yml(
[WORK_DIR]/IEdgeInsights/tools/mqtt/publisher/docker-compose.yml) to:["--pressure", "10:30"]
Build and Run MQTT Publisher:
docker compose up --build -d
Refer to the README
Kapacitor Microservice
Introduction to the Point-Data Analytics (Time Series Data)
Any integral value that gets generated over time is point data. For examples:
Temperature at a different time in a day.
Number of oil barrels processed per minute.
By doing the analytics over point data, the factory can have an anomaly detection mechanism where PointDataAnalytics is considered.
IEdgeInsights uses the TICK stack to do point data analytics.
It has temperature anomaly detection, an example for demonstrating the time-series data analytics flow.
The high-level flow of the data is:
MQTT-temp-sensor–>Telegraf–>Influx–>Kapacitor–>Influx.
MQTT-temp-sensor simulator sends the data to the Telegraf. Telegraf sends the same data to Influx and Influx sends it to Kapacitor. Kapacitor does anomaly detection and publishes the results back to Influx.
Here, Telegraf is the TICK stack component and supports the number of input plug-ins for data ingestion. Influx is a time-series database. Kapacitor is an analytics engine where users can write custom analytics plug-ins (TICK scripts).
Purpose of the Kapacitor
About Kapacitor and UDF
You can write the custom anomaly detection algorithm in PYTHON/GOLANG. And these algorithms are called as UDF (user-defined function). These algorithms follow certain API standards for the Kapacitor to call these UDFs at run time.
IEdgeInsights has the sample UDF (user-defined function) written in GOLANG. Kapacitor is subscribed to the InfluxDB, and gets the temperature data. After fetching this data, Kapacitor calls the UDF, which detects the anomaly in the temperature and sends back the results to Influx.
The sample Go UDF is at go_classifier.go(
[WORK_DIR]/IEdgeInsights/Kapacitor/udfs/go_classifier.go) and the TICKscript is at go_point_classifier.tick([WORK_DIR]/IEdgeInsights/Kapacitor/tick_scripts/go_point_classifier.tick)The sample Python UDF is at py_classifier.py(
[WORK_DIR]/IEdgeInsights/Kapacitor/udfs/py_classifier.py) and the TICKscript is at py_point_classifier.tick([WORK_DIR]/IEdgeInsights/Kapacitor/tick_scripts/py_point_classifier.tick)For more details, on Kapacitor and UDF, refer to the following links:
Writing a sample UDF at anomaly detection
UDF and kapacitor interaction socket_udf
In production mode, the Kapacitor configuration file is Kapacitor/config/kapacitor.conf(
[WORK_DIR]/IEdgeInsights/Kapacitor/config/kapacitor.conf) and in developer mode, the Kapacitor configuration file is Kapacitor/config/kapacitor_devmode.conf([WORK_DIR]/IEdgeInsights/Kapacitor/config/kapacitor_devmode.conf).
Custom UDFs available in the UDF([WORK_DIR]/IEdgeInsights/Kapacitor/udfs) Directory
UNIX Socket based UDFs
go_classifier.go:Filters the points based on temperature (data <20 and >25 filtered out).
py_classifier.py:Filters the points based on temperature (data <20 and >25 filtered out).
profiling_udf.go:Add the profiling (time taken to process the data) data in the points.
temperature_classifier.go:Filter the points based on temperature (data >25 filtered out).
humidity_classifier.py:Filter the points based on humidity (data >25 filtered out).
Process based UDFs
rfc_classifier.py:Random Forest Classification algo sample. This UDF is used for profiling udf as well.
Steps to Configure the UDFs in the Kapacitor
Keep the custom UDFs in the udfs(
[WORK_DIR]/IEdgeInsights/Kapacitor/udfs) directory and the TICKscript in the tick_scripts([WORK_DIR]/IEdgeInsights/Kapacitor/tick_scripts) directory.Keep the training data set (if any) required for the custom UDFs in the training_data_sets(
[WORK_DIR]/IEdgeInsights/Kapacitor/training_data_sets) directory.For python UDFs, any external python package dependency needs to be installed. To install the python package using conda, it can be added in the conda_requirements.txt(
[WORK_DIR]/IEdgeInsights/Kapacitor/conda_requirements.txt) file.
Steps to Configure Socket based UDFs
Modify the UDF section in the kapacitor.conf(
[WORK_DIR]/IEdgeInsights/Kapacitor/config/kapacitor.conf) and in the kapacitor_devmode.conf([WORK_DIR]/IEdgeInsights/Kapacitor/config/kapacitor_devmode.conf). Mention the custom UDF in the configuration, for example:[udf.functions.customUDF] socket = "/tmp/socket_file" timeout = "20s"
For go or python based UDF, update the values of keys named “type”, “name”, “tick_script”, “task_name”, in the config.json(
[WORK_DIR]/IEdgeInsights/Kapacitor/config.json)file, for example:"task": [{ "tick_script": "py_point_classifier.tick", "task_name": "py_point_classifier", "udfs": [{ "type": "python", "name": "py_classifier" }] }]
For TICKscript only UDF, update the values of keys named “tick_script”, “task_name”, in the config.json(
[WORK_DIR]/IEdgeInsights/Kapacitor/config.json)file, for example:"task": [{ "tick_script": "simple_logging.tick", "task_name": "simple_logging" }]
Note:
By default, go_classifier and rfc_classifier is configured.
Mention the TICKscript UDF function same as configured in the Kapacitor configuration file. For example, UDF Node in the TICKscript:
@py_point_classifier()should be same as
[udf.functions.py_point_classifier]
   socket = "/tmp/socket_file"
   timeout = "20s"
go or python based UDF should listen on the same socket file as mentioned in the the UDF section in the kapacitor.conf(
[WORK_DIR]/IEdgeInsights/Kapacitor/config/kapacitor.conf) and in the kapacitor_devmode.conf([WORK_DIR]/IEdgeInsights/Kapacitor/config/kapacitor_devmode.conf). For example:[udf.functions.customUDF] socket = "/tmp/socket_file" timeout = "20s"
Steps to Configure Process based UDFs
For a process based UDFs, provide the correct path of the code within the container in the kapacitor.conf(
[WORK_DIR]/IEdgeInsights/Kapacitor/config/kapacitor.conf) and in the kapacitor_devmode.conf([WORK_DIR]/IEdgeInsights/Kapacitor/config/kapacitor_devmode.conf). By default, the files and directories will be copied into the container under the “/EII” directory. It is recommended to keep the custom UDFs in the udfs([WORK_DIR]/IEdgeInsights/Kapacitor/udfs) directory, the path of the custom UDF will be “/EII/udfs/customUDF_name” as shown in below example. If the UDF is kept in different path, modify the path in the args accordingly.The PYTHONPATH of the Kapacitor agent directory is “/EII/go/src/github.com/influxdata/kapacitor/udf/agent/py/”. Following example shows how to pass:
[udf.functions.customUDF]
   prog = "python3.7"
   args = ["-u", "/EII/udfs/customUDF"]
   timeout = "60s"
   [udf.functions.customUDF.env]
      PYTHONPATH = "/go/src/github.com/influxdata/kapacitor/udf/agent/py/"
For python based UDF, update the values of keys named “type”, “name”, “tick_script”, “task_name”, in the config.json(
[WORK_DIR]/IEdgeInsights/Kapacitor/config.json)file, for example:"task": [{ "tick_script": "rfc_task.tick", "task_name": "rfc_task", "udfs": [{ "type": "python", "name": "rfc_classifier" }] }]
Perform the provisioning and run the Intel® Edge Insights System stack.
Time Series Python UDFs Development
In the DEV mode (DEV_MODE=true in [WORK_DIR]/IEdgeInsights/build/.env), the Python UDFs are being volume mounted inside the Kapacitor container image that is seen in it’s docker-compose-dev.override.yml. This gives the flexibility for the developers to update their UDFs on the host machine and see the changes being reflected in Kapacitor. This is done by just restarting the Kapactior container without the need to rebuild the Kapacitor container image.
Sample Apps
This section provides more information about the Intel® Edge Insights System sample apps and how to use the core libraries packages like Utils, Message Bus, and ConfigManager in various flavors of Linux such as Ubuntu operating systems or docker images for programming languages such as C++, Go, and Python.
The following table shows the details for the supported flavors of Linux operating systems or docker images and programming languages that support sample apps:
Linux Flavor |
Languages |
|---|---|
|
|
The sample apps are classified as publisher and subscriber apps. For more information, refer to the following:
For default scenario, the sample custom UDF containers are not the mandatory containers to run. The builder.py script runs the sample-apps.yml from the build/usecases([WORK_DIR]/IEdgeInsights/build/usecases) directory and adds all the sample apps containers. Refer to the following list to view the details of the sample apps containers:
AppContexts:
# CPP sample apps for Ubuntu operating systems or docker images
- Samples/publisher/cpp/ubuntu
- Samples/subscriber/cpp/ubuntu

# Python sample apps for Ubuntu operating systems or docker images
- Samples/publisher/python/ubuntu
- Samples/subscriber/python/ubuntu

# Go sample apps for Ubuntu operating systems or docker images
- Samples/publisher/go/ubuntu
- Samples/subscriber/go/ubuntu
In the
[WORKDIR]/IEdgeInsights/build/.envfile, update thePKG_SRCvariable fromhttp:<host_ip>:8888/eis-v1.0tohttp:<host_ip>:8888/latest.To run the
sample-apps.ymlfile, execute the following command:cd [WORKDIR]/IEdgeInsights/build python3 builder.py -f ./usecases/sample-apps.yml
Refer to Build Intel® Edge Insights System stack and the Run Intel® Edge Insights System service sections to build and run the sample apps.
Intel® In-Band Manageability
Intel® In-Band Manageability enables software updates and deployment from cloud to device. This includes the following:
Software over the air (SOTA)
Firmware update over the air (FOTA)
Application over the air (AOTA) and system operations
The AOTA update enables cloud to edge manageability of application services running on the Intel® Edge Insights System enabled systems through Intel® In-Band Manageability.
For Intel® Edge Insights System use case, only the AOTA features from Intel® In-Band Manageability are validated and supported through Azure* and ThingsBoard* cloud-based management front end services. Based on your preference, you can use Azure* or ThingsBoard*.
The following sections provide information about:
Installing Intel® In-Band Manageability
Setting up Azure* and ThingsBoard*
Establishing connectivity with the target systems
Updating applications on systems
Installing Intel® In-Band Manageability
Refer the steps from edge_insights_system/IntelR_Edge_Insights_System_<version>/manageability/README.md to install the Intel® In-Band Manageability and configure Azure* and Thingsboard* servers with Intel® Edge Insights System.
Known Issues
Thingsboard* Server fails to connect with devices after provisioning TC. Thingsboard* server setup fails on fresh server.
Intel® Edge Insights System Uninstaller
The Intel® Edge Insights System uninstaller script automatically removes all the Intel® Edge Insights System Docker configuration that is installed on a system. The uninstaller performs the following tasks:
Stops and removes all the Intel® Edge Insights System running and stopped containers.
Removes all the Intel® Edge Insights System docker volumes.
Removes all the Intel® Edge Insights System docker images [Optional]
Removes all Intel® Edge Insights System install directory
To run the uninstaller script, run the following command from the [WORKDIR]/IEdgeInsights/build/ directory:
Example:
Run the following command to use the help option.
./eii_uninstaller.sh -hThe output of the above command is shown below:
Usage: ./eii_uninstaller.sh [-h] [-d]
This script uninstalls the previous Intel® Edge Insights System version.
Where:
  -h show the help
  -d triggers the deletion of docker images (by default it will not trigger)
Run the following command to delete the Intel® Edge Insights System containers and volumes:
./eii_uninstaller.sh
Run the following command to delete the Intel® Edge Insights System containers, volumes, and images:
./eii_uninstaller.sh -d
The commands in the example will delete the version 2.4 Intel® Edge Insights System containers, volumes, and all the docker images.
Debug
Debugging Options
Perform the following steps for debugging:
Run the following command to check if all the Intel® Edge Insights System images are built successfully:
docker images|grep ia
You can view all the dependency containers and the Intel® Edge Insights System containers that are up and running. Run the following command to check if all containers are running:
docker psEnsure that the proxy settings are correctly configured and restart the docker service if the build fails due to no internet connectivity.
Run the
docker pscommand to list all the enabled containers that are included in thedocker-compose.ymlfile.From edge video analytics microservice>visualizer, check if the default video pipeline with Intel® Edge Insights System is working fine.
The
/opt/intel/eiiroot directory gets created - This is the installation path for Intel® Edge Insights System:data/- stores the backup data for persistent imagestore and influxdbsockets/- stores the IPC ZMQ socket files
The following table displays useful docker compose and docker commands:
Command |
Description |
|---|---|
|
Builds all the service containers |
|
Builds a single service container |
|
Stops and removes the service containers |
|
Brings up the service containers by picking the changes done in the |
|
Checks the running containers |
|
Checks the running and stopped containers |
|
Stops all the containers |
|
Removes all the containers. This is useful when you run into issue of already container is in use |
|
For more information refer to the docker documentation |
|
For more information refer to the docker documentation |
|
For more information refer to the docker documentation |
|
To run the docker images separately or one by one. For example: |
|
Use this command to check logs of containers |
|
To see all the docker compose service container logs at once |
Troubleshooting Guide
For any troubleshooting tips related to the Intel® Edge Insights System configuration and installation, refer to the troubleshoot guide.
Since all the Intel® Edge Insights System services are independently buildable and deployable when we do a
docker compose upfor all Intel® Edge Insights System microservices, the order in which they come up is not controlled. Having said this, there are many publishers and subscriber microservices in Intel® Edge Insights System middleware, hence, its possible that publisher comes up before subscriber or there can be a slght time overlap wherein the subscriber can come up just after publisher comes up. Hence, in these scenarios its a possibility that the data published by publisher can be lost as subscriber would not be up to receive all the published data. So, the solution to address this is to restart the publisher after we are sure that the intended subscriber is up.Microservices integrated with license library may fail with No Feature License Available issue (this shows up in the container logs)
Solution: This is an intermittent issue that one could run into. The workaround is to restart the failing container with docker restart <container_name> command.
The helm charts installation in PROD mode bundled in Enhanced package may fail to bring up few pods
Solution: The helm charts are available locally on the node at <workdir>/edge_insights_system/Intel_Edge_Insights_System_1.5_Enhanced/eis-vision-timeseries-1.5.0/eii-deploy Please update the below files with DEV_MODE value set to true relative at above location and follow README.md in the same directory:
values.yaml
charts/eii-provision/values.yaml
If you observe any issues with the installation of the Python package, then as a workaround you can manually install the Python packages by running the following commands:
cd [WORKDIR]/IEdgeInsights/build
# Install requirements for builder.py
pip3 install -r requirements.txt
Note: To avoid any changes to the Python installation on the system, it is recommended that you use a Python virtual environment to install the Python packages. For more information on setting up and using the Python virtual environment, refer to Python virtual environment.
- Video looping issue during visualization
If there is a physical disconnection/re-connection of the USB 3.0 Basler Camera during ingestion, frames will start looping during visualization.
Solution: Reconnect the USB camera and restart the project.
- Monochrome image with Basler camera
The default pixel format for Basler Camera is mono8. Users can change the pixel format accordingly.
Solution: Configure the pixel format using ETCD keeper at https://<host_ip>:7071/etcdkeeper
Click the ‘/EdgeVideoAnalyticsMicroservice/config’
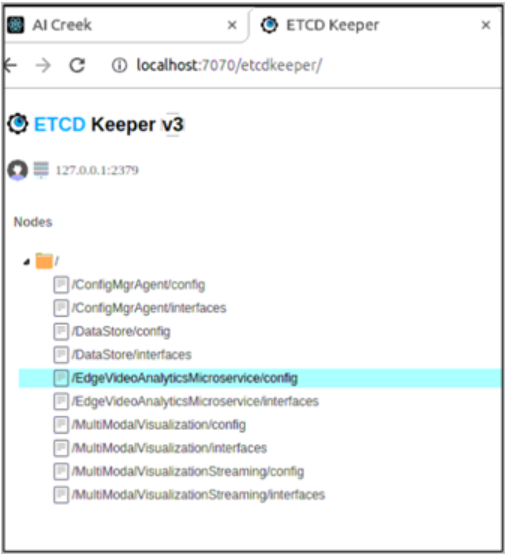
Figure 1. ETCD Keeper EdgeVideoAnalyticsMicroservice Config Section
Change the pixel format and click Save button.
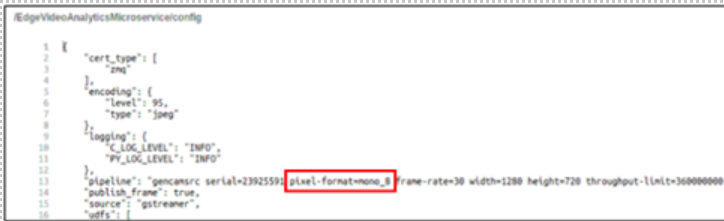
Figure 2. Pixel Format Parameter
- Basler camera field of view getting cropped
Camera field of view getting cropped is an expected behavior when a lower resolution is set using ‘height’ or ‘width’ parameter. Setting these parameters would create an Image ROI which will originate from the top left corner of the sensor. Refer https://docs.baslerweb.com/image-roi for more details.
Solution: Configure height and width parameters for GenICam camera to use the maximum supported resolution of the camera or completely remove height and width parameters in the pipeline. Refer to the GenICam Camera section to make the configuration change. The user may have to delete the camera and a add it as a fresh camera to make changes. Note that using a higher resolution might have other side effects like “lag issue in the pipeline” when the model is compute-intensive. More details available in the section “lag issue in the pipeline”.
- High CPU utilization issue
Using a compute-intensive model might increase the overall CPU utilization of the system (expected behavior).
Solution 1: Decrease the Basler Camera framerate. Decrease the Camera framerate using the frame-rate configurations available for GenICam camera. Refer to the “GenICam Camera” section of the User Guide for more details. The user may have to delete the camera and add it as a fresh camera to make changes.
Solution 2: To reduce the CPU utilization, the inference workload can be offloaded to the GPU device, provided the system supports running inference on GPU. For this, while registering the AI model, please select the device type as “AUTO” or “iGPU”.
- Lag issue in the pipeline
Using a compute-intensive model can also increase the inference time. Higher inference and pre-processing/post-processing times can lead to lag issues in the ingestion pipeline if the analytics throughput is less than the ingestion framerate
Solution: Ingestion framerate can be reduced to prevent the frame from piling up.
Creating multi-instance and running multiple pipelines with a compute-intensive model will increase the inference time and the overall CPU%.
Solution: Either the ingestion framerate must be reduced, or the model must be further optimized.
- Lag issue in the pipeline
- Xiris camera troubleshooting
XVC-1000e40 (monochrome) Xiris camera is tested.
Only PixelDepth=8 (camera outputs 8 bits per pixel) is supported. For any frame rendering issues, please check the PixelDepth value from the logs and make sure it is set to 8 by power cycle of the camera or by setting the value in the Xiris GUI tool (currently available on Windows).
In case a wrong or an invalid IP is provided for connecting to the Xiris camera using the XirisCameraIP env variable, ingestion will not work and error logs will not be printed. Make sure the correct IP is provided for ingestion to work.
Enable Jumbo Packets
The XeBus Runtime relies on Jumbo Packet support to ensure a successful camera connection and bandwidth. On most Linux* systems, this can be enabled with the following command:
$ sudo ifconfig eth0 mtu 8194
“eth0” in the command above should be replaced with the name of the ethernet interface connected to the camera. This command applies a change that will reset after rebooting.
It is advised to permanently set the MTU of your ethernet adapter to persist through reboots. Consult the documentation for your Linux* distribution and/or ethernet device for more details.
Increase Socket Buffer Size
With the large amount of data, a camera can stream, the socket send/receive buffers must be sufficiently large.
$ sudo sysctl -w net.core.rmem_max=10485750
$ sudo sysctl -w net.core.wmem_max=10485750
You can enable these changes permanently for your system by adding the following lines to your “/etc/sysctl.conf” file:
$ net.core.rmem_max=10485750
$ net.core.wmem_max=10485750
MQTT Publish Issue * MQTT publish issue occurs due to 2 active ethernet ports. One port is connected to a network (say eth0), and the other port is connected to Xiris Camera (say eth1).With this configuration, the default network connectivity (IP) route a few times becomes the port where the Xiris camera is connected. In this case, the system gets isolated from the network.
Solution: Disable the ethernet port where Xiris is connected and check sudo apt update. Once the command is working fine, then enable back the Xiris ethernet port.:raw-html-m2r:<br>
Xiris Camera not detected * During initial camera registration process or project deployment, the xirisi camera is not detected by the system.
Solution: Power off and power on the Xiris camera. Kindly refer the manufacture provided i.e. Xiris User Guide, if the problem persists.
UDF ModuleNotFound error
Solution: If the custom UDF/model name contains a “whitespace” character, UDF loading will fail and throw a ModuleNotFound error. Ensure that the UDF name and model/UDF directory name contain no “whitespace” character.
Frames are not getting ingested, or the ingestion rate is too low
Solution: By default, USB-FS on Linux* systems allows only 16 MB buffer limit, which might not be sufficient to work with high framerate, high-resolution cameras, and multiple camera setups. In such scenarios, configure USB-FS to increase the buffer memory limit for the USB3 vision camera. The following link can be used as a reference to configure the USB-FS limit configuring-usb-fs-for-usb3-vision-camera. (https://medium.com/taiwan-tech-for-good/configuring-usb-fs-for-usb3-vision-camera-5c5727bd0c3d)
Containers are still running upon docker compose down -v command
Solution: Go to [WORKDIR]/IEdgeInsights/build and run ./run.sh -v to remove the docker containers and volumes.
In Prod mode, changes made to the Telegraf configuration are not reflecting once telegraf is restarted
Solution: Follow the below steps,
Go to [WORKDIR]/IEdgeInsights/Telegraf, in docker-compose.yml under the volumes section add the below line
- ./../Telegraf/config/Telegraf:/etc/Telegraf/Telegraf
Go to [WORKDIR]/IEdgeInsights/build, execute the below commands:
python3 builder.py -f usecases/enhanced.yml
./run.sh -v -s