Advanced Guide
Install Edge Insights for Industrial from source code
By default, EII is installed via Edge Software Hub after downloading the EII package and running command ./edgesoftware install. This is the recommended installation when you want to preview EII stack.
If you are more interested in knowing different EII configurations that could be exercised or wish to customize the EII source code, please check the below sections:
Manual Installation
Complete the following tasks to install EII manually.
Task 1: Install Prerequisites
The pre_requisites.sh script automates the installation and configuration of all the prerequisites required for building and running the EII stack. The prerequisites are as follows:
docker daemon
docker client
docker-compose
Python packages
The pre-requisites.sh script performs the following:
Checks if docker and docker-compose is installed in the system. If required, it uninstalls the older version and installs the correct version of docker and docker-compose.
Configures the proxy settings for the docker client and docker daemon to connect to the internet.
Configures the proxy settings system-wide (/etc/environment) and for docker. If a system is running behind a proxy, then the script prompts users to enter the proxy address to configure the proxy settings.
Configures proxy setting for /etc/apt/apt.conf to enable apt updates and installations.
Note
The recommended version of docker is
20.10.6.The recommended version of the docker-compose is
1.29.0. In versions older than 1.29.0, the video use case docker-compose.yml files and the device_cgroup_rules command may not work.To use versions older than docker-compose 1.29.0, in the
ia_edge_video_analytics_microserviceservice, comment out thedevice_cgroup_rulescommand.You can comment out the
device_cgroup_rulescommand in theia_edge_video_analytics_microserviceservice to use versions older than 1.29.0 of docker-compose. This can result in limited inference and device support. The following code sample shows how thedevice_cgroup_rulescommands are commented out:ia_edge_video_analytics_microservice: ... #device_cgroup_rules: #- 'c 189:* rmw' #- 'c 209:* rmw'
After modifying the docker-compose.yml file, refer to the Using the Builder script section. Before running the services using the docker-compose up command, rerun the builder.py script.
Run the Prerequisites Script
To run the prerequisite script, execute the following commands:
cd [WORKDIR]/IEdgeInsights/build
sudo -E ./pre_requisites.sh --help
  Usage :: sudo -E ./pre_requisites.sh [OPTION...]
  List of available options...
  --proxy         proxies, required when the gateway/edge node running EII (or any of EII profile) is connected behind proxy
  --help / -h         display this help and exit
Note
If the –proxy option is not provided, then script will run without proxy. Different use cases are as follows:
Runs without proxy
sudo -E ./pre_requisites.sh
Runs with proxy
sudo -E ./pre_requisites.sh --proxy="proxy.intel.com:891"
Optional Steps
If required, you can enable full security for production deployments. Ensure that the host machine and docker daemon are configured per the security recommendation. For more info, see build/docker_security_recommendation.md.
If required, you can enable log rotation for docker containers using any of the following methods:
Method 1
Set the logging driver as part of the docker daemon. This applies to all the docker containers by default.
Configure the json-file driver as the default logging driver. For more info, see JSON File logging driver. The sample json-driver configuration that can be copied to
/etc/docker/daemon.jsonis as follows:{ "log-driver": "json-file", "log-opts": { "max-size": "10m", "max-file": "5" } }
Run the following command to reload the docker daemon:
sudo systemctl daemon-reload
Run the following command to restart docker:
sudo systemctl restart docker
Method 2
Set logging driver as part of docker compose which is container specific. This overwrites the first option (i.e /etc/docker/daemon.json). The following example shows how to enable the logging driver only for the video_ingestion service:
  ia_edge_video_analytics_microservice:
    ...
    ...
    logging:
      driver: json-file
      options:
      max-size: 10m
max-file: 5
Task 2: Generate the Deployment and the Configuration Files
After downloading EII from the release package or git, run the commands mentioned in this section from the [WORKDIR]/IEdgeInsights/build/ directory.
Use the Builder Script
Note
:
To run the builder.py script, complete the prerequisite by entering the values for the following keys in build/.env:
ETCDROOT_PASSWORD – The value for this key is required, if you are using the ConfigMgrAgent service.
INFLUXDB_USERNAME, INFLUXDB_PASSWORD, MINIO_ACCESS_KEY, and MINIO_SECRETKEY – The values for these keys are required, if you are using the Data Store service. Special characters ``~:’+[/@^{%(-“*|,&<``}.=}!>;?#$)` are not allowed for the INFLUXDB_USERNAME and INFLUXDB_PASSWORD. The MINIO_ACCESS_KEY and the MINIO_SECRET_KEY length must be a minimum of 8 characters. If you enter wrong values or do not enter the values for the keys, the
builder.pyscript prompts for corrections or values.PKG_SRC - The value will be pre-populated with the local http server daemon which is brought up by the
./edgesoftware installcommand when installed from Edge Software Hub. By default, the EII core libs and other artifacts would be picked up from$HOME/edge_insights_industrial/Edge_Insights_for_Industrial_<version>/CoreLibsdirectory.
To use the builder.py script, run the following command:
python3 builder.py -h
usage: builder.py [-h] [-f YML_FILE] [-v VIDEO_PIPELINE_INSTANCES]
                    [-d OVERRIDE_DIRECTORY] [-s STANDALONE_MODE] [-r REMOTE_DEPLOYMENT_MODE]
optional arguments:
    -h, --help            show this help message and exit
    -f YML_FILE, --yml_file YML_FILE
                        Optional config file for list of services to include.
                        Eg: python3 builder.py -f video-streaming.yml (default: None)
    -v VIDEO_PIPELINE_INSTANCES, --video_pipeline_instances VIDEO_PIPELINE_INSTANCES
                        Optional number of video pipeline instances to be
                        created.
                        Eg: python3 builder.py -v 6 (default: 1)
    -d OVERRIDE_DIRECTORY, --override_directory OVERRIDE_DIRECTORY
                        Optional directory consisting of benchmarking
                        configs to be present in each app directory.
                        Eg: python3 builder.py -d benchmarking (default: None)
    -s STANDALONE_MODE, --standalone_mode STANDALONE_MODE
                        Standalone mode brings in changes to support independently
                        deployable services.
                        Eg: python3 builder.py -s True (default: False)
    -r REMOTE_DEPLOYMENT_MODE, --remote_deployment_mode REMOTE_DEPLOYMENT_MODE
                        Remote deployment mode brings in changes to support remote deployment
                        wherein builder does not auto-populate absolute paths of build
                        related variables in the generated docker-compose.yml
                        Eg: python3 builder.py -r True (default: False)
Generate Consolidated Files for All Applicable Services of Edge Insights for Industrial
Using the Builder tool, EII auto-generates the configuration files that are required for deploying the EII services on a single node or multiple nodes. The Builder tool auto-generates the consolidated files by getting the relevant files from the EII service directories that are required for different EII use-cases. The Builder tool parses the top-level directories excluding EdgeVideoAnalyticsMicroservice under the IEdgeInsights directory to generate the consolidated files.
The following table shows the list of consolidated files and their details:
Table: Consolidated files
File Name |
Description |
|---|---|
docker-compose.yml |
Consolidated |
docker-compose.override.yml |
Consolidated |
eii_config.json |
Consolidated |
values.yaml |
Consolidated |
Template yaml files |
Files copied from the helm/templates directory of every app to the helm-eii/eii-deploy/templates directory that is required to deploy EII services via helm. |
Note
If you modify an individual EII app or service directory file, then ensure to rerun the
builder.pyscript before running the EII stack to regenerate the updated consolidated files.Manual editing of consolidated files is not recommended. Instead modify the respective files in the EII app or service directories and use the
builder.pyscript to generate the consolidated files.Enter the secret credentials in the
# Service credentialssection of the .env([WORK_DIR]/IEdgeInsights/build/.env) file if you are trying to run that EII app/service. If the required credentials are not present, thebuilder.pyscript would be prompting until all the required credentials are entered. Apply a file access mask to protect the .env([WORK_DIR]/IEdgeInsights/build/.env) file from being read by unauthorized users.The builder_config.json(
[WORK_DIR]/IEdgeInsights/build/builder_config.json) is the config file for thebuilder.pyscript and it contains the following keys:subscriber_list: This key contains a list of services that act as a subscriber to the stream being published.publisher_list: This key contains a list of services that publishes a stream of data.include_services: This key contains the mandatory list of services. These services should be included when the Builder is run without the-fflag.exclude_services: This key contains the mandatory list of services. These services should be excluded when the Builder is run without the-fflag.increment_rtsp_port: This is a Boolean key. It increments the port number for the RTSP stream pipelines.
To generate the consolidated files, run the following command:
python3 builder.py
Generate Consolidated Files for a Subset of Edge Insights for Industrial Services
Builder uses a yml file for configuration. The config yml file consists of a list of services to include. You can mention the service name as the path relative to IEdgeInsights or full path to the service in the config yml file.
To include only a certain number of services in the EII stack, you can add the -f or yml_file flag of builder.py. You can find the examples of yml files for different use cases as follows:
Azure(
[WORK_DIR]/IEdgeInsights/build/usecases/video-streaming-azure.yml)The following example shows running Builder with the -f flag:
python3 builder.py -f usecases/video-streaming.yml
Main Use Cases
Use case |
yaml file |
|---|---|
Video + Time Series |
build/usecases/video-timeseries.yml( |
Video |
build/usecases/video.yml( |
Time Series |
build/usecases/time-series.yml( |
Video Pipeline Sub Use Cases
Use case |
yaml file |
|---|---|
Video streaming with EVAM |
build/usecases/video-streaming-evam.yml( |
Video streaming and historical |
build/usecases/video-streaming-evam-datastore.yml( |
Video streaming with AzureBridge |
build/usecases/video-streaming-azure.yml( |
When you run the multi-instance config, a build/multi_instance directory is created in the build directory. Based on the number of video_pipeline_instances specified, that many directories of EdgeVideoAnalyticsMicroservice are created in the build/multi_instance directory.
The following section provides an example for running the Builder to generate the multi-instance boiler plate config for 3 streams of video-streaming use case.
Generate Multi-instance Config Using the Builder
If required, you can generate the multi-instance docker-compose.yml and config.json files using the Builder. You can use the -v or video_pipeline_instances flag of the Builder to generate boiler plate config for the multiple-stream use cases. The -v or video_pipeline_instances flag creates the multi-stream boiler plate config for the docker-compose.yml and eii_config.json files.
The following example shows running builder to generate the multi-instance boiler plate config for 3 streams of video-streaming use case:
python3 builder.py -v 3 -f usecases/video-streaming-evam.yml
Using the previous command for 3 instances, the build/multi_instance directory consists of the following directories
EdgeVideoAnalyticsMicroservice1
EdgeVideoAnalyticsMicroservice2
EdgeVideoAnalyticsMicroservice3
Initially each directory will have the default config.json and the docker-compose.yml files that are present within the EdgeVideoAnalyticsMicroservice/eii directory.
      ./build/multi_instance/
      |-- EdgeVideoAnalyticsMicroservice1
      |   |-- config.json
      |   `-- docker-compose.yml
      |-- EdgeVideoAnalyticsMicroservice2
      |   |-- config.json
      |   `-- docker-compose.yml
      |-- EdgeVideoAnalyticsMicroservice3
      |   |-- config.json
      |   `-- docker-compose.yml

You can edit the config of each of these streams within the ``build/multi_instance`` directory. To generate the consolidated ``docker compose`` and ``eii_config.json`` file, rerun the ``builder.py`` command.
Note
The multi-instance feature support of Builder works only for the video pipeline that is the usecases/video-streaming.yml and video-streaming-evam.yml use case and not with any other use case yml files like usecases/video-streaming-storage.yml and so on. Also, it doesn’t work for cases without the
-fswitch. The previous example will work with any positive number for-v. To learn more about using the multi-instance feature with the DiscoverHistory tool, see Multi-instance feature support for the builder script with the DiscoverHistory tool.If you are running the multi-instance config for the first time, it is recommended not to change the default
config.jsonfile and thedocker-compose.ymlfile in theEdgeVideoAnalyticsMicroservice/eiidirectory.If you are not running the multi-instance config for the first time, the existing
config.jsonanddocker-compose.ymlfiles in thebuild/multi_instancedirectory will be used to generate the consolidatedeii-config.jsonanddocker-composefiles.The
docker-compose.ymlfiles present within thebuild/multi_instancedirectory will have the following:the updated service_name, container_name, hostname, AppName, ports and secrets for that respective instance.
The
config.json filein thebuild/multi_instancedirectory will have the following:the updated Name, Type, Topics, Endpoint, PublisherAppname, ServerAppName, and AllowedClients for the interfaces section.
the incremented RTSP port number for the config section of that respective instance.
Ensure that all containers are down before running the multi-instance configuration. Run the
docker-compose downcommand before running thebuilder.pyscript for the multi-instance configuration.
Generate Benchmarking Config Using Builder
To provide a different set of docker-compose.yml and config.json files than those found in each service directory, use the -d or the override directory flag. The -d flag instructs the program to look in the specified directory for the necessary set of files.
For example, to pick files from a directory named benchmarking, you can run the following command:
python3 builder.py -d benchmarking
Note
If you use the override directory feature of the builder then include all the 3 files mentioned in the previous example. If you do not include a file in the override directory, then the Builder will omit that service in the final config that is generated.
Adding the
AppNameof the subscriber container or client container in thesubscriber_list of builder_config.jsonallows you to spawn a single subscriber container or client container that is subscribing or receiving on multiple publishers or server containers.Multiple containers specified by the
-vflag is spawned for services that are not mentioned in thesubscriber_list. For example, if you run Builder with–v 3option andVisualizeris not added in thesubscriber_listofbuilder_config.jsonthen 3 instances of Visualizer are spawned. Each instance subscribes to 3 EdgeVideoAnalyticsMicroservice services. If Visualizer is added in thesubscriber_listofbuilder_config.json, a single Visualizer instance subscribing to 3 multiple EdgeVideoAnalyticsMicroservice is spawned.
Task 3: Build and Run the Edge Insights for Industrial Video and Time Series Use Cases
Note
For running the EII services in the IPC mode, ensure that the same user is mentioned in the publisher services and subscriber services.
If the publisher service is running as root such as
EVAM, then the subscriber service should also run as root. For example, in thedocker-compose.ymlfile, if you have specifieduser: ${EII_UID}in the publisher service, then specify the sameuser: ${EII_UID}in the subscriber service. If you have not specified a user in the publisher service, then don’t specify the user in the subscriber service.If services need to be running in multiple nodes in the TCP mode of communication, msgbus subscribers, and clients of
AppNameare required to configure theEndPointinconfig.jsonwith theHOST_IPand thePORTunderSubscribers/PublishersorClients/Serversinterfaces section.Ensure that the port is being exposed in the
docker-compose.ymlof the respectiveAppName. For example, if the"EndPoint": <HOST_IP>:65114is configured in theconfig.jsonfile, then expose the port65114in thedocker-compose.ymlfile of theia_edge_video_analytics_microserviceservice.
ia_edge_video_analytics_microservice:
  ...
  ports:
    - 65114:65114
Run all the following EII build and commands from the [WORKDIR]/IEdgeInsights/build/ directory.
EII supports the following use cases to run the services mentioned in the docker_compose.yml file. Refer to the Task 2 to generate the docker_compose.yml file for a specific use case. For more information and configuration, refer to the [WORK_DIR]/IEdgeInsights/README.md file.
Independent building and deployment of services
All the EII services are aligning with the Microservice architecture principles of being Independently buildable and deployable.
Independently buildable and deployable feature is useful in allowing users to pick and choose only one service to build or deploy.
If one wants to run two or more microservices, we recommend to use the use-case driven approach as mentioned in Generate Consolidated Files for a Subset of Edge Insights for Industrial Services.
- The Independently buildable and deployable feature allows the users to build the individual service at the directory level and also allows the users to deploy the service in either of the two ways:
Without ConfigMgrAgent dependency:
- Deployment without ConfigMgrAgent dependency is only available in DEV mode where we make use of the ConfigMgr library config file APIs, by setting the `READ_CONFIG_FROM_FILE_ENV` value to `true` in the .env(`[WORK_DIR]/IEdgeInsights/build/.env`) file.
NOTE: We recommend the users to follow this simpler docker-compose deployment approach while adding in new services or debugging the existing service.
With ConfigMgrAgent dependency:
- Deployment with ConfigMgrAgent dependency is available in both DEV and PROD mode where we set the `READ_CONFIG_FROM_FILE_ENV` value to `false` in the .env(`[WORK_DIR]/IEdgeInsights/build/.env`) file and make use of the ConfigMgrAgent(`[WORK_DIR]/IEdgeInsights/ConfigMgrAgent/docker-compose.yml`) and the builder.py(`[WORK_DIR]/IEdgeInsights/build/builder.py`) to deploy the service.
NOTE: We recommend the users to follow the earlier use-case driven approach mentioned in Generate Consolidated Files for a Subset of Edge Insights for Industrial Services, when they want to deploy more than one microservice.
Build the Edge Insights for Industrial Stack
Note
This is an optional step, if you want to use the EII pre-built container images and not build from source. For more details, refer to List of Distributed EII Services
Run the following command to build all EII services in the build/docker-compose.yml along with the base EII services.
docker-compose build
If any of the services fails during the build, then run the following command to build the service again:
docker-compose build --no-cache <service name>
Run Edge Insights for Industrial Services
Note
Ensure to run docker-compose down from the build([WORK_DIR]/IEdgeInsights/build) directory before you bring up the EII stack. This helps to remove running containers and avoid any sync issues where other services have come up before ia_configmgr_agent container has completed the provisioning step.
If the images tagged with the EII_VERSION label, as in the build/.env([WORK_DIR]/IEdgeInsights/build/.env) do not exist locally in the system but are available in the Docker Hub, then the images will be pulled during the docker-compose upcommand.
Provision Edge Insights for Industrial
The EII provisioning is taken care by the ia_configmgr_agent service that gets launched as part of the EII stack. For more details on the ConfigMgr Agent component, refer to the Readme.
Start Edge Insights for Industrial in Dev Mode
Note
By default, EII is provisioned in the secure mode.
It is recommended not to use EII in the Dev mode in a production environment. In the Dev mode, all security features, communication to and from the etcd server over the gRPC protocol, and the communication between the EII services/apps over the ZMQ protocol are disabled.
By default, the EII empty certificates folder Certificates(
[WORK_DIR]/IEdgeInsights/Certificates]) will be created in the DEV mode. This happens because of docker bind mounts but it is not an issue.The
EII_INSTALL_PATHin the build/.env([WORK_DIR]/IEdgeInsights/build/.env) remains protected both in the DEV and the PROD mode with the Linux group permissions.
Starting EII in the Dev mode eases the development phase for System Integrators (SI). In the Dev mode, all components communicate over non-encrypted channels. To enable the Dev mode, set the environment variable DEV_MODE to true in the [WORK_DIR]/IEdgeInsights/build/.env file. The default value of this variable is false.
To provision EII in the developer mode, complete the following steps:
Update
DEV_MODE=truein[WORK_DIR]/IEdgeInsights/build/.env.Rerun the
build/builder.pyto regenerate the consolidated files.
Start Edge Insights for Industrial in Profiling Mode
The Profiling mode is used for collecting the performance statistics in EII. In this mode, each EII component makes a record of the time needed for processing any single frame. These statistics are collected in the visualizer where System Integrators (SIs) can see the end-to-end processing time and the end-to-end average time for individual frames.
To enable the Profiling mode, in the [WORK_DIR]/IEdgeInsights/build/.env file, set the environment variable PROFILING to true.
Run Provisioning Service and Rest of the Edge Insights for Industrial Stack Services
Note
:
After the EII services starts, you can use the Etcd UI web interface to make the changes to the EII service configs or interfaces keys.
in the DEV and the PROD mode, if the EII services come before the Config Manager Agent service, then they would be in the restarting mode with error logs such as
Config Manager initialization failed.... This is due to the single step deployment to support the independent deployment of the EII services, where services can come in a random order and start working when the dependent service comes up later. In one to two minutes, all the EII services should show the status asrunningwhenConfig Manager Agentservice starts up.To build the common libs and generate needed artifacts from source and use it for building the EII services, refer common/README.md.
docker-compose up -d
On successful run, you can open the web visualizer in the Chrome browser at https://HOST_IP corresponds to the IP of the system on which the visualization service is running.
List of EII Services
Based on requirement, you can include or exclude the following EII services in the [WORKDIR]/IEdgeInsights/build/docker-compose.yml file:
Provisioning Service - This service is a prerequisite and cannot be excluded from the
docker-compose.ymlfile.Common EII services for Video and Timeseries Analytics pipeline services
OpcuaExport - Optional service to read from the EdgeVideoAnalyticsMicroservice container to publish data to opcua clients.
RestDataExport - Optional service to read the metadata and the image blob from the from the Data store service.
Video Analytics pipeline services
FactoryControlApp - Optional service to read from the EdgeVideoAnalyticsMicroservice container if you want to control the light based on the defective or non-defective data
Timeseries Analytics pipeline services
Adding New Services to EII Stack
This section provides information about adding a service, subscribing to the EdgeVideoAnalyticsMicroservice([WORK_DIR]/IEdgeInsights/EdgeVideoAnalyticsMicroservice), and publishing it on a new port.
Add a service to the EII stack as a new directory in the IEdgeInsights([WORK_DIR]/IEdgeInsights/) directory. The Builder registers and runs any service present in its own directory in the IEdgeInsights([WORK_DIR]/IEdgeInsights/) directory. The directory should contain the following:
A
docker-compose.ymlfile to deploy the service as a docker container. TheAppNameis present in theenvironmentsection in thedocker-compose.ymlfile. Before adding theAppNameto the mainbuild/eii_config.json, it is appended to theconfigandinterfacesas/AppName/configand/AppName/interfaces.A
config.jsonfile that contains the required config for the service to run after it is deployed. Theconfig.jsonconsists of the following:A
configsection, which includes the configuration-related parameters that are required to run the application.An
interfacessection, which includes the configuration of how the service interacts with other services of the EII stack.
Note
For more information on adding new EII services, refer to the EII sample apps at Samples written in C++, Python, and Golang using the EII core libraries.
The following example shows:
How to write the config.json for any new service
Subscribe to EdgeVideoAnalyticsMicroservice
Publish on a new port
{
    "config": {
        "paramOne": "Value",
        "paramTwo": [1, 2, 3],
        "paramThree": 4000,
        "paramFour": true
    },
    "interfaces": {
        "Subscribers": [
            {
                "Name": "default",
                "Type": "zmq_tcp",
                "EndPoint": "127.0.0.1:65114",
                "PublisherAppName": "EdgeVideoAnalyticsMicroservice",
                "Topics": [
                    "edge_video_analytics_results"
                ]
            }
        ],
        "Publishers": [
            {
                "Name": "default",
                "Type": "zmq_tcp",
                "EndPoint": "127.0.0.1:65113",
                "Topics": [
                    "publish_stream"
                ],
                "AllowedClients": [
                    "ClientOne",
                    "ClientTwo",
                    "ClientThree"
                ]
            }
        ]
    }
}
The config.json file consists of the following key and values:
value of the
configkey is the config required by the service to run.value of the
interfaceskey is the config required by the service to interact with other services of EII stack over the Message Bus.the
Subscribersvalue in theinterfacessection denotes that this service should act as a subscriber to the stream being published by the value specified byPublisherAppNameon the endpoint mentioned in value specified byEndPointon topics specified in value ofTopickey.the
Publishersvalue in theinterfacessection denotes that this service publishes a stream of data after obtaining and processing it fromEdgeVideoAnalyticsMicroservice. The stream is published on the endpoint mentioned in value ofEndPointkey on topics mentioned in the value ofTopicskey.the services mentioned in the value of
AllowedClientsare the only clients that can subscribe to the published stream, if it is published securely over the Message Bus.
Note
Like the interface keys, EII services can also have
ServersandClientsinterface keys.For more information on the
interfaceskey responsible for the Message Bus endpoint configuration, refer to common/libs/ConfigMgr/README.md#interfaces.For the etcd secrets configuration, in the new EII service or app
docker-compose.ymlfile, add the following volume mounts with the rightAppNameenv value:
...
 volumes:
   - ./Certificates/[AppName]:/run/secrets/[AppName]:ro
   - ./Certificates/rootca/cacert.pem:/run/secrets/rootca/cacert.pem:ro
Steps to Independently Build and Deploy Data Store Microservice
Note
For running two or more microservices, you are recommended to try the use case-driven approach for building and deploying as described at Generate Consolidated Files for a Subset of Edge Insights for Industrial Services
Steps to Independently Build the Data Store Microservice
Note
When switching between independent deployment of the service with and without config manager agent service dependency, one would run into issues with docker-compose build w.r.t Certificates folder existence. As a workaround, run the command sudo rm -rf Certificates to proceed with the docker-compose build.
To independently build the Data Store microservice, complete the following steps:
The downloaded source code should have a directory named Data Store:
If cloned using Manifest File,
       # Enter the Data Store directory
       cd IEdgeInsights/DataStore

If cloned Data Store repo directly
# Enter the Data Store directory
cd applications.industrial.edge-insights.data-store
Independently build
docker-compose build
Steps to Independently Deploy Data Store Microservice
You can deploy the Data Store service in either of the following two ways:
Deploy Data Store Service without Config Manager Agent Dependency
Run the following commands to deploy Data Store service without Config Manager Agent dependency:
If cloned using Manifest File,
# Enter the Data Store directory
cd IEdgeInsights/DataStore
If cloned Data Store repo directly
# Enter the DataStore directory
cd applications.industrial.edge-insights.data-store
Note
Ensure that docker ps is clean and docker network ls must not have EII bridge network.
Update .env file for the following:
1. ETCD_HOST variables with your system IP.
2. `READ_CONFIG_FROM_FILE_ENV` value to `true` and `DEV_MODE` value to `true`.
3. Set the values for 'INFLUXDB_USERNAME', 'INFLUXDB_PASSWORD', 'MINIO_ACCESS_KEY', 'MINIO_SECRET_KEY' which are InfluxDB and Minio DB credentials

Source the .env using the following command:
set -a && source .env && set +a

Set Write Permission for Data Dir(Volume Mount paths): This is required for Database Server to have write permission to the respective storage paths.
sudo mkdir -p $EII_INSTALL_PATH/data
sudo chmod 777 $EII_INSTALL_PATH/data
sudo chown -R eiiuser:eiiuser $EII_INSTALL_PATH/data
# Run the service
docker-compose -f docker-compose.yml -f docker-compose-dev.override.yml up -d
Note
Data Store container restarts automatically when its config is modified in the config.json file.
If you update the config.json file by using vi or vim editor, it is required to append the set backupcopy=yes in ~/.vimrc so that the changes done on the host machine config.json are reflected inside the container mount point.
Deploy Data Store Service with Config Manager Agent Dependency
Run the following commands to deploy the Data Store Service with Config Manager Agent dependency:
Note
Ensure that the Config Manager Agent image present in the system. If not, build the Config Manager Agent locally when independently deploying the service with Config Manager Agent dependency.
# Enter the Data Store directory
cd IEdgeInsights/DataStore
Copy the IEdgeInsights/build/.env file using the following command in the current folder, if not already present.
cp ../build/.env .Note: Ensure that
docker psis clean anddocker network lsdoesn’t have EII bridge networks.
Update .env file for following:
1. HOST_IP and ETCD_HOST variables with your system IP.
2. `READ_CONFIG_FROM_FILE_ENV` value is set to `false`.
3. Set the values for 'INFLUXDB_USERNAME', 'INFLUXDB_PASSWORD', 'MINIO_ACCESS_KEY', 'MINIO_SECRET_KEY' which are InfluxDB and MinIO object storage credentials
Copy the docker-compose.yml from IEdgeInsights/ConfigMgrAgent as docker-compose.override.yml in IEdgeInsights/DataStore.
cp ../ConfigMgrAgent/docker-compose.yml docker-compose.override.yml
Copy the builder.py with standalone mode changes from IEdgeInsights/build directory
cp ../build/builder.py .Run the builder.py in standalone mode, this will generate eii_config.json and update docker-compose.override.yml
python3 builder.py -s trueBuilding the service (This step is optional for building the service if not already done in the
Independently buildablestep above)docker-compose buildFor running the service in PROD mode, run the below command:
NOTE: Make sure to update
DEV_MODEtofalsein .env while running in PROD mode and source the .env using the commandset -a && source .env && set +a.docker-compose up -dFor running the service in DEV mode, run the below command:
NOTE: Make sure to update
DEV_MODEtotruein .env while running in DEV mode and source the .env using the commandset -a && source .env && set +a.docker-compose -f docker-compose.yml -f docker-compose-dev.override.yml -f docker-compose.override.yml up -d
Data Store Configuration
The configurations for Data Store Service are added in etcd. The configuration details are available in the docker-compose file, under AppName in the environment section of the app’s service definition.
For the scenario, when the AppName is DataStore, the following example shows how the app’s config will look for /DataStore/config key in etcd:
"datatypes": {
  "json": {
       "host" : "ia_influxdb",
       "port": 8086,
       "dbname": "datain",
       "verifySsl": false,
       "ignoreKeys": [
         "defects"
       ],
       "tagKeys": [],
       "retention": "1h",
       "topics": [
         "*"
       ],
       "retentionPollInterval": "60s"
   },
  "blob": {
       "host" : "ia_miniodb",
       "port": 9000,
       "dbname": "image-store-bucket",
       "retention": "1h",
       "topics": [
         "edge_video_analytics_results"
       ],
       "retentionPollInterval": "60s"
  }
},
"dbs": {
   "json": "influxdb",
   "blob": "miniodb"
}
The following are the details of the keys in the above config:
datatype (required)
The
hostis optional parameter in configuration, which is used for connecting the respective Database servers (Local/Remote). If the parameter is not provided, by default JSON Datatype will be selected withia_influxdband Blob Datatype will be selected withia_miniodbThe
portis optional parameter in configuration, which is used for connecting the respective Database servers port(Local/Remote). If the parameter is not provided, by default JSON Datatype will be selected with8086forInflux DB&6030forTDEngine DBand Blob Datatype will be selected with9000forMinio Object StorageThe
topicskey determines which messages are to be processed by the corresponding DB microservice. Only the messages with a topic listed intopicskey are processed by the individual module. Iftopicscontain\*, then all the messages are processed.The
retentionis required parameter in configuration. The retention parameter specifies the retention policy to apply for the images stored in MinIO object storage. In case of infinite retention time, set it to “”. Suitable duration string value as mentioned at https://golang.org/pkg/time/#ParseDuration.The
retentionPollIntervalis required parameter in configuration. Used to set the time interval for checking images for expiration. Expired images will become candidates for deletion and no longer retained. In case of infinite retention time, this attribute will be ignored. Suitable duration string value as mentioned at https://golang.org/pkg/time/#ParseDuration
dbs (Optional)
The
jsonis optional parameter in dbs configuration, which is used for selection of db for JSON(Metadata) Datatype. Options available areinfluxdb,tdenginedbThe
blobis optional parameter in dbs configuration, which is used for selection of db for BLOB Datatype. Options available areminiodb
By default, both the DBs will be enabled. If you want to disable any of the above DBs, remove the corresponding key and its value from the config.
For Example, if you are not using MinIO object storage, you can disable the same and modify the config as below:
"datatypes": {
  "json": {
       "host" : "ia_influxdb",
       "port": 8086,
       "dbname": "datain",
       "verifySsl": false,
       "ignoreKeys": [
         "defects"
       ],
       "tagKeys": [],
       "retention": "1h",
       "topics": [
         "*"
       ],
       "retentionPollInterval": "60s"
   }
}
JSON Datatype (InfluxDB/TDEngineDB)
For nested json data, by default, Data Store will flatten the nested json and push the flat data to InfluxDB to avoid the flattening of any particular nested key mention the tag key in the config.json(``[WORK_DIR]/IEdgeInsights/DataStore/config.json``) file. Currently the defects key is ignored from flattening. Every key to be ignored has to be in a new line.
For example,
ignore_keys = [ "Key1", "Key2", "Key3" ]
By default, all the keys in the data schema will be pushed to InfluxDB as fields. If tags are present in data schema, it can be mentioned in the config.json(``[WORK_DIR]/IEdgeInsights/DataStore/config.json``) file then the data pushed to InfluxDB, will have fields and tags both. At present, no tags are visible in the data scheme and tag_keys are kept blank in the config file.
For Example,
tag_keys = [ "Tag1", "Tag2" ]
Configuring TDEngine as JSON Datatype
Note: Data Store with TD Engine is not fully tested to work with Vision and Time-series usecase.
Default JSON Datatype will be
influxdbto choose tdengine as JSON Datatype follow the below steps.Add
dbsto config.json(``[WORK_DIR]/IEdgeInsights/DataStore/config.json``) addingjsontype astdenginedb"dbs": { "json": "tdenginedb" }
Adding
ia_tdenginedbservice to docker-compose.yml. Copy Contents of docker-compose-dev.tdengine.yml(``[WORK_DIR]/IEdgeInsights/DataStore/docker-compose-dev.tdengine.yml``) and add it docker-compose.yml(``[WORK_DIR]/IEdgeInsights/DataStore/docker-compose.yml``). If required serviceia_influxdbcan be removed from docker-compose.yml(``[WORK_DIR]/IEdgeInsights/DataStore/docker-compose.yml``).
Note
1. `TD Engine DB` using Line protocol for Inserting Data into database.
2. `TD Engine DB` works on the default credentials and doesn't requires adding to .env <br>
3. Currently `PROD Mode` of `TD Engine DB` doesn't use any certificates. `PROD` mode works as same as `DEV` mode. <br>
4. Subscription of Table data (Topics in Publishers) requires the table created before Data Store starts. <br>
5. Deleting/Droping of table would make DS to misbehave due to TDEngine Handler(Only when DS is subscribed to respective table)
Blob Datatype (MinIO Object Storage)
The MinIO object storage primarily subscribes to the stream that comes out of the EdgeVideoAnalayticsMicroservice app via EII messagebus and stores the frame into minio for historical analysis.
The high-level logical flow of MinIO object storage is as follows:
The EII messagebus subscriber in MinIO object storage will subscribe to the EdgeVideoAnalayticsMicroservice published classified result (metadata, frame) on the EII messagebus. The img_handle is extracted out of the metadata and is used as the key and the frame is stored as a value for that key in minio persistent storage.
EII Msgbus Interface
Data Store will start the EII messagebus Publisher, EII messagebus Subscriber threads, and EII messagebus request reply thread based on PubTopics, SubTopics and Server configuration.
EII messagebus Subscriber thread connects to the PUB socket of EII messagebus on which the data is published by EdgeVideoAnalayticsMicroservice and push it to the InfluxDB(Metadata).
EII messagebus Publisher thread will publish the point data ingested by the telegraf and the classifier result coming out of the point data analytics.
EII Msgbus Request-Response Interface
For a historical analysis of the stored classified images or metadata, Data Store starts a EII Messagebus/gRPC Request-Response Interface server which provides the read, write, update, list, delete interfaces.
The payload format are defined in EII Msgbus/gRPC Request-Response Endpoints
Note
1. The gRPC request-response interface server currently supports **DEV mode** only.
DB Server Supported Version
Currently DB Handlers are supported and tested with below mentioned version for respective DB Server
S.No | DB Server | Supported Version — | — | — 1 | Influx | 1.8.7 2 | Minio | RELEASE.2020-12-12T08-39-07Z 3 | TDEngine | 3.0.2.5
Edge Video Analytics Microservice for Edge insights for Industrial (EII) Overview
The Edge Video Analytics Microservice (EVAM) combines video ingestion and analytics capabilities provided by Edge insights for Industrial (EII) visual ingestion and analytics modules. This directory provides the Intel® Deep Learning Streamer (Intel® DL Streamer) pipelines to perform object detection on an input URI source and send the ingested frames and inference results using the MsgBus Publisher. It also provides a Docker compose and config file to use EVAM with the Edge insights software stack.
Prerequisites
As a prerequisite for using EVAM in EII mode, download EII 4.0.0 package from EII 4.0.0 package from ESH and complete the following steps:
EII when downloaded from ESH would be available at the installed location
cd [EII installed location]/IEdgeInsights
Complete the prerequisite for provisioning the EII stack by referring to the README.md.
Download the required model files to be used for the pipeline mentioned in the config(
[WORK_DIR]/IEdgeInsights/EdgeVideoAnalyticsMicroservice/eii/config.json) file by completing step 2 to step 4 as mentioned in the README. ..Note: The model files are large and hence they are not part of the repo.
Run the following commands to set the environment, build the
ia_configmgr_agentcontainer and copy models to the required directory:Go to the
builddirectory:
cd [WORK_DIR]/IEdgeInsights/build
Configure visualizer app’s subscriber interfaces. Example: Add the following
interfaceskey value inVisualizer/multimodal-data-visualization-streaming/eii/config.jsonandVisualizer/multimodal-data-visualization/eii/config.jsonfiles.
"interfaces": {
   "Subscribers": [
      {
          "Name": "default",
          "Type": "zmq_tcp",
          "zmq_recv_hwm": 50,
          "EndPoint": "ia_edge_video_analytics_microservice:65114",
          "PublisherAppName": "EdgeVideoAnalyticsMicroservice",
          "Topics": [
              "edge_video_analytics_results"
          ]
      }
  ]
}
Execute the builder.py script
python3 builder.py -f usecases/video-streaming-evam.yml
Create some necessary items for the service
sudo mkdir -p /opt/intel/eii/models/
Copy the downloaded model files to /opt/intel/eii
sudo cp -r [downloaded_model_directory]/models /opt/intel/eii/
Run the Containers
To run the containers in the detached mode, run the following command:
# Run config manager agent service first using the below command

docker-compose up -f ia_configmgr_agent

# Check config manager agent logs to see if provisioning is complete

docker logs -f ia_configmgr_agent

# Once provisioning is done run other services

docker-compose up -d
The ETCD watch capability is enabled for Edge Video Analytics Microservice and it will restart when config/interface changes are done via the EtcdUI interface. While changing the pipeline/pipeline_version, make sure they are volume mounted to the container.
Configuration
See the edge-video-analytics-microservice/eii/config.json([WORK_DIR]/IEdgeInsights/EdgeVideoAnalyticsMicroservice/eii/config.json) file for the configuration of EVAM. The default configuration will start the
object_detection demo for EII.
The config file is divided into two sections as follows:
Config
The following table describes the attributes that are supported in the config section.
Parameter |
Description |
|---|---|
|
Type of EII certs to be created. This should be |
|
Source of the frames. This should be |
|
The name of the DL Streamer pipeline to use. This should correspond to a directory in the pipelines directory). |
|
The version of the pipeline to use. This typically is a subdirectory of a pipeline in the pipelines directory. |
|
The Boolean flag for whether to publish the metadata and the analyzed frame, or just the metadata. |
|
Encodes the image in jpeg or png format. |
Note
For
jpegencoding type, level is the quality from 0 to 100. A higher value means better quality.For
pngencoding type, level is the compression level from 0 to 9. A higher value means a smaller size and longer compression time.
Interfaces
Currently in the EII mode, EVAM supports launching a single pipeline and publishing on a single topic. This implies that in the configuration file (“config.json”), the single JSON object in the Publisher list is where the configuration resides for the published data. For more details on the structure, refer to the EII documentation.
EVAM also supports subscribing and publishing messages or frames using the Message Bus. The endpoint details for the EII service you need to subscribe from are to be provided in the Subscribers section in the config([WORK_DIR]/IEdgeInsights/EdgeVideoAnalyticsMicroservice/eii/config.json) file and the endpoints where you need to publish to are to be provided in Publishers section in the config([WORK_DIR]/IEdgeInsights/EdgeVideoAnalyticsMicroservice/eii/config.json) file.
To enable injection of frames into the GStreamer pipeline obtained from Message Bus, ensure to make the following changes:
The source parameter in the config(
[WORK_DIR]/IEdgeInsights/EdgeVideoAnalyticsMicroservice/eii/config.json) file is set to msgbus. Refer to the following code snippet:"config": { "source": "msgbus" }
The pipeline is set to appsrc as source instead of uridecodebin. Refer to the following code snippet:
{
    "pipeline": "appsrc name=source ! rawvideoparse ! appsink name=destination"
}
Steps to Independently Build and Deploy EdgeVideoAnalyticsMicroservice Service
Note
For running two or more microservices, we recommend users to try the use case-driven approach for building and deploying as mentioned in Generate Consolidated Files for a Subset of Edge Insights for Industrial Services
Steps to Independently Build EdgeVideoAnalyticsMicroservice Service
Note
When switching between independent deployment of the service with and without config manager agent service dependency, one would run into issues with docker-compose build w.r.t Certificates folder existence. As a workaround, please run command sudo rm -rf Certificates to proceed with docker-compose build.
To independently build EdgeVideoAnalyticsMicroservice service, complete the following steps:
The downloaded source code should have a directory named EdgeVideoAnalyticsMicroservice/eii:
cd IEdgeInsights/EdgeVideoAnalyticsMicroservice/eii
Copy the IEdgeInsights/build/.env file using the following command in the current folder
cp ../../build/.env .
NOTE: Update the HOST_IP and ETCD_HOST variables in the .env file with your system IP.
# Source the .env using the following command:
set -a && source .env && set +a
Independently build
docker-compose build
Steps to Independently Deploy EdgeVideoAnalyticsMicroservice Service
You can deploy the EdgeVideoAnalyticsMicroservice service in any of the following two ways:
Deploy EdgeVideoAnalyticsMicroservice Service without Config Manager Agent Dependency
Run the following commands to deploy EdgeVideoAnalyticsMicroservice service without Config Manager Agent dependency:
# Enter the eii directory
cd IEdgeInsights/EdgeVideoAnalyticsMicroservice/eii
Copy the IEdgeInsights/build/.env file using the following command in the current folder, if not already present.
cp ../../build/.env .Note: Ensure that
docker psis clean anddocker network lsmust not have EII bridge network.
Update .env file for the following:
1. HOST_IP and ETCD_HOST variables with your system IP.
2. `READ_CONFIG_FROM_FILE_ENV` value to `true` and `DEV_MODE` value to `true`.

Source the .env using the following command:
set -a && source .env && set +a
# Run the service
docker-compose -f docker-compose.yml -f docker-compose-dev.override.yml up -d
Deploy EdgeVideoAnalyticsMicroservice Service with Config Manager Agent Dependency
Run the following commands to deploy EdgeVideoAnalyticsMicroservice service with Config Manager Agent dependency:
Note: Ensure that the Config Manager Agent image present in the system. If not, build the Config Manager Agent locally when independently deploying the service with Config Manager Agent dependency.
# Enter the eii directory
cd IEdgeInsights/EdgeVideoAnalyticsMicroservice/eii
Copy the IEdgeInsights/build/.env file using the following command in the current folder, if not already present.
cp ../../build/.env .Note: Ensure that
docker psis clean anddocker network lsdoesn’t have EII bridge networks.
Update .env file for following:
1. HOST_IP and ETCD_HOST variables with your system IP.
2. `READ_CONFIG_FROM_FILE_ENV` value is set to `false`.
Copy the docker-compose.yml from IEdgeInsights/ConfigMgrAgent as docker-compose.override.yml
cp ../../ConfigMgrAgent/docker-compose.yml docker-compose.override.yml
Copy the builder.py with standalone mode changes from IEdgeInsights/build directory
cp ../../build/builder.py .Run the builder.py in standalone mode, this will generate eii_config.json and update docker-compose.override.yml
python3 builder.py -s trueBuilding the service (This step is optional for building the service if not already done in the
Independently buildablestep above)docker-compose buildRunning the service
Note: Source the .env using the command
set -a && source .env && set +abefore running the below command.docker-compose -f docker-compose.yml -f docker-compose-dev.override.yml -f docker-compose.override.yml up -d
Camera Configurations
You need to make changes to the config.json([WORK_DIR]/IEdgeInsights/EdgeVideoAnalyticsMicroservice/eii/config.json) and the templates section of the pipeline.json([WORK_DIR]/IEdgeInsights/pipeline.json) files while configuring cameras.
By default the pipeline.json([WORK_DIR]/IEdgeInsights/pipeline.json) file has the RTSP camera configurations.
The camera configurations for the Edge Video Analytics Microservice module are as follows:
GenICam GigE or USB3 Cameras
Note
As Matrix Vision SDK([WORK_DIR]/IEdgeInsights/EdgeVideoAnalyticsMicroservice/eii/mvGenTL_Acquire-x86_64_ABI2-2.44.1.tgz) is being used with evaluation license, one would start seeing watermark after 200 ingested images when using a non Matrix Vision camera. One has to purchase the Matrix Vision license to remove this watermark or use a Matrix Vision camera or integrate the respective camera SDK(Eg: basler camera SDK for basler cameras).
For more information or configuration details for the GenICam GigE or the USB3 camera support, refer to the GenICam GigE/USB3.0 Camera Support.
Prerequisites for Working with the GenICam Compliant Cameras
The following are the prerequisites for working with the GeniCam compliant cameras.
Note
For other cameras such as RSTP, and USB (v4l2 driver compliant) revert the changes that are mentioned in this section. Refer to the following snip of the
ia_edge_video_analytics_microserviceservice, to add the required changes in the docker-compose.yml([WORK_DIR]/IEdgeInsights/EdgeVideoAnalyticsMicroservice/eii/docker-compose.yml) file. After making the changes, before you build and run the services, ensure to run the builder.py([WORK_DIR]/IEdgeInsights/build/builder.py).
For GenICam GigE cameras:
Update the ETCD_HOST key with the current system’s IP in the .env([WORK_DIR]/IEdgeInsights/build/.env) file.
ETCD_HOST=<HOST_IP>
Add network_mode: host in the docker-compose.yml([WORK_DIR]/IEdgeInsights/EdgeVideoAnalyticsMicroservice/eii/docker-compose.yml) file and comment/remove networks and ports sections.
Make the following changes in the docker-compose.yml([WORK_DIR]/IEdgeInsights/EdgeVideoAnalyticsMicroservice/eii/docker-compose.yml) file.
ia_edge_video_analytics_microservice:
  # Add network mode host
  network_mode: host
  # Please make sure that the above commands are not added under the environment section and also take care about the indentations in the compose file.
  ...
  environment:
  ...
    # Add HOST_IP to no_proxy and ETCD_HOST
    no_proxy: "<eii_no_proxy>,${RTSP_CAMERA_IP},<HOST_IP>"
    ETCD_HOST: ${ETCD_HOST}
  ...
  # Comment networks section will throw an error when network mode host is used.
  # networks:
    # - eii
  # Comment ports section as following
  # ports:
  #   - '65114:65114'
Configure visualizer app’s subscriber interfaces in the Multimodal Data Visualization Streaming’s config.json file as follows.
"interfaces": {
   "Subscribers": [
      {
      "Name": "default",
      "Type": "zmq_tcp",
      "EndPoint": "<HOST_IP>:65114",
      "PublisherAppName": "EdgeVideoAnalyticsMicroservice",
      "Topics": [
          "edge_video_analytics_results"
      ]
      }
   ]
}
Note
Add <HOST_IP> to the no_proxy environment variable in the Multimodal Data Visualization Streaming visualizer’s docker-compose.yml file.
For GenIcam USB3.0 cameras:
ia_edge_video_analytics_microservice:
  ...
  environment:
    # Refer [GenICam GigE/USB3.0 Camera Support](/4.1/IEdgeInsights/EdgeVideoAnalyticsMicroservice/eii/docs/generic_plugin_doc.html) to install the respective camera SDK
    # Setting GENICAM value to the respective camera/GenTL producer which needs to be used
    GENICAM: "<CAMERA/GenTL>"
  ...
Note
If the GenICam cameras do not get initialized during the runtime, then on the host system, run the
docker system prunecommand. After that, remove the GenICam specific semaphore files from the/dev/shm/path of the host system. Thedocker system prunecommand will remove all the stopped containers, networks that are not used (by at least one container), any dangling images, and build cache which could prevent the plugin from accessing the device.If you get the
Feature not writablemessage while working with the GenICam cameras, then reset the device using the camera software or using the reset property of the Generic Plugin. For more information, refer the README.
Refer the following configuration for configuring the config.json(
[WORK_DIR]/IEdgeInsights/EdgeVideoAnalyticsMicroservice/eii/config.json) file for GenICam GigE/USB3.0 cameras."pipeline": "gencamsrc serial=<DEVICE_SERIAL_NUMBER> pixel-format=<PIXEL_FORMAT> width=<IMAGE_WIDTH> height=<IMAGE_HEIGHT> name=source ! videoconvert ! video/x-raw,format=BGR ! appsink name=destination"
Refer to the docs/basler_doc.md for more information/configuration on Basler camera.
Note:
Generic Plugin can work only with GenICam compliant cameras and only with gstreamer ingestor.
The above gstreamer pipeline was tested with Basler and IDS GigE cameras.
If
serialis not provided, then the first connected camera in the device list will be used.If
pixel-formatis not provided then the defaultmono8pixel format will be used.If
widthandheightproperties are not set then gencamsrc plugin will set the maximum resolution supported by the camera.By default,
exposure-autoproperty is set to on. If the camera is not placed under sufficient light then with auto exposure,exposure-timecan be set to very large value which will increase the time taken to grab frame. This can lead toNo frame received error. Hence it is recommended to manually set exposure as in the following sample pipeline when the camera is not placed under good lighting conditions.throughput-limitis the bandwidth limit for streaming out data from the camera(in bytes per second). Setting this property to a higher value might result in better FPS but make sure that the system and the application can handle the data load otherwise it might lead to memory bloat. Refer the below example pipeline to use the above mentioned properties: .. code-block:: javascript“pipeline”: “gencamsrc serial=<DEVICE_SERIAL_NUMBER> pixel-format=ycbcr422_8 width=1920 height=1080 exposure-time=5000 exposure-mode=timed exposure-auto=off throughput-limit=300000000 name=source ! videoconvert ! video/x-raw,format=BGR ! appsink name=destination”
While using the basler USB3.0 camera, ensure that the USBFS limit is set to atleast 256MB or more. You can verify this value by using command
cat /sys/module/usbcore/parameters/usbfs_memory_mb. If it is less than 256MB, then follow these steps to increase the USBFS value.
RTSP Cameras
Update the RTSP camera IP or the simulated source IP to the RTSP_CAMERA_IP variable in the .env([WORK_DIR]/IEdgeInsights/build/.env) file. Refer to the docs/rtsp_doc.md for information/configuration on RTSP camera.
Refer the following configuration for configuring the config.json(
[WORK_DIR]/IEdgeInsights/EdgeVideoAnalyticsMicroservice/eii/config.json) file for RTSP camera.
"pipeline": "rtspsrc location=\"rtsp://<USERNAME>:<PASSWORD>@<RTSP_CAMERA_IP>:<PORT>/<FEED>\" latency=100 name=source ! rtph264depay ! h264parse ! vaapih264dec ! vaapipostproc format=bgrx ! videoconvert ! video/x-raw,format=BGR ! appsink name=destination"
Note
The RTSP URI of the physical camera depends on how it is configured using the camera software. You can use VLC Network Stream to verify the RTSP URI to confirm the RTSP source.
USB v4l2 Cameras
For information or configurations details on the USB cameras, refer to docs/usb_doc.md.
Refer the following configuration for configuring the config.json(
[WORK_DIR]/IEdgeInsights/EdgeVideoAnalyticsMicroservice/eii/config.json) file for USB v4l2 camera.
"pipeline": "v4l2src device=/dev/<DEVICE_VIDEO_NODE> name=source ! video/x-raw,format=YUY2 ! videoconvert ! video/x-raw,format=BGR ! appsink name=destination"
EII UDFLoader Overview
UDFLoader is a library providing APIs for loading and executing native and python UDFs.
Dependency Installation
UDFLoader depends on the following libraries. Follow the documentation to install the libraries:
OpenCV - Run
source /opt/intel/openvino/bin/setupvars.shcommandPython3 Numpy package
Compilation
Utilizes CMake as the build tool for compiling the library. The simplest sequence of commands for building the library are shown below.
mkdir build
cd build
cmake ..
make
If you wish to compile in debug mode, then you can set the CMAKE_BUILD_TYPE to Debug when executing the cmake command (as shown below).
cmake -DCMAKE_BUILD_TYPE=Debug ..
Installation
Note
This is a mandatory step to use this library in C/C++ EII modules.
If you wish to install this library on your system, execute the following command after building the library:
sudo make install
By default, this command will install the udfloader library into
/usr/local/lib/. On some platforms this is not included in the LD_LIBRARY_PATH
by default. As a result, you must add this directory to you LD_LIBRARY_PATH. This can
be accomplished with the following export:
export LD_LIBRARY_PATH=$LD_LIBRARY_PATH:/usr/local/lib/
Note
You can also specify a different library prefix to CMake through
the CMAKE_INSTALL_PREFIX flag.
Running Unit Tests
Note
The unit tests will only be compiled if the WITH_TESTS=ON option
is specified when running CMake.
Run the following commands from the build/tests folder to cover the unit
tests.
# First, source the source.sh file to setup the PYTHONPATH environment
source ./source.sh

# Execute frame abstraction unit tests
./frame-tests

# Execute UDF loader unit tests
./udfloader-tests
EII Sample UDFs
Edge Insights for Industrial (EII) supports the loading and executing of native (C++) and python UDFs. In here, you can find the sample native and python User Defined Functions (UDFs) to be used with EII components like EdgeVideoAnalyticsMicroservice. The UDFs can modify the frame, drop the frame and generate meta-data from the frame.
User Defined Function (UDF)
An UDF is a chunk of user code that acts as a filter, preprocessor, or classifier for a given data input coming from the EII. The User Defined Function (UDF) Loader Library provides a common API for loading C++ and Python UDFs.
The library itself is written in C++ and provides an abstraction layer for loading and calling UDFs. Additionally, the library defines a common interface inheritable by all UDFs (whether written in C++ or Python).
The overall block diagram for the library is shown in the following figure.
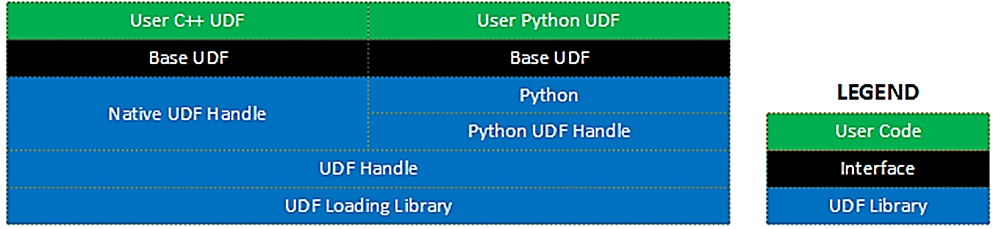
In this case, the EdgeVideoAnalyticsMicroservice component is also able to execute the video data classifier algorithm by including the classifier UDF into the EdgeVideoAnalyticsMicroservice configuration.
Multimodal Data Visualization Microservice Overview
The Multimodal Data Visualization microservice provides functionality to represent the data graphically. Using this service, you can visualize the video streaming and Time Series data. The following containers run as a part of the Multimodal Data Visualization microservice:
multimodal-data-visualization
multimodal-data-visualization-streaming
The multimodal-data-visualization-streaming container gets the ingested frames and the inference results from the MsgBus subscriber and it then renders the video to a webpage. This webpage is embedded in Grafana* to visualize the video stream and the Time Series data on the same dashboard.
This directory provides a Docker compose and config file to use the Multimodal Data Visualization microservice with the Edge Insights for Industrial software stack.
Prerequisites
As a prerequisite for the Multimodal Data Visualization microservice, complete the following steps:
EII when downloaded from ESH would be available at the installed location
cd [EII installed location]/IEdgeInsights
Complete the prerequisite for provisioning the EII stack. For more information, refer to the README.md.
Run the following commands to set the environment and build the
ia_configmgr_agentcontainer:cd [WORK_DIR]/IEdgeInsights/build # Execute the builder.py script python3 builder.py -f usecases/video-streaming.yml
Run the Containers
To pull the prebuilt EII container images and Multimodal Data Visualization microservice images from Docker Hub and run the containers in the detached mode, run the following command:
# Start the docker containers
docker-compose up -d
Note
The prebuilt container image for the Multimodal Data Visualization microservice
gets downloaded when you run the docker-compose up -d command, if the image is not already present on the host system.
Interfaces Section
In the EII mode, the endpoint details for the EII service you need to subscribe from are to be provided in the Subscribers section in the config([WORK_DIR]/IEdgeInsights/Visualizer/config.json) file.
For more details on the structure, refer to the EII documentation.
Grafana Overview
Grafana supports various storage backends for the Time Series data (data source). EII uses InfluxDB as the data source. Grafana connects to the InfluxDB data source that is preconfigured as a part of the Grafana setup. The ia_influxdbconnector and ia_webservice service must be running for Grafana to be able to collect the Time Series data and stream the video respectively. After the data source starts working, you can use the preconfigured dashboard to visualize the incoming data. You can also edit the dashboard as required.
After the Multimodal Data Visualization microservice is up, you can access Grafana at http://
Grafana Configuration
The following are the configuration details for Grafana:
dashboard.json(
[WORK_DIR]/IEdgeInsights/Visualizer/multimodal-data-visualization/eii/dashboard.json): This is the dashboard json file that is loaded when Grafana starts. It is preconfigured to display the Time Series data.dashboards.yml(
[WORK_DIR]/IEdgeInsights/Visualizer/multimodal-data-visualization/eii/dashboards.yml): This is the config file for all the dashboards. It specifies the path to locate all the dashboard json files.datasources.yml(
[WORK_DIR]/IEdgeInsights/Visualizer/multimodal-data-visualization/eii/datasources.yml): This is the config file for setting up the data source. It has various fields for data source configuration.grafana.ini(
[WORK_DIR]/IEdgeInsights/Visualizer/multimodal-data-visualization/eii/grafana.ini): This is the config file for Grafana. It specifies how Grafana should start after it is configured.
Note
You can edit the contents of these files based on your requirement.
Run Grafana in the PROD Mode
Note
Skip this section, if you are running Grafana in the DEV mode.
To run Grafana in the PROD mode, import cacert.pem from the build/Certificates/rootca/ directory to the browser certificates. Complete the following steps to import certificates:
In Chrome browser, go to Settings.
In Search settings, enter Manage certificates.
In Privacy and security, click Security.
On the Advanced section, click Manage certificates.
On the Certificates window, click the Trusted Root Certification Authorities tab.
Click Import.
On the Certificate Import Wizard, click Next.
Click Browse.
Go to the
IEdgeInsights/build/Certificates/rootca/directory.Select the cacert.pem file, and provide the necessary permissions, if required.
Select all checkboxes and then, click Import.
Run Grafana for a Video Use Case
Complete the following steps to run Grafana for a video use case:
Ensure that the endpoint of the publisher, that you want to subscribe to, is mentioned in the Subscribers section of the config(
[WORK_DIR]/IEdgeInsights/Visualizer/config.json) file.Use root as the Username and eii123 Password both for first login, password can be changed if required when prompted after logging in.
On the Home Dashboard page, on the left corner, click the Dashboards icon.
Click the Manage Dashboards tab, to view the list of all the preconfigured dashboards.
Select EII Video and Time Series Dashboard, to view multiple panels with topic names of the subscriber as the panel names along with a time-series panel named
Time Series.Hover over the topic name. The panel title will display multiple options.
Click View to view the subscribed frames for each topic.
Note
Changing gridPos for the video frame panels is prohibited since these values are altered internally to support multi-instance.
Grafana does not support visualization for GVA and CustomUDF streams.
Multimodal Data Visualization Streaming
Multimodal Data Visualization Streaming is part of Multimodal Data Visualization microservice which helps in streaming the processed video to the Webpage. This URL where the streaming is happening is used in Grafana based Visualization service for Visualization. For e.g., in EVAM mode, it uses WebRTC framework to get the processed video from Edge Video Analytics service and stream it to the Web Page. This Web page is embedded in Grafana Dashboard using the AJAX panel to visualize the stream along with the other metrics related to Video Processing. Similarly, in EII mode, the Webservice gets the ingested frames and inference results from the MsgBus subscriber and render the video to the webpage. This webpage is then used in Grafana for Visualization.
Steps to Independently Build and Deploy “Multimodal Data Visualization Streaming” Service
Note
For running 2 or more microservices, we recommend users to try the use case-driven approach for building and deploying as mentioned in Generate Consolidated Files for a Subset of Edge Insights for Industrial Services.
Steps to Independently Build “Multimodal Data Visualization Streaming” Service
Note
When switching between independent deployment of the service with and without config manager agent service dependency, one would run into issues with docker-compose build w.r.t Certificates folder existence. As a workaround, please run command sudo rm -rf Certificates to proceed with docker-compose build.
To independently build “Multimodal Data Visualization Streaming” service, complete the following steps:
The downloaded source code should have a directory named Visualizer:
cd IEdgeInsights/Visualizer/multimodal-data-visualization-streaming/eii
Copy the IEdgeInsights/build/.env file using the following command in the current folder
cp ../../../build/.env .
NOTE: Update the HOST_IP and ETCD_HOST variables in the .env file with your system IP.
# Source the .env using the following command:
set -a && source .env && set +a
Independently build
docker-compose build
Steps to Independently Deploy “Multimodal Data Visualization Streaming” Service
You can deploy the “Multimodal Data Visualization Streaming” service in any of the following two ways:
Deploy “Multimodal Data Visualization Streaming” Service without Config Manager Agent Dependency
Run the following commands to deploy “Multimodal Data Visualization Streaming” service without Config Manager Agent dependency:
# Enter the multimodal-data-visualization-streaming directory
cd IEdgeInsights/Visualizer/multimodal-data-visualization-streaming/eii
Copy the IEdgeInsights/build/.env file using the following command in the current folder, if not already present.
cp ../../../build/.env .Note: Ensure that
docker psis clean anddocker network lsmust not have EII bridge network.
Update .env file for the following:
1. HOST_IP and ETCD_HOST variables with your system IP.
2. `READ_CONFIG_FROM_FILE_ENV` value to `true` and `DEV_MODE` value to `true`.

Source the .env using the following command:
set -a && source .env && set +a
# Run the service
docker-compose -f docker-compose.yml -f docker-compose-dev.override.yml up -d
Deploy “Multimodal Data Visualization Streaming” Service with Config Manager Agent Dependency
Run the following commands to deploy “Multimodal Data Visualization Streaming” service with Config Manager Agent dependency:
Note
Ensure that the Config Manager Agent image present in the system. If not, build the Config Manager Agent locally when independently deploying the service with Config Manager Agent dependency.
# Enter the multimodal-data-visualization directory
cd IEdgeInsights/Visualizer/multimodal-data-visualization/eii
Copy the IEdgeInsights/build/.env file using the following command in the current folder, if not already present.
cp ../../../build/.env .Note: Ensure that
docker psis clean anddocker network lsdoesn’t have EII bridge networks.
Update .env file for following:
1. HOST_IP and ETCD_HOST variables with your system IP.
2. `READ_CONFIG_FROM_FILE_ENV` value is set to `false`.
Copy the docker-compose.yml from IEdgeInsights/ConfigMgrAgent as docker-compose.override.yml
cp ../../../ConfigMgrAgent/docker-compose.yml docker-compose.override.yml
Copy the builder.py with standalone mode changes from IEdgeInsights/build directory
cp ../../../build/builder.py .Run the builder.py in standalone mode, this will generate eii_config.json and update docker-compose.override.yml
python3 builder.py -s trueBuilding the service (This step is optional for building the service if not already done in the
Independently buildablestep above)docker-compose buildFor running the service in PROD mode, run the below command:
NOTE: Make sure to update
DEV_MODEtofalsein .env while running in PROD mode and source the .env using the commandset -a && source .env && set +a.docker-compose up -dFor running the service in DEV mode, run the below command:
NOTE: Make sure to update
DEV_MODEtotruein .env while running in DEV mode and source the .env using the commandset -a && source .env && set +a.docker-compose -f docker-compose.yml -f docker-compose-dev.override.yml -f docker-compose.override.yml up -dNOTE: When running in DEV mode, use the following link
http://<IP>:5004/<SUBSCRIBER TOPIC NAME>to view output.
Run Multimodal Data Visualization Streaming Service with EdgeVideoAnalyticsMicroservice
For running Multimodal Data Visualization Streaming with EdgeVideoAnalyticsMicroservice as a publisher, the config can be updated to subscribe to the EndPoint and topic of EdgeVideoAnalyticsMicroservice in the following way:
{
    "interfaces": {
        "Subscribers": [
            {
                "Name": "default",
                "Type": "zmq_tcp",
                "EndPoint": "ia_edge_video_analytics_microservice:65114",
                "PublisherAppName": "EdgeVideoAnalyticsMicroservice",
                "Topics": [
                    "edge_video_analytics_results"
                ]
            }
        ]
    }
}
DataStore
For more details see the DataStore Microservice section.
Time Series Analytics
For time series data, a sample analytics flow uses Telegraf for ingestion, Influx DB for storage, and Kapacitor for classification. This is demonstrated with an MQTT-based ingestion of sample temperature sensor data and analytics with a Kapacitor UDF that detects threshold for the input values.
The services mentioned in the build/usecases/time-series.yml([WORK_DIR]/IEdgeInsights/build/usecases/time-series.yml) file will be available in the consolidated docker-compose.yml and consolidated build/eii_config.json of the EII stack for the time series use case when built via builder.py as called out in previous steps.
This will enable building of the Telegraf and the Kapacitor based analytics containers.
For more details on enabling this mode, refer to the Kapacitor/README.md
The sample temperature sensor can be simulated using the MQTT publisher. For more information, refer to the tools/mqtt/README.md.
Telegraf Overview
Telegraf is a part of the TICKstack. It is a plugin-based agent that has many input and output plugins. In EII’s basic configuration, it’s being used for data ingestion and sending data to influxDB. However, the EII framework does not restrict any features of Telegraf.
Plugins
The plugin subscribes to a configured topic or topic prefixes. The plugin has a component called a subscriber, which receives the data from the EII message bus. After receiving the data, depending on the configuration, the plugin processes the data, either synchronously or asynchronously.
In synchronous processing**, the receiver thread (the thread that receives the data from the message bus) is also responsible for processing the data (JSON parsing). After processing the previous data only, the receiver thread processes the next data available on the message bus.
In asynchronous processing the receiver thread receives the data and put it into the queue. A pool of threads will be dequeuing the data from the queue and processing it.
Guidelines for choosing the data processing options are as follows:
Synchronous option:When the ingestion rate is consistent
Asynchronous options:There are two options
Topic-specific queue+threadpool:Frequent spike in ingestion rate for a specific topic
Global queue+threadpool:Sometimes spike in ingestion rate for a specific topic
Steps to Independently Build and Deploy the Telegraf Service
Note
For running 2 or more microservices, we recommend users to try the use case-driven approach for building and deploying as mentioned in Generate Consolidated Files for a Subset of Edge Insights for Industrial Services.
Steps to Independently Build the Telegraf Service
Note
When switching between independent deployment of the service with and without config manager agent service dependency, one would run into issues with docker-compose build w.r.t Certificates folder existence. As a workaround, run the command sudo rm -rf Certificates to proceed with docker-compose build.
To independently build Telegraf service, complete the following steps:
The downloaded source code should have a directory named Telegraf:
cd IEdgeInsights/Telegraf
Copy the IEdgeInsights/build/.env file using the following command in the current folder
cp ../build/.env .
NOTE: Update the HOST_IP and ETCD_HOST variables in the .env file with your system IP.
# Source the .env using the following command:
set -a && source .env && set +a
Independently build
docker-compose build
Steps to Independently Deploy the Telegraf Service
You can deploy the Telegraf service in any of the following two ways:
Deploy the Telegraf Service withoutthe Config Manager Agent Dependency
Run the following commands to deploy Telegraf service without Config Manager Agent dependency:
# Enter the Telegraf directory
cd IEdgeInsights/Telegraf
Copy the IEdgeInsights/build/.env file using the following command in the current folder, if not already present.
cp ../build/.env .Note: Ensure that
docker psis clean anddocker network lsdoesn’t have EII bridge network.
Update .env file for following:
1. HOST_IP and ETCD_HOST variables with your system IP.
2. `READ_CONFIG_FROM_FILE_ENV` value to `true` and `DEV_MODE` value to `true`.

Source the .env using the following command:
set -a && source .env && set +a
# Run the service
docker-compose -f docker-compose.yml -f docker-compose-dev.override.yml up -d
Note
Telegraf container restarts automatically when its config is modified in config.json file.
If user is updating the config.json file using vi or vim editor, it is required to append the set backupcopy=yes in ~/.vimrc so that the changes done on the host machine config.json gets reflected inside the container mount point.
Deploy The Telegraf Service with the Config Manager Agent Dependency
Run the following commands to deploy the Telegraf service with the Config Manager Agent dependency:
Note
Ensure that the Config Manager Agent image present in the system. If not, build the Config Manager Agent locally when independently deploying the service with Config Manager Agent dependency.
# Enter the Telegraf directory
cd IEdgeInsights/Telegraf
Copy the IEdgeInsights/build/.env file using the following command in the current folder, if not already present.
cp ../build/.env .
Note
Ensure that docker ps is clean and docker network ls does not have EII bridge network.
Update .env file for following:
1. HOST_IP and ETCD_HOST variables with your system IP.
2. `READ_CONFIG_FROM_FILE_ENV` value is set to `false`.
Copy the docker-compose.yml from IEdgeInsights/ConfigMgrAgent as docker-compose.override.yml in IEdgeInsights/Telegraf.
cp ../ConfigMgrAgent/docker-compose.yml docker-compose.override.yml
Copy the builder.py with standalone mode changes from IEdgeInsights/build directory
cp ../build/builder.py .Run the builder.py in standalone mode, this will generate eii_config.json and update docker-compose.override.yml
python3 builder.py -s trueBuilding the service (This step is optional for building the service if not already done in the
Independently buildablestep above)docker-compose buildFor running the service in PROD mode, run the below command:
NOTE: Make sure to update
DEV_MODEtofalsein .env while running in PROD mode and source the .env using the commandset -a && source .env && set +a.docker-compose up -dFor running the service in DEV mode, run the below command:
NOTE: Make sure to update
DEV_MODEtotruein .env while running in DEV mode and source the .env using the commandset -a && source .env && set +a.docker-compose -f docker-compose.yml -f docker-compose-dev.override.yml -f docker-compose.override.yml up -d
Telegraf’s Default Configuration
Telegraf starts with the default configuration which is present at config/Telegraf/Telegraf.conf(
[WORK_DIR]/IEdgeInsights/Telegraf/config/Telegraf/Telegraf.conf) (for the dev mode the name is ‘Telegraf_devmode.conf’). By default the below plugins are enabled:
MQTT input plugin ([[inputs.mqtt_consumer]])
EII message bus input plugin ([[inputs.eii_msgbus]])
Influxdb output plugin ([[outputs.influxdb]])
Telegraf will be started using script ‘telegraf_start.py. This script will get the configuration from ETCD first and then it will start the Telegraf service by picking the right configuration depending on the developer/production mode. By default, only a single instance of the Telegraf container runs (named ‘ia_telegraf’).
Volume Mounting of Telegraf Configuration Files
In the DEV mode (DEV_MODE=true in [WORK_DIR]/IEdgeInsights/build/.env), telegraf conf files are being volume mounted inside the Telegraf container image as can be seen in it’s docker-compose-dev.override.yml. This gives the flexibility for the developers to update the conf file on the host machine and see the changes being reflected in Telegraf, this can be done by just restarting the Telegraf container without the need to rebuilding the telegraf container image.
Note
If Telegraf is being run as Multi Telegraf, then make sure that the same file path is volume mounted. Ex: If volume mount Telegraf1 instance, the volume mount would look like:
volumes:
   - ./config/Telegraf1/:/etc/Telegraf/Telegraf1
MQTT Sample Configuration and the Testing Tool
To test with MQTT publisher in k8s helm environment, update ‘MQTT_BROKER_HOST’ Environment Variables in values.yaml(
[WORK_DIR]/IEdgeInsights/Telegraf/helm/values.yaml) with HOST IP address of the system where MQTT Broker is running.To test with remote MQTT broker in docker environment, update ‘MQTT_BROKER_HOST’ Environment Variables in docker-compose.yml(
[WORK_DIR]/IEdgeInsights/Telegraf/docker-compose.yml) with HOST IP address of the system where MQTT Broker is running.
ia_telegraf:
  environment:
    ...
    MQTT_BROKER_HOST: '<HOST IP address of the system where MQTT Broker is running>'
Telegraf instance can be configured with pressure point data ingestion. In the following example, the MQTT input plugin of Telegraf is configured to read pressure point data and stored into the ‘point_pressure_data’ measurement.
# # Read metrics from MQTT topic(s)
[[inputs.mqtt_consumer]]
#   ## MQTT broker URLs to be used. The format should be scheme://host:port,
#   ## schema can be tcp, ssl, or ws.
servers = ["tcp://localhost:1883"]
#
#   ## MQTT QoS, must be 0, 1, or 2
#   qos = 0
#   ## Connection timeout for initial connection in seconds
#   connection_timeout = "30s"
#
#   ## Topics to subscribe to
topics = [
"pressure/simulated/0",
]
name_override = "point_pressure_data"
data_format = "json"
#
#   # if true, messages that can't be delivered while the subscriber is offline
#   # will be delivered when it comes back (such as on service restart).
#   # NOTE: if true, client_id MUST be set
persistent_session = false
#   # If empty, a random client ID will be generated.
client_id = ""
#
#   ## username and password to connect MQTT server.
username = ""
password = ""
To start the MQTT-Publisher with pressure data,
cd ../tools/mqtt/publisher/
Change the command option in docker-compose.yml(
[WORK_DIR]/IEdgeInsights/tools/mqtt/publisher/docker-compose.yml) to:["--pressure", "10:30"]
Build and Run MQTT Publisher:
docker-compose up --build -d
Refer to the tools/mqtt/publisher/README.md
Enable Message Bus Input Plugin in Telegraf
The purpose of this enablement is to allow Telegraf to receive data from the message bus and store it into influxdb which is scalable.
Plugin Configuration
Configuration of the plugin is divided as follows:
ETCD configuration
Configuration in Telegraf.conf file config/Telegraf/Telegraf.conf(
[WORK_DIR]/IEdgeInsights/Telegraf/config/Telegraf/Telegraf.conf)
ETCD Configuration
As an EII message bus plugin and part of the EII framework, the message bus configuration and plugin’s topic specific configuration is kept in ETCD.
Following is the sample configuration:
{
    "config": {
        "influxdb": {
            "username": "admin",
            "password": "admin123",
            "dbname": "datain"
        },
        "default": {
            "topics_info": [
                "topic-pfx1:temperature:10:2",
                "topic-pfx2:pressure::",
                "topic-pfx3:humidity"
            ],
            "queue_len": 10,
            "num_worker": 2,
            "profiling": "false"
        }
    },
    "interfaces": {
        "Subscribers": [
            {
                "Name": "default",
                "Type": "zmq_tcp",
                "EndPoint": "ia_zmq_broker:60515",
                "Topics": [
                    "*"
                ],
                "PublisherAppName": "ZmqBroker"
            }
        ]
    }
}
Brief Description of the Configuration.
EII’s Telegraf has ‘config’ and ‘interfaces’ sections, where:
“interfaces” are the EII interface details. “config” are:
config:Contains the configuration of the influxdb (“influxdb”) and EII message bus input plugin (“default”). In the above sample configuration, the ” default” is an instance name. This instance name is referenced from the Telegraf’s configuration file config/Telegraf/Telegraf.conf(
[WORK_DIR]/IEdgeInsights/Telegraf/config/Telegraf/Telegraf.conf).topics_info:This is an array of topic prefix configuration, where the user specifies, how the data from the topic prefix should be processed. Following is the interpretation of topic information in every line:
“topic-pfx1:temperature:10:2”:Process data from the topic prefix ‘topic-pfx1’ asynchronously using the dedicated queue of length 10 and dedicated thread pool of size 2. And the processed data will be stored at a measurement named ‘temperature’ in influxdb.
“topic-pfx2:pressure::”:Process data from the topic prefix ‘topic-pfx2’ asynchronously using the global queue and global thread pool. And the processed data will be stored at a measurement named ‘pressure’ in influxdb.
“topic-pfx3:humidity” : Process data synchronously. And the processed data will be stored at a measurement named ‘humidity’ in influxdb.
Note: If topic specific configuration is not mentioned, then by default, data is processed synchronously and the measurement name would be the same as the topic name.
queue_len:Global queue length.
num_worker: Global thread pool size.
profiling: This is to enable the profiling mode of this plugin (value can be either “true” or “false”). In profiling mode, every point will get the following information and will be kept in the same measurement:
Total time spent in plugin (time in ns)
Time spent in queue (in case of asynchronous processing only and time in ns)
Time spend in JSON processing (time in ns)
The name of the thread pool and the thread id which processed the point.
Note
: The name of the global thread pool is “GLOBAL”. For a topic specific thread pool, the name is “for-$topic-name”.*
Configuration at Telegraf.conf File
The plugin instance name is an additional key, kept in the plugin configuration section. This key is used to fetch the configuration from ETCD. The following is the minimum sample configuration with a single plugin instance:
[[inputs.eii_msgbus]]
**instance_name = "default"**
data_format = "json"
json_strict = true
Here, the value default acts as a key in the file config. json([WORK_DIR]/IEdgeInsights/Telegraf/config.json). For this key, there is a configuration in the interfaces and config sections of the file config. json([WORK_DIR]/IEdgeInsights/Telegraf/config.json). So the value of instance_name acts as a connect/glue between the Telegraf configuration config/Telegraf/Telegraf.conf([WORK_DIR]/IEdgeInsights/Telegraf/config/Telegraf/Telegraf.conf) and the ETCD configuration config.json([WORK_DIR]/IEdgeInsights/Telegraf/config.json).
Note
: As it is a Telegraf input plugin, Telegraf’s parser configuration must be in Telegraf. conf file. More information on the telegraf JSON parser plugin can be found at https://github.com/influxdata/telegraf/tree/master/plugins/parsers/json. If there are multiple Telegraf instances, then the location of the Telegraf configuration files would be different. For more details, refer to the Optional: Adding multiple Telegraf instance section.
Advanced: Multiple Plugin Sections of EII Message Bus Input Plugin
Multiple configuration sections of the message bus input plugin is kept in the config/Telegraf/Telegraf.conf(``[WORK_DIR]/IEdgeInsights/Telegraf/config/Telegraf/Telegraf.conf``) file.
Following is an example:
Assume there are two EII apps, one with the AppName “EII_APP1” and another with the AppName “EII_APP2”, which are publishing the data to EII message bus.
The Telegraf’s ETCD configuration:
{
   "config":{
      "subscriber1":{
         "topics_info":[
            "topic-pfx1:temperature:10:2",
            "topic-pfx2:pressure::",
            "topic-pfx3:humidity"
         ],
         "queue_len":100,
         "num_worker":5,
         "profiling":"true"
      },
      "subscriber2":{
         "topics_info":[
            "topic-pfx21:temperature2:10:2",
            "topic-pfx22:pressure2::",
            "topic-pfx23:humidity2"
         ],
         "queue_len":100,
         "num_worker":10,
         "profiling":"true"
      }
   },
   "interfaces":{
      "Subscribers":[
         {
            "Name":"subscriber1",
            "EndPoint":"EII_APP1_container_name:5569",
            "Topics":[
               "*"
            ],
            "Type":"zmq_tcp",
            "PublisherAppName": "EII_APP1"
         },
         {
            "Name":"subscriber2",
            "EndPoint":"EII_APP2_container_name:5570",
            "Topics":[
               "topic-pfx21",
               "topic-pfx22",
               "topic-pfx23"
            ],
            "Type":"zmq_tcp",
            "PublisherAppName": "EII_APP2"
         }
      ]
   }
}
The Telegraf.conf configuration sections:
[[inputs.eii_msgbus]]
instance_name = "subscriber1"
data_format = "json"
json_strict = true

[[inputs.eii_msgbus]]
instance_name = "subscriber2"
data_format = "json"
json_strict = true
Using Input Plugins
By default, the message bus input plugin is disabled. To configure the EII input plugin, uncomment the following lines in config/Telegraf/Telegraf.conf(``[WORK_DIR]/IEdgeInsights/Telegraf/config/Telegraf/Telegraf.conf``) and config/Telegraf/Telegraf_devmode.conf(``[WORK_DIR]/IEdgeInsights/Telegraf/config/Telegraf/Telegraf_devmode.conf``)
```sh
[[inputs.eii_msgbus]]
instance_name = "default"
data_format = "json"
json_strict = true
tag_keys = [
  "my_tag_1",
  "my_tag_2"
]
json_string_fields = [
  "field1",
  "field2"
]
json_name_key = ""
```
Edit config.json(
[WORK_DIR]/IEdgeInsights/Telegraf/config.json) to add message bus input plugin.{ "config": { ... "default": { "topics_info": [ "topic-pfx1:temperature:10:2", "topic-pfx2:pressure::", "topic-pfx3:humidity" ], "queue_len": 10, "num_worker": 2, "profiling": "false" }, ... }, "interfaces": { "Subscribers": [ { "Name": "default", "Type": "zmq_tcp", "EndPoint": "ia_zmq_broker:60515", "Topics": [ "*" ], "PublisherAppName": "ZmqBroker" } ], ... } }
Enable Message Bus Output Plugin in Telegraf
Purpose
To receive the data from Telegraf Input Plugin and publish the data to EII msgbus.
Configuration of the Plugin
Configuration of the plugin is divided into two parts:
ETCD configuration
Configuration in Telegraf.conf file config/Telegraf/Telegraf.conf(
[WORK_DIR]/IEdgeInsights/Telegraf/config/Telegraf/Telegraf.conf)
ETCD configuration
As an EII message bus plugin and part of the EII framework, the message bus configuration and plugin’s topic specific configuration is kept in ETCD.
Following is the sample configuration:
{
    "config": {
        "publisher": {
            "measurements": ["*"],
            "profiling": "false"
        }
    },
    "interfaces": {
        "Publishers": [
            {
                "Name": "publisher",
                "Type": "zmq_tcp",
                "EndPoint": "0.0.0.0:65077",
                "Topics": [
                    "*"
                ],
                "AllowedClients": [
                    "*"
                ]
            }
        ]
    }
}
Brief Description of the Configuration
EII’s Telegraf has ‘config’ and ‘interfaces’ sections, where:
“interfaces” are the EII interface details. “config” are:
config:Contains EII message bus output plugin (“publisher”). In the above sample configuration, the “publisher” is an instance name. This instance name is referenced from the Telegraf’s configuration file config/Telegraf/Telegraf.conf(
[WORK_DIR]/IEdgeInsights/Telegraf/config/Telegraf/Telegraf.conf)measurements:This is an array of measurements configuration, where user specifies, which measurement data should be published in message bus.
profiling:This is to enable the profiling mode of this plugin (value can be either “true” or “false”).
Configuration in Telegraf.conf File
The plugin instance name is an additional key, kept in the plugin configuration section. This key is used to fetch the configuration from ETCD. Following is the minimum, sample configuration with a single plugin instance:
[[outputs.eii_msgbus]]
instance_name = "publisher"
Here, the value ‘publisher’ acts as a key in the file config.json(``[WORK_DIR]/IEdgeInsights/Telegraf/config.json``). The configuration in the ‘interfaces’ and ‘config’ sections of the file config.json(``[WORK_DIR]/IEdgeInsights/Telegraf/config.json``) has this key. Here the value of ‘instance_name’ acts as a connect/glue between the Telegraf configuration config/Telegraf/Telegraf.conf(``[WORK_DIR]/IEdgeInsights/Telegraf/config/Telegraf/Telegraf.conf``) and the ETCD configuration config.json(``[WORK_DIR]/IEdgeInsights/Telegraf/config.json``)
Advanced: Multiple Plugin Sections of Message Bus Output Plugin
Multiple configuration sections of the message bus output plugin is kept in the config/Telegraf/Telegraf.conf(``[WORK_DIR]/IEdgeInsights/Telegraf/config/Telegraf/Telegraf.conf``) file.
The Telegraf’s ETCD configuration:
{
    "config": {
        "publisher1": {
            "measurements": ["*"],
            "profiling": "false"
        },
        "publisher2": {
            "measurements": ["*"],
            "profiling": "false"
        }
    },
    "interfaces": {
        "Publishers": [
            {
                "Name": "publisher1",
                "Type": "zmq_tcp",
                "EndPoint": "0.0.0.0:65077",
                "Topics": [
                    "*"
                ],
                "AllowedClients": [
                    "*"
                ]
            },
            {
                "Name": "publisher2",
                "Type": "zmq_tcp",
                "EndPoint": "0.0.0.0:65078",
                "Topics": [
                    "*"
                ],
                "AllowedClients": [
                    "*"
                ]
            }
        ]
    }
}
The Telegraf.conf configuration:
[[outputs.eii_msgbus]]
instance_name = "publisher1"

[[outputs.eii_msgbus]]
instance_name = "publisher2"
Run Telegraf Input Output Plugin in IPC Mode
Modify the interfaces section of config.json(``[WORK_DIR]/IEdgeInsights/Telegraf/config.json``) to run in IPC mode:
"interfaces": {
    "Subscribers": [
        {
            "Name": "default",
            "Type": "zmq_ipc",
            "EndPoint": {
              "SocketDir": "/EII/sockets",
              "SocketFile": "backend-socket"
            },

            "Topics": [
                "*"
            ],
            "PublisherAppName": "ZmqBroker"
        }
    ],
    "Publishers": [
        {
            "Name": "publisher",
            "Type": "zmq_ipc",
            "EndPoint": {
              "SocketDir": "/EII/sockets",
              "SocketFile": "telegraf-out"
            },
            "Topics": [
                "*"
            ],
            "AllowedClients": [
                "*"
            ]
        }
    ]
}
To Add Multiple Telegraf Instances (Optional)
Users can add multiple instances of Telegarf. To do this, user needs to add environment variable named ‘ConfigInstance’ in the docker-compose.yml file. For every additional telegraf instance, there must be an additional compose section in the docker-compose.yml file.
The configuration for every instance must be in the telegraf image. Following are the standard instances:
For instance named $ConfigInstance the telegraf configuration has to be kept in the repository at config(
[WORK_DIR]/IEdgeInsights/Telegraf/config)/$ConfigInstance/$ConfigInstance.conf (for production mode) and config([WORK_DIR]/IEdgeInsights/Telegraf/config)/$ConfigInstance/$ConfigInstance_devmode.conf (for developer mode).The same files will be available inside the respective container at ‘/etc/Telegraf/$ConfigInstance/$ConfigInstance.conf’ (for production mode) ‘/etc/Telegraf/$ConfigInstance/$ConfigInstance_devmode.conf’ (for developer mode)
Following are some examples:
Example: For $ConfigInstance = ‘Telegraf1’
The location of the Telegraf configuration is config(
[WORK_DIR]/IEdgeInsights/Telegraf/config)/Telegraf1/Telegraf1.conf (for production mode) and config([WORK_DIR]/IEdgeInsights/Telegraf/config)/Telegraf1/Telegraf1_devmode.conf (for developer mode) -The additional docker compose section, which is manually added in the file ‘docker-compose.yml’ is:
ia_telegraf1:
  build:
    context: $PWD
    dockerfile: $PWD/Dockerfile
    args:
      EII_VERSION: ${EII_VERSION}
      EII_UID: ${EII_UID}
      EII_USER_NAME: ${EII_USER_NAME}
      TELEGRAF_SOURCE_TAG: ${TELEGRAF_SOURCE_TAG}
      TELEGRAF_GO_VERSION: ${TELEGRAF_GO_VERSION}
      UBUNTU_IMAGE_VERSION: ${UBUNTU_IMAGE_VERSION}
      CMAKE_INSTALL_PREFIX: ${EII_INSTALL_PATH}
      PYTHON_VERSION: ${PYTHON_VERSION}
      GO_VERSION: ${GO_VERSION}
      no_proxy: ${eii_no_proxy}
      PKG_SRC: ${PKG_SRC}
      GO_PKG_SRC: ${PKG_SRC}
      PYPI_SRC: ${PKG_SRC}
      MSGBUS_WHL: ${MSGBUS_WHL}
      CFGMGR_WHL: ${CFGMGR_WHL}
  container_name: ia_telegraf1
  hostname: ia_telegraf1
  image: ${DOCKER_REGISTRY}edgeinsights/ia_telegraf:${EII_VERSION}
  restart: unless-stopped
  ipc: "none"
  security_opt:
  - no-new-privileges
  read_only: true
  healthcheck:
    test: ["CMD-SHELL", "exit", "0"]
    interval: 5m
  environment:
    AppName: "Telegraf"
    DEV_MODE: ${DEV_MODE}
    no_proxy: "${ETCD_HOST},ia_datastore, ia_mqtt_broker"
    NO_PROXY: "${ETCD_HOST},ia_datastore,ia_mqtt_broker"
    ETCD_HOST: ${ETCD_HOST}
    ETCD_CLIENT_PORT: ${ETCD_CLIENT_PORT}
    MQTT_BROKER_HOST: "ia_mqtt_broker"
    INFLUX_SERVER: ia_datastore
    INFLUXDB_PORT: $INFLUXDB_PORT
    ETCD_PREFIX: ${ETCD_PREFIX}
    INFLUXDB_USERNAME: ${INFLUXDB_USERNAME}
    INFLUXDB_PASSWORD: ${INFLUXDB_PASSWORD}
    # READ_CONFIG_FROM_FILE_ENV is  set to true if config wants to be read from file, By default its false.
    READ_CONFIG_FROM_FILE_ENV: ${READ_CONFIG_FROM_FILE_ENV}
  ports:
    - 65078:65078
  networks:
    - eii
  volumes:
    - "vol_temp_telegraf:/tmp/"
    - "${EII_INSTALL_PATH}/sockets:${SOCKET_DIR}"
    - ./Certificates/Telegraf:/run/secrets/Telegraf:ro
Note
: If user wants to add Telegraf output plugin in Telegraf instance, modify config.json([WORK_DIR]/IEdgeInsights/Telegraf/config.json), docker-compose.yml([WORK_DIR]/IEdgeInsights/Telegraf/docker-compose.yml) and Telegraf configuration(.conf) files.
Add publisher configuration in config.json(
[WORK_DIR]/IEdgeInsights/Telegraf/config.json):
{
    "config": {

        ...,
        "<output plugin instance_name>": {
            "measurements": ["*"],
            "profiling": "true"
        }
    },
    "interfaces": {
        ...,
        "Publishers": [
            ...,
            {
                "Name": "<output plugin instance_name>",
                "Type": "zmq_tcp",
                "EndPoint": "0.0.0.0:<publisher port>",
                "Topics": [
                    "*"
                ],
                "AllowedClients": [
                    "*"
                ]
            }

        ]
    }
}
Example:
{
    "config": {

        ...,
        "publisher1": {
            "measurements": ["*"],
            "profiling": "true"
        }
    },
    "interfaces": {
        ...,
        "Publishers": [
            ...,
            {
                "Name": "publisher1",
                "Type": "zmq_tcp",
                "EndPoint": "0.0.0.0:65078",
                "Topics": [
                    "*"
                ],
                "AllowedClients": [
                    "*"
                ]
            }

        ]
    }
}
Expose “publisher port” in docker-compose.yml(
[WORK_DIR]/IEdgeInsights/Telegraf/docker-compose.yml) file:ia_telegraf<ConfigInstance number>: ... ports: - <publisher port>:<publisher port>
Example:
ia_telegraf<ConfigInstance number>:
  ...
  ports:
    - 65078:65078
Add eii_msgbus output plugin in Telegraf instance configuration file config(
[WORK_DIR]/IEdgeInsights/Telegraf/config)/$ConfigInstance/$ConfigInstance.conf (for production mode) and config([WORK_DIR]/IEdgeInsights/Telegraf/config)/$ConfigInstance/$ConfigInstance_devmode.conf (for developer mode).[[outputs.eii_msgbus]] instance_name = “
“
Example:
For $ConfigInstance = ‘Telegraf1’
User needs to add the following section in config(
[WORK_DIR]/IEdgeInsights/Telegraf/config)/Telegraf1/Telegraf1.conf (for production mode) and config([WORK_DIR]/IEdgeInsights/Telegraf/config)/Telegraf1/Telegraf1_devmode.conf (for developer mode):[[outputs.eii_msgbus]] instance_name = “publisher1”
To allow the changes to the docker file to take place, run the builder.py script command.
cd [WORK_DIR]/IEdgeInsights/build
python3 builder.py
Following are the commands to provision, build and bring up all the containers:
cd [WORK_DIR]/IEdgeInsights/build/
docker-compose build
docker-compose up -d
Based on the previous example, the user can check that the Telegraf service will have multiple containers using the docker ps command.
Note: The additional configuration is kept in Telegraf/config/$ConfigInstance/telegraf.d in a modular way. For example, create a directory telegraf.d in Telegraf/config/config/$ConfigInstance.
mkdir config/$ConfigInstance/telegraf.d
cd config/$ConfigInstance/telegraf.d
Additional configuration files are kept inside the directory and the following command is used to start the Telegraf in the docker-compose.yml file:
command: ["telegraf -config=/etc/Telegraf/$ConfigInstance/$ConfigInstance.conf -config-directory=/etc/Telegraf/$ConfigInstance/telegraf.d"]
Overview of the Kapacitor
Introduction to the Point-Data Analytics(Time Series Data)
Any integral value that gets generated over time is point data. For examples:
Temperature at a different time in a day.
Number of oil barrels processed per minute.
By doing the analytics over point data, the factory can have an anomaly detection mechanism where PointDataAnalytics is considered.
IEdgeInsights uses the TICK stack to do point data analytics.
It has temperature anomaly detection, an example for demonstrating the time-series data analytics flow.
The high-level flow of the data is:
MQTT-temp-sensor–>Telegraf–>Influx–>Kapacitor–>Influx.
MQTT-temp-sensor simulator sends the data to the Telegraf. Telegraf sends the same data to Influx and Influx sends it to Kapacitor. Kapacitor does anomaly detection and publishes the results back to Influx.
Here, Telegraf is the TICK stack component and supports the number of input plug-ins for data ingestion. Influx is a time-series database. Kapacitor is an analytics engine where users can write custom analytics plug-ins (TICK scripts).
Starting the Example
To start the mqtt-temp-sensor, refer to tools/mqtt-publisher/README.md.
Starting the EII.
To start the EII in production mode, provisioning must be done. Following are the commands to be executed after provisioning:
cd build
docker-compose build
docker-compose up -d
To start the EII in developer mode, refer to README.
To verify the output, check the output of the following commands:
docker logs -f ia_influxdb
Following is the snapshot of sample output of the ia_influxdb command.
I0822 09:03:01.705940       1 pubManager.go:111] Published message: map[data:point_classifier_results,host=ia_telegraf,topic=temperature/simulated/0 temperature=19.29358085726703,ts=1566464581.6201317 1566464581621377117]
I0822 09:03:01.927094       1 pubManager.go:111] Published message: map[data:point_classifier_results,host=ia_telegraf,topic=temperature/simulated/0 temperature=19.29358085726703,ts=1566464581.6201317 1566464581621377117]
I0822 09:03:02.704000       1 pubManager.go:111] Published message: map[data:point_data,host=ia_telegraf,topic=temperature/simulated/0 ts=1566464582.6218634,temperature=27.353740759929877 1566464582622771952]
Purpose of the Telegraf
Telegraf is a data entry point for IEdgeInsights. It supports many input plugins, which is used for point data ingestion. In the previous example, the MQ Telemetry Transport (MQTT) input plugin of Telegraf is used. Following are the configurations of the plugins:
# # Read metrics from MQTT topic(s)
[[inputs.mqtt_consumer]]
#   ## MQTT broker URLs to be used. The format should be scheme://host:port,
#   ## schema can be tcp, ssl, or ws.
    servers = ["tcp://localhost:1883"]
#
#   ## MQTT QoS, must be 0, 1, or 2
#   qos = 0
#   ## Connection timeout for initial connection in seconds
#   connection_timeout = "30s"
#
#   ## Topics to subscribe to
    topics = [
    "temperature/simulated/0",
    ]
    name_override = "point_data"
    data_format = "json"
#
#   # if true, messages that can't be delivered while the subscriber is offline
#   # will be delivered when it comes back (such as on service restart).
#   # NOTE: If true, client_id MUST be set
    persistent_session = false
#   # If empty, a random client ID will be generated.
    client_id = ""
#
#   ## username and password to connect MQTT server.
    username = ""
    password = ""
In the production mode, the Telegraf configuration file is
Telegraf/config/telegraf.conf([WORK_DIR]/IEdgeInsights/Telegraf/config/Telegraf/Telegraf.conf) and in developer mode,
the Telegraf configuration file is
Telegraf/config/telegraf_devmode.conf([WORK_DIR]/IEdgeInsights/Telegraf/config/Telegraf/Telegraf_devmode.conf).
For more information on the supported input and output plugins refer to https://docs.influxdata.com/telegraf/v1.10/plugins/
Purpose of the Kapacitor
About Kapacitor and UDF
You can write the custom anomaly detection algorithm in PYTHON/GOLANG. And these algorithms are called as UDF (user-defined function). These algorithms follow certain API standards for the Kapacitor to call these UDFs at run time.
IEdgeInsights has the sample UDF (user-defined function) written in GOLANG. Kapacitor is subscribed to the InfluxDB, and gets the temperature data. After fetching this data, Kapacitor calls the UDF, which detects the anomaly in the temperature and sends back the results to Influx.
The sample Go UDF is at go_classifier.go(
[WORK_DIR]/IEdgeInsights/Kapacitor/udfs/go_classifier.go) and the TICKscript is at go_point_classifier.tick([WORK_DIR]/IEdgeInsights/Kapacitor/tick_scripts/go_point_classifier.tick)The sample Python UDF is at py_classifier.py(
[WORK_DIR]/IEdgeInsights/Kapacitor/udfs/py_classifier.py) and the TICKscript is at py_point_classifier.tick([WORK_DIR]/IEdgeInsights/Kapacitor/tick_scripts/py_point_classifier.tick)For more details, on Kapacitor and UDF, refer to the following links:
Writing a sample UDF at anomaly detection
UDF and kapacitor interaction socket_udf
In production mode, the Kapacitor configuration file is Kapacitor/config/kapacitor.conf(
[WORK_DIR]/IEdgeInsights/Kapacitor/config/kapacitor.conf) and in developer mode, the Kapacitor configuration file is Kapacitor/config/kapacitor_devmode.conf([WORK_DIR]/IEdgeInsights/Kapacitor/config/kapacitor_devmode.conf).
Custom UDFs available in the UDF([WORK_DIR]/IEdgeInsights/Kapacitor/udfs) Directory
UNIX Socket based UDFs
go_classifier.go:Filters the points based on temperature (data >20 and <25 filtered out).
py_classifier.py:Filters the points based on temperature (data >20 and <25 filtered out).
profiling_udf.go:Add the profiling (time taken to process the data) data in the points.
temperature_classifier.go:Filter the points based on temperature (data <25 filtered out).
humidity_classifier.py:Filter the points based on humidity (data <25 filtered out).
Process based UDFs
rfc_classifier.py:Random Forest Classification algo sample. This UDF is used for profiling udf as well.
Steps to Configure the UDFs in the Kapacitor
Keep the custom UDFs in the udfs(
[WORK_DIR]/IEdgeInsights/Kapacitor/udfs) directory and the TICKscript in the tick_scripts([WORK_DIR]/IEdgeInsights/Kapacitor/tick_scripts) directory.Keep the training data set (if any) required for the custom UDFs in the training_data_sets(
[WORK_DIR]/IEdgeInsights/Kapacitor/training_data_sets) directory.For python UDFs, any external python package dependency needs to be installed. To install the python package using pip, it can be added in the requirements.txt(
[WORK_DIR]/IEdgeInsights/Kapacitor/requirements.txt) file and to install the python package using conda, it can be added in the conda_requirements.txt([WORK_DIR]/IEdgeInsights/Kapacitor/conda_requirements.txt) file.Modify the UDF section in the kapacitor.conf(
[WORK_DIR]/IEdgeInsights/Kapacitor/config/kapacitor.conf) and in the kapacitor_devmode.conf([WORK_DIR]/IEdgeInsights/Kapacitor/config/kapacitor_devmode.conf). Mention the custom UDF in the configuration, for example:[udf.functions.customUDF] socket = "/tmp/socket_file" timeout = "20s"
For go or python based UDF, update the values of keys named “type”, “name”, “tick_script”, “task_name”, in the config.json(
[WORK_DIR]/IEdgeInsights/Kapacitor/config.json)file, for example:"task": [{ "tick_script": "py_point_classifier.tick", "task_name": "py_point_classifier", "udfs": [{ "type": "python", "name": "py_classifier" }] }]
For TICKscript only UDF, update the values of keys named “tick_script”, “task_name”, in the config.json(
[WORK_DIR]/IEdgeInsights/Kapacitor/config.json)file, for example:"task": [{ "tick_script": "simple_logging.tick", "task_name": "simple_logging" }]
Note:
By default, go_classifier and rfc_classifier is configured.
Mention the TICKscript UDF function same as configured in the Kapacitor configuration file. For example, UDF Node in the TICKscript:
@py_point_classifier()should be same as
[udf.functions.py_point_classifier]
   socket = "/tmp/socket_file"
   timeout = "20s"
go or python based UDF should listen on the same socket file as mentioned in the the UDF section in the kapacitor.conf(
[WORK_DIR]/IEdgeInsights/Kapacitor/config/kapacitor.conf) and in the kapacitor_devmode.conf([WORK_DIR]/IEdgeInsights/Kapacitor/config/kapacitor_devmode.conf). For example:[udf.functions.customUDF] socket = "/tmp/socket_file" timeout = "20s"
For a process based UDFs, provide the correct path of the code within the container in the kapacitor.conf(
[WORK_DIR]/IEdgeInsights/Kapacitor/config/kapacitor.conf) and in the kapacitor_devmode.conf([WORK_DIR]/IEdgeInsights/Kapacitor/config/kapacitor_devmode.conf). By default, the files and directories will be copied into the container under the “/OpenEII” directory. It is recommended to keep the custom UDFs in the udfs([WORK_DIR]/IEdgeInsights/Kapacitor/udfs) directory, the path of the custom UDF will be “/OpenEII/udfs/customUDF_name” as shown in below example. If the UDF is kept in different path, modify the path in the args accordingly.The PYTHONPATH of the Kapacitor agent directory is “/OpenEII/go/src/github.com/influxdata/kapacitor/udf/agent/py/”. Following example shows how to pass:
[udf.functions.customUDF]
   prog = "python3.7"
   args = ["-u", "/EII/udfs/customUDF"]
   timeout = "60s"
   [udf.functions.customUDF.env]
      PYTHONPATH = "/go/src/github.com/influxdata/kapacitor/udf/agent/py/"
Perform the provisioning and run the EII stack.
Steps to Run the Samples of Multiple UDFs in a Single Task and Multiple Tasks using Single UDF
Refer to the samples/README
Kapacitor Input and Output Plugins
Purpose of Plugins
The plugins allow Kapacitor to interact directly with EII Message Bus. They use message bus publisher or subscriber interface. Using these plugins Kapacitor receives data from various EII publishers and sends data to various EII subscribers. Hence, it’s possible to have a time-series use case without InfluxDB and Kapacitor as independent analytical engine.
A simple use case flow is as follows:
MQTT-temp-sensor–>Telegraf–>Kapacitor–>TimeseriesProfiler
Using Input Plugin
Following are the steps using input Plugins:
Configure the EII input plugin in config/kapacitor.conf(
[WORK_DIR]/IEdgeInsights/Kapacitor/config/kapacitor.conf) and config/kapacitor_devmode.conf([WORK_DIR]/IEdgeInsights/Kapacitor/config/kapacitor_devmode.conf)
For example:
[eii]
  enabled = true
Edit config.json(
[WORK_DIR]/IEdgeInsights/Kapacitor/config.json) to add a subscriber under interfaces.
For example, to receive data published by Telegraf:
TCP mode
       "Subscribers": [
           {
               "Name": "telegraf_sub",
               "Type": "zmq_tcp",
               "EndPoint": "ia_telegraf:65077",
               "PublisherAppName": "Telegraf",
               "Topics": [
                   "*"
               ]
           }
       ]

**IPC mode**
"Subscribers": [
    {
        "Name": "telegraf_sub",
        "Type": "zmq_ipc",
        "EndPoint": {
            "SocketDir": "/EII/sockets",
            "SocketFile": "telegraf-out"
        },
        "PublisherAppName": "Telegraf",
        "Topics": [
            "*"
        ]
    }
]
Note
For IPC mode, we need to specify the ‘EndPoint’ as a dict of ‘SocketDir’ and ‘SocketFile’, where ‘Topics’ is [*] (as in the previous example). For a single topic the ‘EndPoint’ is [**] (as in the example of Kapacitor output plugin).
    "EndPoint": "/EII/sockets"

The received data is available in the 'EII' storage for the TICKscript.
Create or modify a TICKscript to process the data and configure the same in config.json(
[WORK_DIR]/IEdgeInsights/Kapacitor/config.json). For example, use the stock tick_scripts/eii_input_plugin_logging.tick([WORK_DIR]/IEdgeInsights/Kapacitor/tick_scripts/eii_input_plugin_logging.tick) which logs the data received from ‘EII’ storage onto the kapacitor log file (residing in the container at /mp/log/kapacitor/kapacitor.log)."task": [ { "tick_script": "eii_input_plugin_logging.tick", "task_name": "eii_input_plugin_logging" } ]
Perform the provisioning and run the EII stack.
The subscribed data is available in the previous log file, which is seen by executing the following command:
docker exec ia_kapacitor tail -f /tmp/log/kapacitor/kapacitor.log
Using Output Plugin
Following are the steps using output Plugins:
Create or modify a TICKscript to use ‘eiiOut’ node to send the data using publisher interface. Following is an example to modify the profiling UDF:
dbrp "eii"."autogen"

var data0 = stream
   |from()
           .database('eii')
           .retentionPolicy('autogen')
           .measurement('point_data')
   @profiling_udf()
   |eiiOut()
           .pubname('sample_publisher')
           .topic('sample_topic')
Add a publisher interface to config.json(
[WORK_DIR]/IEdgeInsights/Kapacitor/config.json) with the same publisher name and topic that is ‘sample_publisher’ and ‘sample_topic’ respectively as seen in the previously example.
For example:
TCP mode
       "Publishers": [
           {
               "Name": "sample_publisher",
               "Type": "zmq_tcp",
               "EndPoint": "0.0.0.0:65034",
               "Topics": [
                   "sample_topic"
               ],
               "AllowedClients": [
                   "TimeSeriesProfiler"
               ]
           }
       ]

**IPC mode**
"Publishers": [
    {
        "Name": "sample_publisher",
        "Type": "zmq_ipc",
        "EndPoint": "/EII/sockets",
        "Topics": [
            "sample_topic"
        ],
        "AllowedClients": [
            "TimeSeriesProfiler"
        ]
    }
]
Perform provisioning service and run the EII stack.
Using Input or Output Plugin with RFC UDF
Following are the steps using input or output Plugins with RFC UDF:
Add the RFC task to config.json(
[WORK_DIR]/IEdgeInsights/Kapacitor/config.json):"task": [ { "tick_script": "rfc_task.tick", "task_name": "random_forest_sample", "udfs": [{ "type": "python", "name": "rfc_classifier" }] } ]
Modify the rfc_task.tick(
[WORK_DIR]/IEdgeInsights/Kapacitor/tick_scripts/rfc_task.tick) as seen in the following example:dbrp "eii"."autogen" var data0 = stream |from() .database('eii') .retentionPolicy('autogen') .measurement('ts_data') |window() .period(3s) .every(4s) data0 @rfc() |eiiOut() .pubname('sample_publisher') .topic('sample_topic')
Modify the Kapacitor conf files Kapacitor/config/kapacitor.conf(
[WORK_DIR]/IEdgeInsights/Kapacitor/config/kapacitor.conf) and Kapacitor/config/kapacitor_devmode.conf([WORK_DIR]/IEdgeInsights/Kapacitor/config/kapacitor_devmode.conf) UDF section to remove Go classifier UDF related configurations since this conflicts with the existing python RFC UDF configuration:# Configuration for UDFs (User Defined Functions) [udf.functions] # [udf.functions.go_point_classifier] # socket = "/tmp/point_classifier" # timeout = "20s"
Add a publisher interface to config.json(
[WORK_DIR]/IEdgeInsights/Kapacitor/config.json) with the same publisher name and topic that is ‘sample_publisher’ and ‘sample_topic’ respectively as in the previous example.For example:
TCP mode
"Publishers": [
    {
        "Name": "sample_publisher",
        "Type": "zmq_tcp",
        "EndPoint": "0.0.0.0:65034",
        "Topics": [
            "sample_topic"
        ],
        "AllowedClients": [
            "TimeSeriesProfiler",
            "EmbSubscriber",
            "GoSubscriber"
        ]
    }
]
IPC mode
"Publishers": [
    {
        "Name": "sample_publisher",
        "Type": "zmq_ipc",
        "EndPoint": "/EII/sockets",
        "Topics": [
            "sample_topic"
        ],
        "AllowedClients": [
            "TimeSeriesProfiler",
            "EmbSubscriber",
            "GoSubscriber"
        ]
    }
]
Perform provisioning service, build and run the EII stack.
Steps to Independently Build and Deploy the Kapacitor Service
Note
For running 2 or more microservices, we recommend that users try the use case-driven approach for building and deploying as mentioned in Generate Consolidated Files for a Subset of Edge Insights for Industrial Services
Steps to Independently Build the Kapacitor Service
Note
When switching between independent deployment of the service with and without the configuration manager agent service dependency, one would run into issues with the docker-compose build w.r.t the Certificates folder existence. As a workaround, run the command sudo rm -rf Certificates to proceed with docker-compose build.
To independently build the Kapacitor service, complete the following steps:
The downloaded source code should have a directory named Kapacitor:
cd IEdgeInsights/Kapacitor
Copy the IEdgeInsights/build/.env file using the following command in the current folder
cp ../build/.env .
NOTE: Update the HOST_IP and ETCD_HOST variables in the .env file with your system IP.
# Source the .env using the following command:
set -a && source .env && set +a
Independently build
docker-compose build
Steps to Independently Deploy the Kapacitor Service
You can deploy the Kapacitor service in any of the following two ways:
Deploy the Kapacitor Service without the Config Manager Agent Dependency
Run the following commands to deploy the Kapacitor service without Configuration Manager Agent dependency:
# Enter the Kapacitor directory
cd IEdgeInsights/Kapacitor
Copy the IEdgeInsights/build/.env file using the following command in the current folder, if not already present.
cp ../build/.env .Note: Ensure that
docker psis clean anddocker network lsmust not have EII bridge network.
Update .env file for the following:
1. HOST_IP and ETCD_HOST variables with your system IP.
2. `READ_CONFIG_FROM_FILE_ENV` value to `true` and `DEV_MODE` value to `true`.

Source the .env using the following command:
set -a && source .env && set +a
# Run the service
docker-compose -f docker-compose.yml -f docker-compose-dev.override.yml up -d
Note
Kapacitor container restarts automatically when its config is modified in config.json file.
If user is updating the config.json file using vi or vim editor, it is required to append the set backupcopy=yes in ~/.vimrc so that the changes done on the host machine config.json gets reflected inside the container mount point.
Deploy the Kapacitor Service with the Config Manager Agent Dependency
Run the following commands to deploy the Kapacitor service with the Config Manager Agent dependency:
Note
Ensure that the Config Manager Agent image present in the system. If not, build the Config Manager Agent locally when independently deploying the service with Config Manager Agent dependency.
# Enter the Kapacitor directory
cd IEdgeInsights/Kapacitor
Copy the IEdgeInsights/build/.env file using the following command in the current folder, if not already present.
cp ../build/.env .Note: Ensure that
docker psis clean anddocker network lsdoesn’t have EII bridge networks.
Update .env file for following:
1. HOST_IP and ETCD_HOST variables with your system IP.
2. `READ_CONFIG_FROM_FILE_ENV` value is set to `false`.
Copy the docker-compose.yml from IEdgeInsights/ConfigMgrAgent as docker-compose.override.yml in IEdgeInsights/Kapacitor.
cp ../ConfigMgrAgent/docker-compose.yml docker-compose.override.yml
Copy the builder.py with standalone mode changes from IEdgeInsights/build directory
cp ../build/builder.pyRun the builder.py in standalone mode, this will generate eii_config.json and update docker-compose.override.yml
python3 builder.py -s trueBuilding the service (This step is optional for building the service if not already done in the
Independently buildablestep above)docker-compose buildFor running the service in PROD mode, run the below command:
NOTE: Make sure to update
DEV_MODEtofalsein .env while running in PROD mode and source the .env using the commandset -a && source .env && set +a.docker-compose up -dFor running the service in DEV mode, run the below command:
NOTE: Make sure to update
DEV_MODEtotruein .env while running in DEV mode and source the .env using the commandset -a && source .env && set +a.docker-compose -f docker-compose.yml -f docker-compose-dev.override.yml -f docker-compose.override.yml up -d
Troubleshooting
If Kapacitor build fails with the ‘broken pipe’ related errors then add the following line to the conda_requirements.txt([WORK_DIR]/IEdgeInsights/Kapacitor/conda_requirements.txt) and retry the build:
scikit-learn==1.0.0
Time Series Python UDFs Development
In the DEV mode (DEV_MODE=true in [WORK_DIR]/IEdgeInsights/build/.env), the Python UDFs are being volume mounted inside the Kapacitor container image that is seen in it’s docker-compose-dev.override.yml. This gives the flexibility for the developers to update their UDFs on the host machine and see the changes being reflected in Kapacitor. This is done by just restarting the Kapactior container without the need to rebuild the Kapacitor container image.
DataStore
For more details see the DataStore Microservice section.
Edge-to-Cloud Bridge for Microsoft Azure Overview
Note
For the various scripts and commands mentioned in this document to work, place the source code for this project in the
IEdgeInsightsdirectory in the source code for EII.
The Edge-to-Cloud Bridge for Microsoft Azure* service serves as a connector between EII and the Microsoft Azure IoT Edge Runtime ecosystem. It does this by allowing the following forms of bridging:
Publishing of incoming data from EII onto the Azure IoT Edge Runtime bus
Storage of incoming images from the EII video analytics pipeline into a local instance of the Azure Blob Storage service
Translation of configuration for EII from the Azure IoT Hub digital twin for the bridge into ETCD via the EII Configuration Manager APIs
This code base is structured as an Azure IoT Edge Runtime module. It includes the following:
Deployment templates for deploying the EII video analytics pipeline with the bridge on top of the Azure IoT Edge Runtime
The Edge-to-Cloud Bridge for Microsoft Azure* service module
A simple subscriber on top of the Azure IoT Edge Runtime for showcasing the end-to-end transmission of data
Various utilities and helper scripts for deploying and developing on the Edge-to-Cloud Bridge for Microsoft Azure* service
The following sections will cover the configuration/usage of the Edge-to-Cloud Bridge for Microsoft Azure* service, the deployment of EII on the Azure IoT Edge Runtime, as well as the usage of the tools and scripts included in this code base for development.
Note
The following sections assume an understanding of the configuration for EII. It is recommended that you read the main README and User Guide for EII prior to using this service.
Prerequisites and Setup
To use and develop with the Edge-to-Cloud Bridge for Microsoft Azure* service there are a few steps which must be taken to configure your environment. The setup must be done to configure your Azure Cloud account, your development system, and also the node which you are going to deploy the Edge-to-Cloud Bridge for Microsoft Azure* service on.
The following sections cover the setup for the first two environments listed. Setting up your system for a single-node deployment will be covered in the following Single-Node Azure IoT Edge Deployment section.
Note
When you deploy with Azure IoT Hub you will also need to configure the Azure IoT Edge Runtime and EII on your target device.
Azure Cloud Setup
Prior to using the Edge-to-Cloud Bridge for Microsoft Azure* service there are a few cloud services in Azure which must be initialized.
Primarily, you need an Azure Container Registry instance, an Azure IoT Hub, as well as an Azure IoT Device. Additionally, if you wish to use the sample ONNX UDF in EII to download a ML/DL model from AzureML, then you must follow a few steps to get this configured as well. For these steps, refer to following Setting up AzureML
To create these instances, follow the guides provided by Microsoft:
Note
In the quickstart guides, it is recommended that you create an Azure Resource Group. This is a good practice as it makes for easy clean up of your Azure cloud environment.
IMPORTANT: In the previous tutorials, you will receive credentials/connection strings for your Azure Container Registry, Azure IoT Hub, and Azure IoT Device. Save these for later, as they will be important for setting up your development and single node deployment showcased in this README.
All of the tutorials provided above provide options for creating these instances via Visual Studio Code, the Azure Portal, or the Azure CLI. If you wish to use the Azure CLI, it is recommended that you follow the Development System Setup instructions.
Setting up AzureML
To use the sample EII ONNX UDF, you must do the following:
Important
During the setup process provided for step 2 above, you will run a command similar to the following:
az ad sp create-for-rbac --sdk-auth --name ml-auth
After executing this command you will see a JSON blob printed to your console
window. Save the clientId, clientSecret, subscriptionId, and tenantId
for configuring the sample ONNX EII UDF later.
Pushing a Model to AzureML
If you already have an ONNX model you wish to push to your AzureML Workspace, then follow these instructions to push your model.
If you do not have a model, and want an easy model to use, follow this notebook provided my Microsoft to train a simple model to push to your AzureML Workspace.
Also, you can find pre-trained models in the ONNX Model Zoo.
Development System Setup
Note
: It is recommended to have this development setup done on a system connected with open network as it is been observed that some of the azure core modules may not be able to connect to azure portal due to firewall blocking ports when running behind corporate proxy
The development system will be used for the following actions:
Building and pushing the EII containers (including the bridge) to your Azure Container Registry
Creating your Azure IoT Hub deployment manifest
Deploying your manifest to a single node
For testing purposes, your development system can serve to do the actions detailed above, as well as being the device you use for your single-node deployment. This should not be done in a production environment, but it can be helpful when familiarizing yourself with the Edge-to-Cloud Bridge for Microsoft Azure* service.
First, setup your system for building EII. To do this, follow the instructions
detailed in the main EII README and the EII User Guide. At the end, you should
have installed Docker, Docker Compose, and other EII Python dependencies for
the Builder script in the ../build/ directory.
Once this is completed, install the required components to user the Azure CLI
and development tools. The script ./tools/install-dev-tools.sh automates this
process. To run this script, execute the following command:
Note
It is highly recommended that you use a python virtual environment to install the python packages, so that the system python installation doesn’t get altered. Details on setting up and using python virtual environment can be found here: https://www.geeksforgeeks.org/python-virtual-environment/
If one encounter issues with conflicting dependencies between python packages, upgrade the pip version:
pip3 install -U pipand try.
sudo -H -E -u ${USER} ./tools/install-dev-tools.sh
Set the PATH environmental variable as mentioned in the terminal
where you are using iotedgedev and iotedgehubdev commands:
export PATH=~/.local/bin:$PATH
Note
The
-u ${USER}flag above allows the Azure CLI to launch your browser (if it can) so you can login to your Azure account.Occasionally, pip’s local cache can get corrupted. If this happens, pip may
SEGFAULT. In the case that this happens, delete the~/.localdirectory on your system and re-run the script mentioned above. You may consider creating a backup of this directory just in case.
While running this script you will be prompted to sign-in to your Azure account so you can run commands from the Azure CLI that interact with your Azure instance.
This script will install the following tools:
Azure CLI
Azure CLI IoT Edge/Hub Extensions
Azure
iotedgehubdevdevelopment toolAzure
iotedgedevdevelopment tool
Next, login to your Azure Container Registry with the following command:
az acr login --name <ACR Name>
Note
Fill in <ACR Name> with the name of your Azure Container Registry
IMPORTANT NOTE:
Refer to the list of supported services at the end of this README for the services which can be pushed to an ACR instance. Not all EII services are supported by and validated to work with the Edge-to-Cloud Bridge for Microsoft Azure* service.
OpcuaExport
OpcuaExport service serves as OPCUA server subscribring to classified results from message bus and starts publishing meta data to OPCUA clients.
Note
:
OpcuaExport service subscribes classified results from both Video Analytics app (video) or InfluxDBConnector (time-series) use cases. Ensure that the required service to subscribe is mentioned in the Subscribers configuration in config.json([WORK_DIR]/IEdgeInsights/OpcuaExport/config.json).
Steps to Independently Build and Deploy the OpcuaExport Service
Note
For running two or more microservices, it is recommended that the user tries the use case-driven approach for building and deploying, as mentioned in Generate Consolidated Files for a Subset of Edge Insights for Industrial Services.
Steps to Independently Build the OpcuaExport Service
To independently build OpcuaExport service, complete the following steps:
Note
When switching between independent deployment of the service with and without config manager agent service dependency, user might run into issues with docker-compose build w.r.t Certificates folder existence. As a workaround, run the command sudo rm -rf Certificates to proceed with docker-compose build.
The downloaded source code should have a directory named OpcuaExport:
cd IEdgeInsights/OpcuaExport
Copy the IEdgeInsights/build/.env file using the following command in the current folder
cp ../build/.env .
NOTE: Update the HOST_IP and ETCD_HOST variables in the .env file with your system IP.
# Source the .env using the following command:
set -a && source .env && set +a
Independently build
docker-compose build
Steps to Independently Deploy OpcuaExport Service
User can deploy the OpcuaExport service in any of the following two ways:
Deploy OpcuaExport Service without Config Manager Agent Dependency
Run the following commands to deploy OpcuaExport service without Config Manager Agent dependency:
# Enter the OpcuaExport directory
cd IEdgeInsights/OpcuaExport
Copy the IEdgeInsights/build/.env file using the following command in the current folder, if not already present.
cp ../build/.env .Note: Ensure that
docker psis clean anddocker network lsdoesn’t have EII bridge network.
Update .env file for following:
1. HOST_IP and ETCD_HOST variables with your system IP.
2. `READ_CONFIG_FROM_FILE_ENV` value to `true` and `DEV_MODE` value to `true`.

Source the .env using the following command:
set -a && source .env && set +a
# Run the service
docker-compose -f docker-compose.yml -f docker-compose-dev.override.yml up -d
Note
OpcuaExport container restarts automatically when its config is modified in config.json file.
If user is updating the config.json file using vi or vim editor, it is required to append the set backupcopy=yes in ~/.vimrc so that the changes done on the host machine config.json gets reflected inside the container mount point.
Deploy OpcuaExport Service with Config Manager Agent Dependency
Run the following commands to deploy OpcuaExport service with Config Manager Agent dependency:
Note
Ensure that the Config Manager Agent image present in the system. If not, build the Config Manager Agent locally when independently deploying the service with Config Manager Agent dependency.
# Enter the OpcuaExport directory
cd IEdgeInsights/OpcuaExport
Copy the IEdgeInsights/build/.env file using the following command in the current folder, if not already present.
cp ../build/.env .
Note
Ensure that docker ps is clean and docker network ls does not have EII bridge network.
Update .env file for following:
1. HOST_IP and ETCD_HOST variables with your system IP.
2. `READ_CONFIG_FROM_FILE_ENV` value is set to `false`.
Copy the docker-compose.yml from IEdgeInsights/ConfigMgrAgent as docker-compose.override.yml in IEdgeInsights/OpcuaExport.
cp ../ConfigMgrAgent/docker-compose.yml docker-compose.override.yml
Copy the builder.py with standalone mode changes from IEdgeInsights/build directory
cp ../build/builder.py .Run the builder.py in standalone mode, this will generate eii_config.json and update docker-compose.override.yml
python3 builder.py -s trueBuilding the service (This step is optional for building the service if not already done in the
Independently buildablestep above)docker-compose buildFor running the service in PROD mode, run the below command:
NOTE: Make sure to update
DEV_MODEtofalsein .env while running in PROD mode and source the .env using the commandset -a && source .env && set +adocker-compose up -dFor running the service in DEV mode, run the below command:
NOTE: Make sure to update
DEV_MODEtotruein .env while running in DEV mode and source the .env using the commandset -a && source .env && set +adocker-compose -f docker-compose.yml -f docker-compose-dev.override.yml -f docker-compose.override.yml up -d
Configuration
For more details on ETCD secrets and message bus endpoint configuration, visit Etcd_Secrets_Configuration.md and MessageBus Configuration respectively.
Service Bring Up
Complete the following steps to generate Opcua client certificates before running test client subscriber for production mode.
Refer to the following sections to build and launch OpcuaExport
Update Opcua client certificate access so that sample test program can access the certificates.
sudo chmod -R 755 ../../build/Certificates
Caution: This step will make the certs insecure. Do not do this step on a production machine.
To run a test subscriber follow the README at OpcuaExport/OpcuaBusAbstraction/c/test(
[WORK_DIR]/IEdgeInsights/OpcuaExport/OpcuaBusAbstraction/c/test)
OPCUA Client Apps
OpcuaExport service has been validated with the following third party OPCUA client apps:
OPCUA CTT tool (https://opcfoundation.org/developer-tools/certification-test-tools/opc-ua-compliance-test-tool-uactt/)
UaExpert (https://www.unified-automation.com/downloads/opc-ua-clients.html)
Integrated Objects (https://integrationobjects.com/sioth-opc/sioth-opc-unified-architecture/opc-ua-client/)
Prosys OPCUA client app(https://www.prosysopc.com/products/opc-ua-browser/)
Note
To connect with OPCUA client apps, User needs to take backup opcua_client_certificate.der([WORK_DIR]/IEdgeInsights/opcua_client_certificate.der) and copy OPCUA client apps certificate to it.
sudo chmod -R 755 ../../build/Certificates
cp <OPCUA client apps certificate> ../build/Certificates/opcua/opcua_client_certificate.der
Ensure not to bring down ConfigMgrAgent(ia_configmgr_agent) service, however restart necessary services like ia_opcua_export to reflect the changes.
Running in Kubernetes environment
Install provision and deploy helm chart
cd ../build/helm-eii/
helm install eii-gen-cert eii-gen-cert/
This will generate the Certificates under eii-deploy/Certificates folder.
sudo chmod -R 755 eii-deploy/Certificates
To connect with OPCUA client apps, user needs to copy OPCUA client apps certificate to opcua_client_certificate.der([WORK_DIR]/IEdgeInsights/opcua_client_certificate.der).
Deploy Helm Chart
helm install eii-deploy eii-deploy/
Access Opcua server using “opc.tcp://
RestDataExport Service
RestDataExport (RDE) service is a data service that serves GET and POST APIs. By default, the RDE service subscribes to a topic from the message bus and serves as GET API Server to respond to any GET requests for the required metadata and frames. By enabling the POST API, the RDE service publishs the subscribed metadata to an external HTTP server.
Important:
RestDataExport service subscribes to classified results from the Video Analytics (video) or the InfluxDB Connector (Time Series) use cases. In the subscriber configuration of the config.json(
[WORK_DIR]/IEdgeInsights/RestDataExport/config.json) file, specify the required service to subscribe.
Steps to Independently Build and Deploy RestDataExport Service
Note
For running 2 or more microservices, we recommend users to try the use case-driven approach for building and deploying as mentioned at Generate Consolidated Files for a Subset of Edge Insights for Industrial Services.
Steps to Independently Build RestDataExport Service
Note
When switching between independent deployment of the service with and without config manager agent service dependency, one would run into issues with the docker-compose build w.r.t Certificates folder existence. As a workaround, please run the command sudo rm -rf Certificates to proceed with docker-compose build.
To independently build RestDataExport service, complete the following steps:
The downloaded source code should have a directory named RestDataExport:
cd IEdgeInsights/RestDataExport
Copy the IEdgeInsights/build/.env file using the following command in the current folder
cp ../build/.env .
NOTE: Update the HOST_IP and ETCD_HOST variables in the .env file with your system IP.
# Source the .env using the following command:
set -a && source .env && set +a
Independently build
docker-compose build
Steps to Independently Deploy RestDataExport Service
You can deploy the RestDataExport service in any of the following two ways:
Deploy RestDataExport Service without Config Manager Agent Dependency
Run the following commands to deploy RestDataExport service without Config Manager Agent dependency:
# Enter the RestDataExport directory
cd IEdgeInsights/RestDataExport
Copy the IEdgeInsights/build/.env file using the following command in the current folder, if not already present.
cp ../build/.env .Note: Ensure that
docker psis clean anddocker network lsdoesn’t have EII bridge network.
Update .env file for following:
1. HOST_IP and ETCD_HOST variables with your system IP.
2. `READ_CONFIG_FROM_FILE_ENV` value to `true` and `DEV_MODE` value to `true`.

Source the .env using the following command:
set -a && source .env && set +a
# Run the service
docker-compose -f docker-compose.yml -f docker-compose-dev.override.yml up -d
Note
RestDataExport container restarts automatically when its config is modified in config.json file.
If user is updating the config.json file using vi or vim editor, it is required to append the set backupcopy=yes in ~/.vimrc so that the changes done on the host machine config.json gets reflected inside the container mount point.
Deploy RestDataExport Service with Config Manager Agent Dependency
Run the following commands to deploy RestDataExport service with Config Manager Agent dependency:
Note
Ensure that the Config Manager Agent image present in the system. If not, build the Config Manager Agent locally when independently deploying the service with Config Manager Agent dependency.
# Enter the RestDataExport
cd IEdgeInsights/RestDataExport
Copy the IEdgeInsights/build/.env file using the following command in the current folder, if not already present.
cp ../build/.env .
Note
Ensure that docker ps is clean and docker network ls does not have EII bridge network.
Update .env file for following:
1. HOST_IP and ETCD_HOST variables with your system IP.
2. `READ_CONFIG_FROM_FILE_ENV` value is set to `false`.
Copy the docker-compose.yml from IEdgeInsights/ConfigMgrAgent as docker-compose.override.yml in IEdgeInsights/RestDataExport.
cp ../ConfigMgrAgent/docker-compose.yml docker-compose.override.yml
Copy the builder.py with standalone mode changes from IEdgeInsights/build directory
cp ../build/builder.py .Run the builder.py in standalone mode, this will generate eii_config.json and update docker-compose.override.yml
python3 builder.py -s trueBuilding the service (This step is optional for building the service if not already done in the
Independently buildablestep above)docker-compose buildFor running the service in PROD mode, run the below command:
NOTE: Make sure to update
DEV_MODEtofalsein .env while running in PROD mode and source the .env using the commandset -a && source .env && set +a.docker-compose up -dFor running the service in DEV mode, run the below command:
NOTE: Make sure to update
DEV_MODEtotruein .env while running in DEV mode and source the .env using the commandset -a && source .env && set +a.docker-compose -f docker-compose.yml -f docker-compose-dev.override.yml -f docker-compose.override.yml up -d
Configuration
For more details on the ETCD secrets and message bus endpoint configuration, refer to the following:
HTTP GET API of RDE
The HTTP GET API of RDE allows you to get metadata and images. The following sections provide information about how to request metadata and images using the curl commands.
Get the Classifier Results Metadata
To get the classifier results metadata, refer to the following:
Request to GET Metadata
You can get the metadata for DEV mode and PROD mode.
For the DEV mode:
GET /metadata
Run the following command:
curl -i -H 'Accept: application/json' http://<machine_ip_address>:8087/metadata
Refer to the following example:
curl -i -H 'Accept: application/json' http://localhost:8087/metadata
For the PROD mode:
GET /metadata
Run the following command:
curl --cacert ../build/Certificates/rootca/cacert.pem -i -H 'Accept: application/json' https://<machine_ip_address>:8087/metadata
Refer to the following example:
curl --cacert ../build/Certificates/rootca/cacert.pem -i -H 'Accept: application/json' https://localhost:8087/metadata
Output:
The output for the previous command is as follows:
HTTP/1.1 200 OK
Content-Type: text/json
Date: Fri, 08 Oct 2021 07:51:07 GMT
Content-Length: 175
{"channels":3,"defects":[],"encoding_level":95,"encoding_type":"jpeg","frame_number":558,"height":1200,"img_handle":"21af429f85","topic":"edge_video_analytics_results","width":1920}
Get Images Using the Image Handle
Note
For the image API, the datastore module is mandatory. From the datastore, the server fetches the data, and returns it over the REST API. Include the datastore module as a part of your use case.
Request to GET Images
GET /image
Run the following command:
curl -o img.png 'http://<machine_ip_address>:8087/image?topic=<bucket_name>&img_handle=<img_handle>'
Refer to the following example to store image to the disk using curl along with img_handle:
curl -o img.png  'http://localhost:8087/image?topic=edge_video_analytics_results&img_handle=8c9cb7c35d'

% Total    % Received % Xferd  Average Speed   Time    Time     Time  Current
Dload  Upload   Total   Spent    Left  Speed
100  324k    0  324k    0     0  63.3M      0 --:--:-- --:--:-- --:--:-- 63.3M
Note
You can find the imageid of the image in the metadata API response.
Prerequisites to Run RestDataExport to POST on HTTP Servers
Note
By default, RDE will serve the metadata as GET only request server. By Enabling this, you can get the metadata using the GET request. Also, RDE will post the metadata to an HTTP server.
As a prerequisites, complete the following steps:
Update
[WORKDIR]/IEdgeInsights/build/.envfileHTTP_METHOD_FETCH_METADATAenvironment value as follows.HTTP_METHOD_FETCH_METADATA="POST"
Note: Ensure to rerun builder.py post changes, for generating updated deployment yml files.
If you are using the
HttpTestServerthen ensure that the server’s IP address is added to theno_proxy/NO_PROXYvars in:/etc/environment (Needs restart/relogin)
./docker-compose.yml (Needs to re-run the ‘builder’ step)
environment:
 AppName: "RestDataExport"
 DEV_MODE: ${DEV_MODE}
 no_proxy: ${ETCD_HOST}, <IP of HttpTestServer>
Run the following command to install
python etcd3pip3 install -r requirements.txt
Ensure the topics you subscribe to are also added in the config(
[WORK_DIR]/IEdgeInsights/RestDataExport/config.json) with theHttpServer endpointspecifiedUpdate the
config.jsonfile as follows:{ "edge_video_analytics_results": "http://<IP Address of Test Server>:8082", "point_classifier_results": "http://IP Address of Test Server:8082", "http_server_ca": "/opt/intel/eii/cert.pem", "rest_export_server_host": "0.0.0.0", "rest_export_server_port": "8087" }
Build and provision EII.
# Build all containers
docker-compose build
# Provision the EII stack by bringing up ConfigMgrAgent
docker-compose up -d ia_configmgr_agent
Ensure the prerequisites for starting the TestServer application are enabled. For more information, refer to the README.md.
As a prerequisite, before starting RestDataExport service, run the following commands.
Note: RestDataExport is pre-equipped with a python tool(
[WORK_DIR]/IEdgeInsights/RestDataExport/etcd_update.py) to insert data into etcd, which can be used to insert the requiredHttpServer ca certin the config of RestDataExport before running it.set -a && \ source ../build/.env && \ set +a # Required if running in the PROD mode only sudo chmod -R 777 ../build/Certificates/ python3 etcd_update.py --http_cert <path to ca cert of HttpServer> --ca_cert <path to etcd client ca cert> --cert <path to etcd client cert> --key <path to etcd client key> --hostname <IP address of host system> --port <ETCD PORT> Example: # Required if running in the PROD mode python3 etcd_update.py --http_cert "../tools/HttpTestServer/certificates/ca_cert.pem" --ca_cert "../build/Certificates/rootca/cacert.pem" --cert "../build/Certificates/root/root_client_certificate.pem" --key "../build/Certificates/root/root_client_key.pem" --hostname <IP address of host system> --port <ETCD PORT> # Required if running with k8s helm in the PROD mode python3 etcd_update.py --http_cert "../tools/HttpTestServer/certificates/ca_cert.pem" --ca_cert "../build/helm-eii/eii-deploy/Certificates/rootca/cacert.pem" --cert "../build/helm-eii/eii-deploy/Certificates/root/root_client_certificate.pem" --key "../build/helm-eii/eii-deploy/Certificates/root/root_client_key.pem" --hostname <Master Node IP address of ETCD host system> --port 32379
Start the TestServer application. For more information, refer to the README.md.
Ensure that the
DataStoreapplication is running. For more information refer to the README.md.
Launch RestDataExport Service
To build and launch the RestDataExport service, refer to the following:
Configure Environment Proxy Settings
To configure the environment proxy settings for RDE, refer to the following:
To update the host-ip for http, run the following command:
sudo vi /etc/systemd/system/docker.service.d/http-proxy.conf
To update the host-ip for https, run the following command:
sudo vi /etc/systemd/system/docker.service.d/https-proxy.conf (update host-ip)
To check if the proxy settings have been applied, run the following command:
env | grep proxy
To update the
no_proxy envvariable, run the following command:export no_proxy=$no_proxy,<host-ip>
To update docker proxy settings, run the following command:
sudo vi ~/.docker/config.json (update host-ip in no_proxy)
To reload the docker daemon, run the following command:
sudo systemctl daemon-reload
To restart the docker service with the updated proxy configurations, run the following command:
sudo systemctl restart docker
API Documentation
The RestDataExport generates the Open API documentation for all the REST APIs it exposes. This documentation can be accessed at its or documents endpoint.
http://< host ip >:8087/docs
Edge Insights for Industrial (EII) stack has the following set of tools that also run as containers:
Time Series Benchmarking Tool
These scripts are designed to automate the running of benchmarking tests and the collection of the performance data. This performance data includes the Average Stats of each data stream, the CPU %, Memory %, and Memory read/write bandwidth..
The Processor Counter Monitor (PCM) is required for measuring memory read or write bandwidth, which can be downloaded and built here
If you do not have PCM on your system, those values will be blank in the output.ppc
Steps for running a benchmarking test case:
Configure TimeSeriesProfiler config.json(
[WORK_DIR]/IEdgeInsights/tools/TimeSeriesProfiler/config.json) file to recieve rfc_results according to TimeSeriesProfiler README.md.Change the
commandoption in the MQTT publisher docker-compose.yml([WORK_DIR]/IEdgeInsights/tools/mqtt/publisher/docker-compose.yml) to:["--topic", "test/rfc_data", "--json", "./json_files/*.json", "--streams", "<streams>"]
For example:
["--topic", "test/rfc_data", "--json", "./json_files/*.json", "--streams", "1"]
To run the test case for the time series, ensure that “export_to_csv” value in TimeSeriesProfiler config.json(
[WORK_DIR]/IEdgeInsights/tools/TimeSeriesProfiler/config.json) is set to ‘True’ and run the following command:USAGE: ./execute_test.sh TEST_DIR STREAMS SLEEP PCM_HOME [EII_HOME] Where: TEST_DIR-Directory containing services.yml and config files for influx, telegraf, and kapacitor STREAMS-The number of streams i s(1, 2, 4, 8, 16) SLEEP-The number of seconds to wait after the containers come up PCM_HOME-The absolute path to the PCM repository where pcm.x is built [EII_HOME] - [Optional] Absolute path to EII home directory, if running from a non-default location
For example:
sudo -E ./execute_test.sh $PWD/samples 2 10 /opt/intel/pcm /home/intel/IEdgeInsights
To publish the data, ensure the EII containers are up and running. Start the MQTT broker and run the publisher publisher.py(
[WORK_DIR]/IEdgeInsights/tools/mqtt/publisher/publisher.py), following are the steps:### High Level Diagram of Multi Node Setup

To run in multi node: Add the node IP with “no_proxy” value in the /etc/environment file. Logout and login once env updated. Remove “tools/mqtt/ia_mqtt_broker” from samples/services.yml and run broker in the bare metal.
To run MQTT publisher in single node and multi node: Run the MQTT publisher from publisher.py(
[WORK_DIR]/IEdgeInsights/tools/mqtt/publisher/publisher.py):python3 publisher.py --host <host-ip> --port <port> --topic "test/rfc_data" --json "./json_files/*.json" --streams <number-of-streams> --interval <time-interval> --service <service>
For example:
python3 publisher.py --host localhost --port "1883" --topic "test/rfc_data" --json "./json_files/*.json" --streams 1 --interval 0.1 --service "benchmarking"
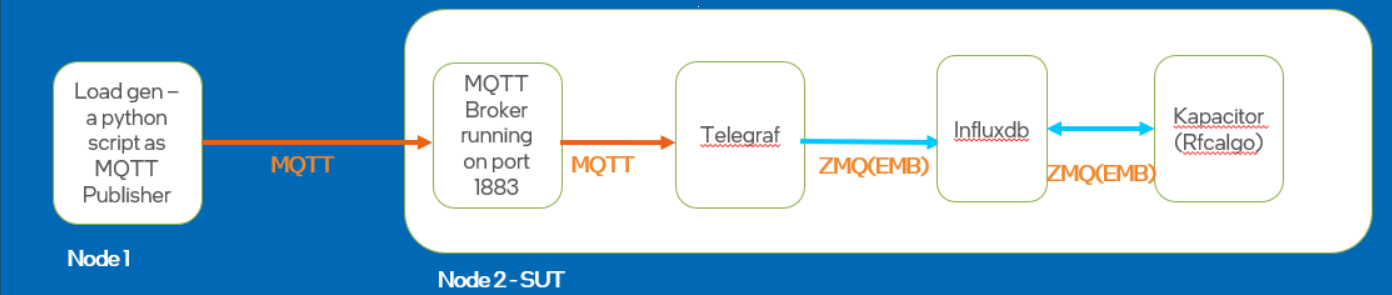
5.The execution logs, performance logs, and the output.ppc are saved in TEST_DIR/output/< timestamp >/ so that the same test case is run multiple times without overwriting the output. You can see if the test has any errors in the execution.log, and you can see the results of a successful test in output.ppc.
The time-series profiler output file (named “avg_latency_Results.csv”) is stored in TEST_DIR/output/< timestamp >/.
Note
While running benchmarking tool with more than one stream, run **MQTT broker([WORK_DIR]/IEdgeInsights/tools/mqtt/broker/)* manually with multiple instances and add the MQTT consumers in **Telegraf telegraf.conf([WORK_DIR]/IEdgeInsights/Telegraf/config/Telegraf/config.json)* with ‘n’ number of streams based on the use case.
Video Benchmarking Tool
These scripts are designed to automate the running of benchmarking tests and the collection of the performance data. This performance data includes the FPS of each video stream, and also the CPU %, Memory %, and Memory read/write bandwidth.
The Processor Counter Monitor (PCM) is required for measuring memory read/write bandwidth, which can be downloaded and built here.
If you do not have PCM on your system, those columns will be blank in the output.csv.
Run Video Benchmarking Tool with EdgeVideoAnalyticsMicroservice
Pre-requisites:
EVAM service needs to be built on the system as the benchmarking tool will only start the services and not build them.
Make sure RTSP server is started on a different system.
Steps for running a benchmarking test case:
Start the RTSP server on a different system on the network:
./stream_rtsp.sh <number-of-streams> <starting-port-number> <bitrate> <width> <height> <framerate>
For example:
./stream_rtsp.sh 16 8554 4096 1920 1080 40
Update RTSP camera IP in config.json(
[WORK_DIR]/IEdgeInsights/tools/Benchmarking/video-benchmarking-tool/evam_sample_test/config.json) and inRTSP_CAMERA_IPfield .env([WORK_DIR]/IEdgeInsights/.env)
Run evam_execute_test.sh with the desired benchmarking config:
```sh
USAGE:
    ./evam_execute_test.sh TEST_DIR STREAMS SLEEP PCM_HOME [EII_HOME]

WHERE:
    TEST_DIR  - The absolute path to directory containing services.yml for the services to be tested, and the config.json and docker-compose.yml.
    STREAMS   - The number of streams (1, 2, 4, 8, 16)
    SLEEP     - The number of seconds to wait after the containers come up
    PCM_HOME  - The absolute path to the PCM repository where pcm.x is built
    EII_HOME - [Optional] The absolute path to EII home directory, if running from a non-default location
```


For example:
```sh
sudo -E ./evam_execute_test.sh $PWD/evam_sample_test 16 60 /opt/intel/pcm [WORKDIR]/IEdgeInsights
```
The execution log, performance logs, and the output.csv will be saved in
TEST_DIR/< timestamp >/so that the same test case can be run multiple times without overwriting the output. If any errors occur during the test, you can view its details from the execution.log file. For successful test, you can view the results in final_output.csv.
DiscoverHistory Tool
You can get history metadata and images from the DataStore container using the DiscoverHistory tool.
Build and Run the DiscoverHistory Tool
This section provides information for building and running DiscoverHistory tool in various modes such as the PROD mode and the DEV mode.
Prerequisites
As a prerequisite to run the DiscoverHistory tool, a set of config, interfaces, public, and private keys should be present in ETCD. To meet the prerequisite, ensure that an entry for the DiscoverHistory tool with its relative path from the [WORK_DIR]/IEdgeInsights] directory is set in the video-streaming-evam-datastore.yml file in the [WORK_DIR]/IEdgeInsights/build/usecases/ directory. For more information, see the following example:
AppContexts:
- ConfigMgrAgent
- EdgeVideoAnalyticsMicroservice/eii
- Visualizer/multimodal-data-visualization-streaming/eii
- Visualizer/multimodal-data-visualization/eii
- DataStore
- tools/DiscoverHistory
Run the DiscoverHistory Tool in the PROD mode
After completing the prerequisites, perform the following steps to run the DiscoverHistory tool in the PROD mode:
Open the
config.jsonfile.
#. Enter the query for DataStore influxdb. #.
Run the following command to generate the new
docker-compose.ymlthat includes DiscoverHistory:python3 builder.py -f usecases/video-streaming-evam-datastore.yml
Provision, build, and run the DiscoverHistory tool along with the EII video-streaming-storage recipe or stack. For more information, refer to the EII README.
Check if the
ia_datastoreservice is running.Locate the
dataand theframesdirectories from the following path:/opt/intel/eii/tools_output. ..Note: The
framesdirectory will be created only ifimg_handleis part of the select statement. If frames directory is not created, restarting the DiscoverHistory service would help to create it as the dependent services would have come up by then.
#. Use the ETCDUI to change the query in the configuration. #.
Run the following command to start the container with new configuration:
docker restart ia_discover_history
Run the DiscoverHistory Tool in the DEV Mode
After completing the prerequisites, perform the following steps to run the DiscoverHistory tool in the DEV mode:
Open the [.env] file from the
[WORK_DIR]/IEdgeInsights/builddirectory.Set the
DEV_MODEvariable astrue.
Run the DiscoverHistory Tool in the zmq_ipc Mode
After completing the prerequisites, to run the DiscoverHistory tool in the zmq_ipc mode, modify the interface section of the config.json([WORK_DIR]/IEdgeInsights/tools/DiscoverHistory/config.json) file and interfaces/Servers section of DataStore config.json([WORK_DIR]/IEdgeInsights/DataStore/config.json) file as follows:
{
    //
    "type": "zmq_ipc",
    "EndPoint": "/EII/sockets"
}
Note: Ensure that both the DataStore server and DiscoverHistory client are running in zmq_ipc mode.
Sample Select Queries
The following table shows the samples for the select queries and its details:
Note
Include the following parameters in the query to get the good and the bad frames:
The following examples shows how to include the parameters:
“select img_handle, defects, encoding_level, encoding_type, height, width, channel from edge_video_analytics_results order by desc limit 10”
“select * from edge_video_analytics_results order by desc limit 10”
Multi-instance Feature Support for the Builder Script with the DiscoverHistory Tool
The multi-instance feature support of the Builder works only for the video pipeline ([WORK_DIR]/IEdgeInsights/build/usecase/video-streaming-evam.yml). For more details, refer to the EII core Readme
If you are enabling with multi instance configuration using the python builder.py script -v 2 feature with 2 instances of the DiscoverHistory tool enabled. Following changes to be made in Config Manager Agent service for each instance:
Change the Config of every instance
/DiscoverHistory<instanceNum>/configquerywith respective measurement name.topicwith respective measurement name.
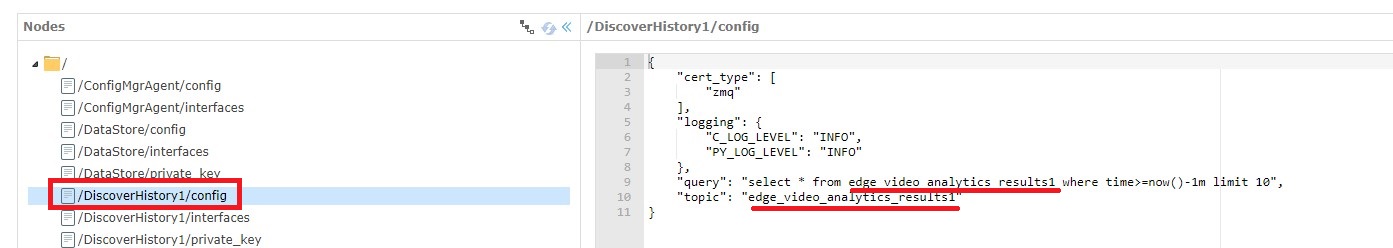
Add the client interface from config.json
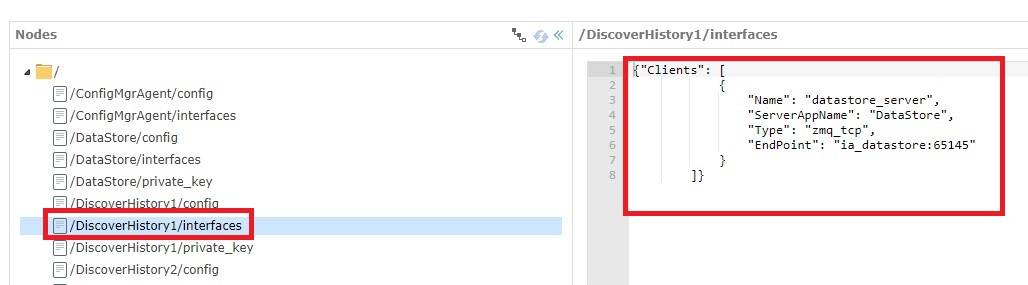
EmbPublisher
This tool acts as a brokered publisher of message bus.
Telegaf’s message bus input plugin acts as a subscriber to the EII broker.
How to Integrate this Tool with Video or Time Series Use Case
In the
time-series.yml/video-streaming.ymlfile, add theZmqBrokerandtools/EmbPublishercomponents.Use the modified
time-series.yml/video-streaming.ymlfile as an argument while generating the docker-compose.yml file using thebuilder.pyutility.Follow usual provisioning and starting process.
Configuration of the Tool
Let us look at the sample configuration:
{
  "config": {
    "pub_name": "TestPub",
    "msg_file": "data1k.json",
    "iteration": 10,
    "interval": "5ms"
  },
  "interfaces": {
    "Publishers": [
      {
        "Name": "TestPub",
        "Type": "zmq_tcp",
        "AllowedClients": [
          "*"
        ],
        "EndPoint": "ia_zmq_broker:60514",
        "Topics": [
          "topic-pfx1",
          "topic-pfx2",
          "topic-pfx3",
          "topic-pfx4"
        ],
        "BrokerAppName" : "ZmqBroker",
        "brokered": true
      }
    ]
  }
}
-pub_name:The name of the publisher in the interface.
-topics:The name of the topics seperated by comma, for which the publisher need to be started.
-msg_file:The file containing the JSON data, which represents the single data point (files should be kept into directory named ‘datafiles’).
-num_itr:The number of iterations.
-int_btw_itr:The interval between any two iterations.
Running the EmbPublisher in IPC Mode
User needs to modify the following interface section of config.json(``[WORK_DIR]/IEdgeInsights/tools/EmbPublisher/config.json``) to run in IPC mode:
"interfaces": {
  "Publishers": [
    {
      "Name": "TestPub",
      "Type": "zmq_ipc",
      "AllowedClients": [
        "*"
      ],
      "EndPoint": {
              "SocketDir": "/EII/sockets",
              "SocketFile": "frontend-socket"
          },
      "Topics": [
        "topic-pfx1",
        "topic-pfx2",
        "topic-pfx3",
        "topic-pfx4"
      ],
      "BrokerAppName" : "ZmqBroker",
      "brokered": true
    }
  ]
}
EmbSubscriber
EmbSubscriber subscribes message coming from the publisher. It subscribes to message bus topic to get the data.
Prerequisites
- EmbSubscriber expects a set of config, interfaces & public private keys to be present in ETCD as a prerequisite.
To achieve this, ensure an entry for the EmbSubscriber with its relative path from the IEdgeInsights(
[WORK_DIR]/IEdgeInsights/) directory is set in the time-series.yml file present in build/usecases([WORK_DIR]/IEdgeInsights/build/usecases) directory.For example:
AppName:
- ConfigMgrAgent
- Visualizer/multimodal-data-visualization/eii
- DataStore
- Kapacitor
- Telegraf
- tools/EmbSubscriber
After completing the previous prerequisites, execute the following command:
cd [WORKDIR]/IEdgeInsights/build
python3 builder.py -f usecases/time-series.yml
Run the EmbSubscriber
Refer to the ../README.md to provision, build and run the tool along with the EII Time Series recipe or stack.
Run the EmbSubscriber in IPC mode
To run EmbSubscriber in the IPC mode, modify the following interfaces section of the config.json([WORK_DIR]/IEdgeInsights/tools/EmbSubscriber/config.json) file:
{
  "config": {},
  "interfaces": {
    "Subscribers": [
      {
        "Name": "TestSub",
        "PublisherAppName": "Telegraf",
        "Type": "zmq_ipc",
        "EndPoint": {
                  "SocketDir": "/EII/sockets",
                  "SocketFile": "telegraf-out"
         },
        "Topics": [
          "*"
        ]
      }
    ]
  }
}
HttpTestServer
HttpTestServer runs a simple HTTP test server with security being optional.
Prerequisites for Running the HttpTestServer
To install EII libs on bare metal, follow the README of eii_libs_installer.
Generate the certificates required to run the HTTP Test Server using the following command:
./generate_testserver_cert.sh test-server-ipUpdate no_proxy to connect to the RestDataExport server:
export no_proxy=$no_proxy,<HOST_IP>
Starting HttpTestServer
Run the following command to start the HttpTestServer:
cd IEdgeInsights/tools/HttpTestServer
go run TestServer.go --dev_mode false --host <address of test server> --port <port of test server> --rdehost <address of Rest Data Export server> --rdeport <port of Rest Data Export server>
   Eg: go run TestServer.go --dev_mode false --host=0.0.0.0 --port=8082 --rdehost=localhost --rdeport=8087

For Helm Usecase:
Eg: go run TestServer.go --dev_mode false --host=0.0.0.0 --port=8082 --rdehost=<maser_node_ip>--rdeport=31509 --client_ca_path ../../build/helm-eii/eii-deploy/Certificates/rootca/cacert.pem
Note: server_cert.pem is valid for 365 days from the date of generation.
In PROD mode, you might see intermediate logs like this:
http: TLS handshake error from 127.0.0.1:51732: EOF
These logs are because of RestExport trying to check if the server is present by pinging it without using any certificates and can be ignored.
MQTT Publisher
The MQTT publisher is a tool to help publish the sample sensor data.
Usage
Note
This assumes you have already installed and configured Docker.
Provision, build and bring up the EII stack by following the steps in the README.
Note: By default, the tool publishes temperature data. If the user wants to publish other data, he or she needs to modify the command option in “ia_mqtt_publisher” service in build/docker-compose.yml([WORK_DIR]/IEdgeInsights/build/docker-compose.yml) accordingly and recreate the container using docker-compose up -d command from the build directory.
To publish temperature data to the default topic, the command option by default is set to:
["--temperature", "10:30"]
To publish temperature and humidity data together, change the command option to:
["--temperature", "10:30", "--humidity", "10:30", "--topic_humd", "temperature/simulated/0"]
To publish multiple sensor data sets (temperature, pressure, humidity) to the default topic (temperature/simulated/0, pressure/simulated/0, humidity/simulated/0), change the command option to:
["--temperature", "10:30", "--pressure", "10:30", "--humidity", "10:30"]
To publish a different topic instead of the default topic, change the command option to:
   ["--temperature", "10:30", "--pressure", "10:30", "--humidity", "10:30", "--topic_temp", <temperature topic>, "--topic_pres", <pressure topic>, "--topic_humd", <humidity topic>]

In a single topic, it is possible to publish more than one sensor data. In that case, the same topic name needs to be given for that sensor data.
For publishing data from csv row by row, change the command option to:
["--csv", "demo_datafile.csv", "--sampling_rate", "10", "--subsample", "1"]
To publish JSON files (to test random forest UDF), change the command option to:
["--topic", "test/rfc_data", "--json", "./json_files/*.json", "--streams", "1"]
If one wishes to see the messages going over MQTT, run the subscriber with the following command:
   ./subscriber.sh <port>

Example:
If Broker runs at port 1883, to run subscriber, use the following command:
./subscriber.sh 1883
NodeRedHttpClientApp
This Node-RED in-built HTTP node-based client app acts as a client for the EII RestDataExport and brings the EII Classifier data to the Node-RED ecosystem.
Configure NodeRed
Node-RED provides various options to install and set up Node-RED in your environment. For more information on installation and setup, refer to the Node-RED documenation.
Note
For quick setup, install using docker
docker run -it -p 1880:1880 --name myNodeRed nodered/node-red
Getting EII UDF Classifier result Data to Node-RED Environment Using Node-RED HTTPClient
Note
: RestDataExport should be running already as a prerequisite.
Refer to the RestDataExport Readme
Drag the
http requestnode from Node-RED’s default nodes to your existing workflow.
Update the
propertiesof the node as follows:For
DEV mode:Refer to the dialog properties for setting up the
DEVmode in the Node-Red dashboard
For
PROD Mode:Refer to the dialog properties for setting up the
PRODmode in the Node-RED dashboard.
For Prod Mode TLS
ca_cert.pemimport. Note: Thisca_cert.pemwill be part of the EII certificate bundle. Refer to the[WORKDIR]/IEdgeInsights/build/Certificates/directory.
Note:
For the
DEVmode, do not enable or attach the certificates.Update the
IPaddress as per theRestDataExportmodule running on the machine.For more details on Node-RED’s
http requestmodule, refer to Http requset.
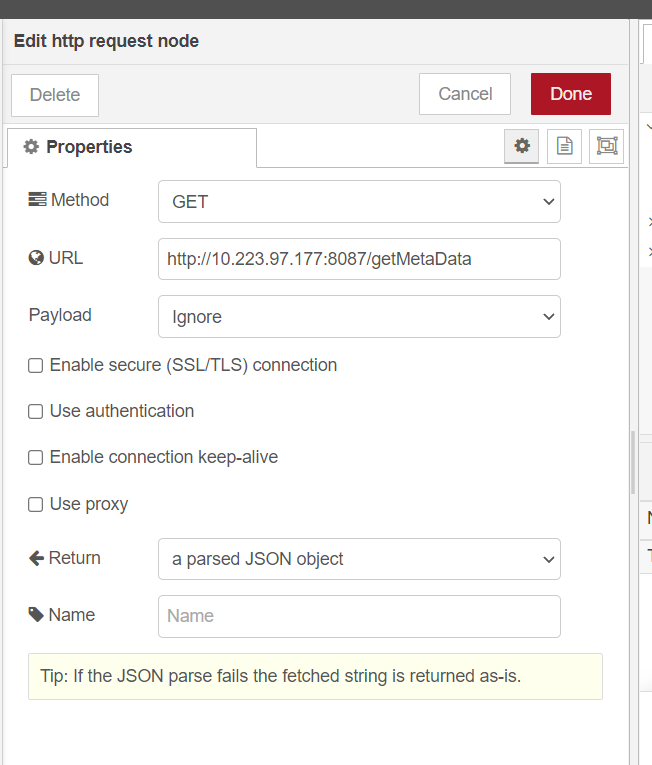


Sample Workflow
The attached workflow document is a sample workflow by updating the RestDataExport IP address in the http request module.
Following is the sample workflow:
Import the Sample Workflow flows.json(
[WORK_DIR]/IEdgeInsights/tools/NodeRedHttpClientApp/flows.json) file to the NodeRed dashboard usingmenuicon in the top right corner as follows:
Click
ImportUpdate the
URLof thehttp requestnode with theRestDataExportmodule running on the machine’s IP addressNote:
For more detail, refer to [import export] (https://nodered.org/docs/user-guide/editor/workspace/import-export)
The classifier results will be logged in the debug window.
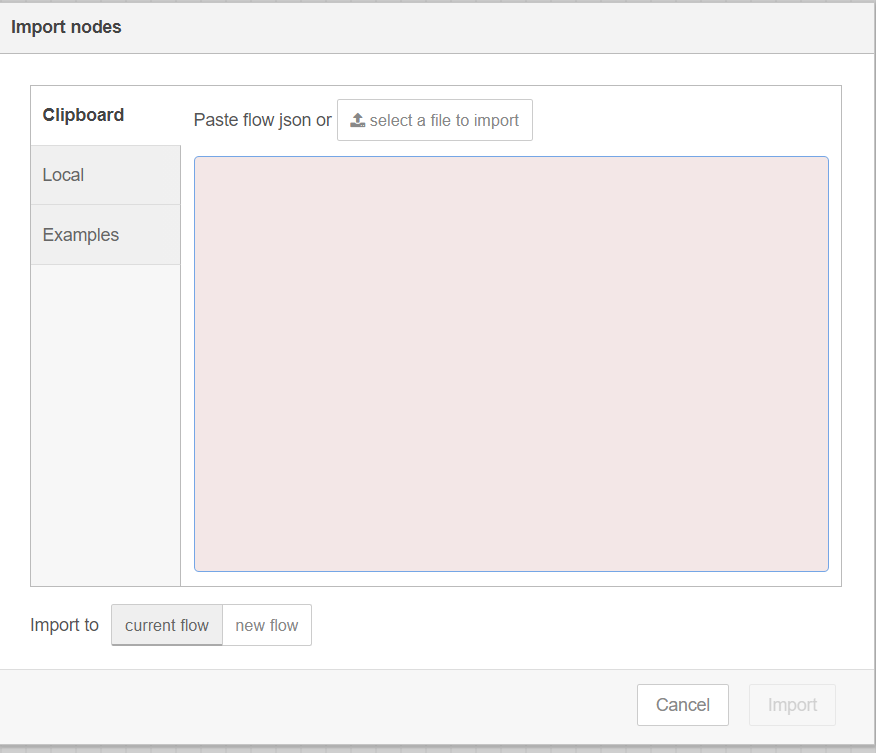
EII TimeSeriesProfiler
This module calculates the SPS (Samples Per Second) of any EII time-series modules based on the stream published by that respective module.
This module calculates the average end-to-end time for every sample of data to be processed and its breakup. The end-to-end is required for a metric from mqtt-publisher to TimeSeriesProfiler (mqtt-publisher->telegraf->influx->kapacitor->influx->datastore->TimeSeriesProfiler).
Prerequisites
TimeSeriesProfiler expects a set of config, interfaces and public or private keys to be present in ETCD as a prerequisite. To achieve this, ensure an entry for TimeSeriesProfiler with its relative path from IEdgeInsights(
[WORK_DIR]/IEdgeInsights/) directory is set in the time-series.yml file present in build/usecases([WORK_DIR]/IEdgeInsights/build/usecases) directory. Following is an example:AppContexts: - ConfigMgrAgent - Visualizer/multimodal-data-visualization-streaming/eii/ - Visualizer/multimodal-data-visualization/eii - DataStore - Kapacitor - Telegraf - tools/TimeSeriesProfiler
With the previous pre-requisite done, please run the following command:
python3 builder.py -f ./usecases/time-series.yml
EII TimeSeriesProfiler Mode
By default, the EII TimeSeriesProfiler supports two modes, which are “sps” and “monitor” mode.
SPS mode
This mode is enabled by setting the “mode” key in config(
[WORK_DIR]/IEdgeInsights/tools/TimeSeriesProfiler/config.json) to “sps”. This mode calculates the samples per second of any EII module by subscribing to that module’s respective stream."mode": "sps"
Monitor mode
This mode is enabled by setting the “mode” key in config(
[WORK_DIR]/IEdgeInsights/tools/TimeSeriesProfiler/config.json) to “monitor”. This mode calculates average and per-sample stats.Refer to the following example config where TimeSeriesProfiler is used in monitor mode:
    "config": {
    "mode": "monitor",
    "monitor_mode_settings": {
                                "display_metadata": false,
                                "per_sample_stats":false,
                                "avg_stats": true
                            },
    "total_number_of_samples" : 5,
    "export_to_csv" : false
}
"mode": "monitor"
The stats to be displayed by the tool in monitor_mode can be set in the monitor_mode_settings key of config.json(
[WORK_DIR]/IEdgeInsights/tools/TimeSeriesProfiler/config.json).‘display_metadata’:It displays the raw meta-data with timestamps associated with every sample.
‘per_sample_stats’:It continuously displays the per-sample metrics of every sample.
‘avg_stats’:It continuously displays the average metrics of every sample.
Note
Running in profiling or monitoring mode requires the following prerequisites: PROFILING_MODE should be set to true in .env(
[WORK_DIR]/IEdgeInsights/build/.env) time series containers.For running TimeSeriesProfiler in SPS mode, it is recommended to keep PROFILING_MODE set to false in .env(
[WORK_DIR]/IEdgeInsights/build/.env) for better performance.
EII TimeSeriesProfiler Configuration
total_number_of_samples
If mode is set to’sps’, the average SPS is calculated for the number of samples set by this variable. If mode is set to ‘monitor’, the average stats are calculated for the number of samples set by this variable. Setting it to (-1) will run the profiler forever unless terminated by stopping the container TimeSeriesProfiler manually. total_number_of_samples should never be set as (-1) for ‘sps’ mode.
export_to_csv
Setting this switch to true exports csv files for the results obtained in TimeSeriesProfiler. For monitor_mode, runtime stats printed in the csv are based on the following precdence: avg_stats, per_sample_stats, display_metadata.
Running TimeSeriesProfiler
Prerequisite:
Profiling UDF returns “ts_kapacitor_udf_entry” and “ts_kapacitor_udf_exit” timestamps.
The following are two examples:
profiling_udf.go(
[WORK_DIR]/IEdgeInsights/Kapacitor/udfs/profiling_udf.go)rfc_classifier.py(
[WORK_DIR]/IEdgeInsights/Kapacitor/udfs/rfc_classifier.py)
Additional: Adding timestamps in ingestion and UDFs:
To enable a user’s own ingestion and UDFs, timestamps must be added to the ingestion and UDFs modules, respectively.The TS Profiler needs three timestamps:
#. “ts” timestamp which is to be filled by the ingestor (done by the mqtt-publisher app). #.
The UDF must give “ts_kapacitor_udf_entry” and “ts_kapacitor_udf_exit” timestamps to profile the UDF execution time.
ts_kapacitor_udf_entry:timestamp in UDF before execution of the algorithm
ts_kapacitor_udf_exit:timestamp in UDF after execution of the algorithm.
The sample profiling UDFs can be referred to at profiling_udf.go(
[WORK_DIR]/IEdgeInsights/Kapacitor/udfs/profiling_udf.go) and rfc_classifier.py([WORK_DIR]/IEdgeInsights/Kapacitor/udfs/rfc_classifier.py).The configuration required to run profiling_udf.go as a profiling UDF
In Kapacitor config.json(``[WORK_DIR]/IEdgeInsights/Kapacitor/config.json``) , update “task” key as follows:
"task": [{
    "tick_script": "profiling_udf.tick",
    "task_name": "profiling_udf",
    "udfs": [{
       "type": "go",
       "name": "profiling_udf"
    }]
}]
In kapacitor.conf(``[WORK_DIR]/IEdgeInsights/Kapacitor/config/kapacitor.conf``), update udf section:
[udf.functions]
   [udf.functions.profiling_udf]
     socket = "/tmp/profiling_udf"
     timeout = "20s"
The configuration required to run rfc_classifier.py as a profiler UDF is as follows:
In Kapacitor config.json(``[WORK_DIR]/IEdgeInsights/Kapacitor/config.json``) , update “task” key as follows:
"task": [{
    {
     "tick_script": "rfc_task.tick",
     "task_name": "random_forest_sample"
     }
}]
In kapacitor.conf(``[WORK_DIR]/IEdgeInsights/Kapacitor/config/kapacitor.conf``) update udf section:
[udf.functions.rfc]
   prog = "python3.7"
   args = ["-u", "/EII/udfs/rfc_classifier.py"]
   timeout = "60s"
   [udf.functions.rfc.env]
      PYTHONPATH = "/EII/go/src/github.com/influxdata/kapacitor/udf/agent/py/"
Keep the config.json(
[WORK_DIR]/IEdgeInsights/tools/TimeSeriesProfiler/config.json) file as follows:{ "config": { "total_number_of_samples": 10, "export_to_csv": "False" }, "interfaces": { "Subscribers": [ { "Name": "default", "Type": "zmq_tcp", "EndPoint": "ia_datastore:65032", "PublisherAppName": "DataStore", "Topics": [ "rfc_results" ] } ] } }
In .env(
[WORK_DIR]/IEdgeInsights/build/.env): Set the profiling mode to true.
Set environment variables accordingly in config.json(
[WORK_DIR]/IEdgeInsights/tools/TimeSeriesProfiler/config.json).
#. Set the required output stream or streams and the appropriate stream config in the config.json([WORK_DIR]/IEdgeInsights/tools/TimeSeriesProfiler/config.json) file.
#.
To run this tool in IPC mode, the user must make the following changes to the subscribers interface section of [config.json] (./config.json)**:
{
  "type": "zmq_ipc",
  "EndPoint": "/EII/sockets"
}
To provision, build, and run the tool along with the EII time-series recipe or stack, see README.md.
Run the following command to see the logs:
docker logs -f ia_timeseries_profiler
EII Video Profiler
This tool can be used to determine the complete metrics involved in the entire video pipeline by measuring the time difference between every component of the pipeline and checking for queue blockages at every component, thereby determining the fast or slow components of the whole pipeline. It can also be used to calculate the FPS of any EII modules based on the stream published by that respective module.
EII Video Profiler Prerequisites
- VideoProfiler expects a set of config, interfaces, and public private keys to be present in ETCD as a prerequisite.
To achieve this, ensure an entry for VideoProfiler with its relative path from IEdgeInsights(
[WORK_DIR]/IEdgeInsights/) directory is set in any of the.yml files present in build/usecases([WORK_DIR]/IEdgeInsights/build/usecases) directory. Following is an example:
AppContexts:
- tools/VideoProfiler
With the previous prerequisite done, run the following command:
python3 builder.py -f usecases/video-streaming-evam.yml
EII Video Profiler Modes
By default, the EII Video Profiler supports the FPS and the Monitor modes. The following are details for these modes:
FPS mode Enabled by setting the’mode’ key in config(
[WORK_DIR]/IEdgeInsights/tools/VideoProfiler/config.json) to ‘fps’, this mode calculates the frames per second of any EII module by subscribing to that module’s respective stream."mode": "fps"
Note: For running the Video Profiler in the FPS mode, it is recommended to keep PROFILING_MODE set to false in .env(
[WORK_DIR]/IEdgeInsights/build/.env) for better performance.Monitor mode Enabled by setting the ‘mode’ key in config(
[WORK_DIR]/IEdgeInsights/tools/VideoProfiler/config.json) to ‘monitor’, this mode calculates average and per-frame stats for every frame while identifying if the frame was blocked at any queue of any module across the video pipeline, thereby determining the fastest and slowest components in the pipeline. To be performant in profiling scenarios, VideoProfiler is enabled to work when subscribing only to a single topic in monitor mode.
Note
VideoProfiler tool doesn’t work in monitor mode with Edge Video Analytics Microservice
"mode": "monitor"
The stats to be displayed by the tool in monitor_mode can be set in the monitor_mode_settings key of config.json([WORK_DIR]/IEdgeInsights/tools/VideoProfiler/config.json).
‘display_metadata’: It displays the raw meta-data with timestamps associated with every frame.
‘per_frame_stats’: It continuously displays the per-frame metrics of every frame.
‘avg_stats’: It continuously displays the average metrics of every frame.
Note
As a prerequisite for running in profiling or monitor mode, the PROFILING_MODE should be set to true in .env(
[WORK_DIR]/IEdgeInsights/build/.env)It is mandatory to have a UDF to run in monitor mode.
EII Video Profiler Configuration
Following are the EII Video Profiler configurations:
dev_mode
Setting this to false enables secure communication with the EII stack. The user must ensure this switch is in sync with DEV_MODE in .env(
[WORK_DIR]/IEdgeInsights/build/.env) with PROD mode enabled, the path for the certs mentioned in config([WORK_DIR]/IEdgeInsights/tools/VideoProfiler/config.json) can be changed by the user to point to the required certs.total_number_of_frames
If mode is set to ‘fps’, the average FPS is calculated for the number of frames set by this variable. If mode is set to “monitor”, the average stats are calculated for the number of frames set by this variable. Setting it to (-1) will run the profiler forever unless terminated by signal interrupts(‘Ctrl+C’).total_number_of_frames should never be set as (-1) for ‘fps’ mode.
export_to_csv
Setting this switch to true exports csv files for the results obtained in VideoProfiler. For monitor_mode, runtime stats printed in the csv are based on the following precdence: avg_stats, per_frame_stats, display_metadata.
Run Video Profiler
Following are the steps to run the video profiler:
Set the environment variables accordingly in config.json(
[WORK_DIR]/IEdgeInsights/tools/VideoProfiler/config.json).Set the required output stream or streams and the appropriate stream config in the config.json(
[WORK_DIR]/IEdgeInsights/tools/VideoProfiler/config.json) file.If VideoProfiler is subscribing to multiple streams, ensure the AppName of VideoProfiler is added to the Clients list of all the publishers.
If using Video Profiler in IPC mode, ensure to set the required permissions to socket file created in SOCKET_DIR in build/.env(
[WORK_DIR]/IEdgeInsights/build/.env).sudo chmod -R 777 /opt/intel/eii/sockets
Note:
This step is required every time the publisher is restarted in IPC mode.
Caution: This step will make the streams insecure. Do not do it on a production machine.
Refer the following VideoProfiler interface example to subscribe to EdgeVideoAnalyticsMicroservice results in the FPS mode:
"/VideoProfiler/interfaces": {
       "Subscribers": [
           {
               "EndPoint": "/EII/sockets",
               "Name": "default",
               "PublisherAppName": "EdgeVideoAnalyticsMicroservice",
               "Topics": [
                   "edge_video_analytics_results"
               ],
               "Type": "zmq_ipc"
           }
       ]
   },
If you’re using VideoProfiler with the Helm usecase or trying to subscribe to any external publishers outside the EII network, ensure the correct IP of the publisher is specified in the interfaces section of [config] (config.json) and the correct ETCD host and port are specified in the environment for ETCD_ENDPOINT and ETCD_HOST.
For example, for the helm use case, since the ETCD_HOST and ETCD_PORT are different, run the following commands with the required HOST IP:
export ETCD_HOST="<HOST IP>"
export ETCD_ENDPOINT="<HOST IP>:32379"
To provision, build, and run the tool along with the EII video-streaming recipe or stack, see provision/README.md.
Ensure the containers VideoProfiler is subscribing to are up and running before trying to bring up VideoProfiler.
For example, if VideoProfiler is subcribed to EVAM, use these commands to bring up the entire EII stack and then restart VideoProfiler once the publishing containers are up and running:
docker-compose up -d
# Restart VideoProfiler after the publisher is up
# by checking the logs
docker restart ia_video_profiler
Run the following command to see the logs:
docker logs -f ia_video_profiler
The runtime stats of Video Profiler, if enabled with the export_to_csv switch, can be found at [video_profiler_runtime_stats]. (video_profiler_runtime_stats.csv)
Run VideoProfiler in Helm Use Case
For running VideoProfiler in the helm use case to subscribe to either EVAM service, the etcd endpoint, volume mount for helm certs, and service endpoints are to be updated.
For connecting to the ETCD server running in the helm environment, the endpoint and required volume mounts should be modified in the following manner in the environment and volumes section of docker-compose.yml([WORK_DIR]/IEdgeInsights/tools/VideoProfiler/docker-compose.yml):
ia_video_profiler:
  ...
  environment:
  ...
    ETCD_HOST: ${ETCD_HOST}
    ETCD_CLIENT_PORT: ${ETCD_CLIENT_PORT}
    # Update this variable referring
    # for helm use case
    ETCD_ENDPOINT: <HOST_IP>:32379
    CONFIGMGR_CERT: "/run/secrets/VideoProfiler/VideoProfiler_client_certificate.pem"
    CONFIGMGR_KEY: "/run/secrets/VideoProfiler/VideoProfiler_client_key.pem"
    CONFIGMGR_CACERT: "/run/secrets/rootca/cacert.pem"
  ...
  volumes:
    - "${EII_INSTALL_PATH}/tools_output:/app/out"
    - "${EII_INSTALL_PATH}/sockets:${SOCKET_DIR}"
    - ./helm-eii/eii-deploy/Certificates/rootca:/run/secrets/rootca
    - ./helm-eii/eii-deploy/Certificates/VideoProfiler:/run/secrets/VideoProfiler
For connecting to any service running in the helm usecase, the container IP associated with the specific service should be updated in the Endpoint section in VideoProfiler config([WORK_DIR]/IEdgeInsights/tools/VideoProfiler/config.json).
The IP associated with the service container can be obtained by checking the container pod IP using docker inspect. Assuming we are connecting to the EVAM service, execute the following command:
docker inspect <VIDEOANALYTICS CONTAINER ID> | grep -i "EdgeVideoAnalytics"
The output of the previous command consists of the IP of the Video Analytics container that can be updated in the VideoProfiler config using EtcdUI:
"VIDEOANALYTICS_SERVICE_HOST=10.99.204.80"
The config can be updated with the obtained container IP in the following way:
{
    "interfaces": {
        "Subscribers": [
            {
               ..
                "EndPoint": "10.99.204.80:65114",
              ..
            }
        ]
    }
}
Benchmarking with Multi-instance Config
EII supports multi-instance config generation for benchmarking purposes. This is accomplished by running the builder.py(
[WORK_DIR]/IEdgeInsights/build/builder.py) with specific parameters, refer to the Multi-instance Config Generation section of EII Pre-requisites in the README for more details.For running VideoProfiler for multiple streams, run the builder with the -v flag provided the pre-requisites mentioned previously are done. The following is an example for generating 6 streams config:
python3 builder.py -f usecases/video-streaming-evam.yml -v 6
Note
In IPC mode, for accelerators:
GPU, and USB 3.0 Vision cameras, adduser: rootin VideoProfiler-docker-compose.yml([WORK_DIR]/IEdgeInsights/docker-compose.yml) as the subscriber needs to run asrootif the publisher is running asroot.
This section provides more information about the Edge Insights for Industrial (EII) sample apps and how to use the core libraries packages like Utils, Message Bus, and ConfigManager in various flavors of Linux such as Ubuntu and Alpine operating systems or docker images for programming languages such as C++, Go, and Python.
The following table shows the details for the supported flavors of Linux operating systems or docker images and programming languages that support sample apps:
Linux Flavor |
Languages |
|---|---|
|
|
|
|
The sample apps are classified as publisher and subscriber apps. For more information, refer to the following:
Run the Samples Apps
For default scenario, the sample custom UDF containers are not the mandatory containers to run. The builder.py script runs the sample-apps.yml from the build/usecases([WORK_DIR]/IEdgeInsights/build/usecases) directory and adds all the sample apps containers. Refer to the following list to view the details of the sample apps containers:
AppContexts:
# CPP sample apps for Ubuntu and Alpine operating systems or docker images
- Samples/publisher/cpp/ubuntu
- Samples/publisher/cpp/alpine
- Samples/subscriber/cpp/ubuntu
- Samples/subscriber/cpp/alpine

# Python sample apps for Ubuntu operating systems or docker images
- Samples/publisher/python/ubuntu
- Samples/subscriber/python/ubuntu

# Go sample apps for Ubuntu and Alpine operating systems or docker images
- Samples/publisher/go/ubuntu
- Samples/publisher/go/alpine
- Samples/subscriber/go/ubuntu
- Samples/subscriber/go/alpine
To run the
sample-apps.ymlfile, execute the following command:cd [WORKDIR]/IEdgeInsights/build python3 builder.py -f ./usecases/sample-apps.yml file used>
Refer to Build EII stack and the Run EII service sections to build and run the sample apps.
Web Deployment Tool
Web Deployment Tool is a GUI tool to facilitate EII configuration and deployment for single and multiple video streams.
Web Deployment Tool features include:
Offers GUI interface to try out EII stack for video use case
Supports multi-instance feature of EVAM service
Supports an easy way to use or modify existing UDFs or add new UDFs
Supports preview to visualize the analyzed frames
Supports deployment of the tested configuration on other remote nodes via ansible
To learn about launching and using the Web Deployment Tool, refer to the following:
Ansible based EII Prequisites setup, provisioning, build and deployment
Ansible is an automation engine which can enable Edge Insights for Industrial (EII) deployment across single nodes. One control node is required where ansible is installed and optional hosts. Control node itself can be used to deploy EII.
Note
In this document, you will find labels of ‘Edge Insights for Industrial (EII)’ for filenames, paths, code snippets, and so on.
Ansible can execute the tasks on control node based on the playbooks defined
There are three types of nodes:
Control node where ansible must be installed.
EII leader node where ETCD server will be running and optional worker nodes, all worker nodes remotely connect to ETCD server running on leader node.
Control node and EII leader node can be the same.
Installing Ansible on Ubuntu {Control node}
Execute the following command in the identified control node machine.
```sh
    sudo apt update
    sudo apt install software-properties-common
    sudo apt-add-repository --yes --update ppa:ansible/ansible
    sudo apt install ansible
```
Prerequisite Steps Required for all the Control/Worker Nodes
Generate SSH KEY for all Nodes
Generate the SSH KEY for all nodes using following command (to be executed in the only control node), ignore to run this command if you already have ssh keys generated in your system without id and passphrase,
ssh-keygen
Note
Do not give any passphrase and id, just press Enter for all the prompt which will generate the key.
For Example,
$ ssh-keygen

Generating public/private rsa key pair.
Enter file in which to save the key (/root/.ssh/id_rsa):  <ENTER>
Enter passphrase (empty for no passphrase):  <ENTER>
Enter same passphrase again:  <ENTER>
Your identification has been saved in ~/.ssh/id_rsa.
Your public key has been saved in ~/.ssh/id_rsa.pub.
The key fingerprint is:
SHA256:vlcKVU8Tj8nxdDXTW6AHdAgqaM/35s2doon76uYpNA0 root@host
The key's randomart image is:
+---[RSA 2048]----+
|          .oo.==*|
|     .   .  o=oB*|
|    o . .  ..o=.=|
|   . oE.  .  ... |
|      ooS.       |
|      ooo.  .    |
|     . ...oo     |
|      . .*o+.. . |
|       =O==.o.o  |
+----[SHA256]-----+
Updating the Leader Information for Using Remote Hosts
Note
By default both control/leader node ansible_connection will be localhost in single node deployment.
Follow the steps to update the details of leader node for remote node scenario.
Update the hosts information in the inventory file
hosts[group_name] <nodename> ansible_connection=ssh ansible_host=<ipaddress> ansible_user=<machine_user_name> For Example'[targets] leader ansible_connection=ssh ansible_host=192.0.0.1 ansible_user=user1
Note
ansible_connection=sshis mandatory when you are updating any remote hosts, which makes ansible to connect viassh.The above information is used by ansible to establish ssh connection to the nodes.
control node will always be
ansible_connection=local, don’t update the control node’s informationTo deploy EII in single ,
ansible_connection=localandansible_host=localhostTo deploy EII on remote node,
ansible_connection=sshandansible_host=<remote_node_ip>andansible_user=
Updating the EII Source Folder, Usecase and Proxy Settings in Group Variables
Open
group_vars/all.ymlfilevi group_vars/all.ymlUpdate Proxy Settings
enable_system_proxy: true
http_proxy: <proxy_server_details>
https_proxy: <proxy_server_details>
no_proxy: <managed_node ip>,<controller node ip>,<worker nodes ip>,localhost,127.0.0.1
Update the
EII Secretsusername and passwords ingroup_vars/all.ymlrequired to run few EII Services inPRODmode onlyUpdate the
usecasevariable, based on the usecasebuilder.pygenerates the EII deployment and config files.Note
By default it will be
video-streaming, For other usecases refer the../usecasesfolder and update only names without.ymlextensionFor
allusecase, it will bring up alldefaultservices of eii.ia_kapacitorandia_telegrafcontainer images are not distributed via docker hub, so one won’t be able to pull these images for time-series use case upon using ../usecases/time-series.yml([WORK_DIR]/IEdgeInsights/build/usecases/time-series.yml) for deployment. For more details, refer to [../README.md#distribution-of-eii-container-images]> (../README.md#distribution-of-eii-container-images).
For Example, if you want build & deploy for
../usecases/time-series.ymlupdate theusecasekey value astime-seriesusecase: <time-series>Optionally, you can choose number of video pipeline instances to be created by updating
instancesvariableUpdate other optional variables provided if required
Remote Node Deployment
Follwoing configuration changes need to be made for remote node deployment without k8s
#. Single node deployment all the services based on the usecase chosen will be deployed.
#.
Update
dockerregistry details in following section if using a custom/private registrydocker_registry="<regsitry_url>" docker_login_user="<username>" docker_login_passwd="<password>"Note Use of
docker_registryandbuildflags are as follows:
Update the
docker_registrydetails to use docker images from custom registry, optionally setbuild: trueto push docker images to this registryUnset the
docker_registrydetails if you do not want to use custom registry and setbuild: trueto save and load docker images from one node to another node
If you are using images from docker hub, then set
build: falseand unsetdocker_registrydetails
Execute Ansible Playbook from [EII_WORKDIR]/IEdgeInsights/build/ansible {Control node} to deploy EII services in control node/remote node
Note
Updating messagebus endpoints to connect to interfaces is still the manual process. ensure to update Application specific endpoints in
[AppName]/config.jsonAfter
pre-requisitesare successfully installed, Ensure to logout and login to apply the changesIf you are facing issues during installation of docker, remove all
bionicrelated entries of docker from the sources.list and keyring gpg.
For Single Point of Execution
Note
This will execute all the steps of EII as prequisite, build, provision, deploy & setup all nodes for deployement usecase in one shot sequentialy.
ansible-playbook eii.yml
Following Steps are the Individual Execution of Setups.
Load
.envvalues from templateansible-playbook eii.yml --tags "load_env"
For EII Prequisite Setup
ansible-playbook eii.yml --tags "prerequisites"
Note After
pre-requisitesare successfully installed, please do logout and login to apply the changesTo generate builder and config files, build images and push to registry
ansible-playbook eii.yml --tags "build"
To generate eii bundles for deployment
ansible-playbook eii.yml --tags "gen_bundles"
To deploy the eii modules
ansible-playbook eii.yml --tags "deploy"
Deploying EII Using Helm in Kubernetes (k8s) Environment
Note
To Deploy EII using helm in k8s aenvironment,
k8ssetup is a prerequisite.You need update the
k8sleader machine as leader node inhostsfile.Non
k8sleader machine thehelmdeployment will fail.For
k8sdeploymentremote_nodeparameters will not applicable, Since node selection & pod selection will be done byk8sorchestrator.Make sure you are deleting
/opt/intel/eii/datawhen switch fromprodmode todevmode in all yourk8sworkernodes.
Update the
DEPLOYMENT_MODEflag ask8singroup_vars/all.ymlfile:Open
group_vars/all.ymlfilevi group_vars/all.ymlUpdate the
DEPLOYMENT_MODEflag ask8s## Deploy in k8s mode using helm DEPLOYMENT_MODE: "k8s" ## Update "EII_HOME_DIR" to point to EII workspace when `DEPLOYMENT_MODE: "k8s"`. Eg: `EII_HOME_DIR: "/home/username/<dir>/IEdgeInsights/"` EII_HOME_DIR: ""
Save and Close
For Single Point of Execution
Note This will execute all the steps of EII as prequisite, build, provision, deploy for a usecase in one shot sequentialy.
ansible-playbook eii.yml
Note
Below steps are the individual execution of setups.
Load
.envvalues from templateansible-playbook eii.yml --tags "load_env"
For EII Prequisite Setup
ansible-playbook eii.yml --tags "prerequisites"
For building EII containers
ansible-playbook eii.yml --tags "build"
Prerequisites for deploy EII using Ansible helm environment.
ansible-playbook eii.yml --tags "helm_k8s_prerequisites"
Provision and Deploy EII Using Ansible helm environment
ansible-playbook eii.yml --tags "helm_k8s_deploy"
Intel® In-Band Manageability enables software updates and deployment from cloud to device. This includes the following:
Software over the air (SOTA)
Firmware update over the air (FOTA)
Application over the air (AOTA) and system operations
The AOTA update enables cloud to edge manageability of application services running on the Edge Insights for Industrial (EII) enabled systems through Intel® In-Band Manageability.
For EII use case, only the AOTA features from Intel® In-Band Manageability are validated and supported through Azure* and ThingsBoard* cloud-based management front end services. Based on your preference, you can use Azure* or ThingsBoard*.
The following sections provide information about:
Installing Intel® In-Band Manageability
Setting up Azure* and ThingsBoard*
Establishing connectivity with the target systems
Updating applications on systems
Installing Intel® In-Band Manageability
Refer the steps from edge_insights_industrial/Edge_Insights_for_Industrial_<version>/manageability/README.md to install the Intel® In-Band Manageability and configure Azure* and Thingsboard* servers with EII.
Known Issues
Thingsboard* Server fails to connect with devices after provisioning TC. Thingsboard* server setup fails on fresh server.
Edge Insights for Industrial Uninstaller
The EII uninstaller script automatically removes all the EII Docker configuration that is installed on a system. The uninstaller performs the following tasks:
Stops and removes all the EII running and stopped containers.
Removes all the EII docker volumes.
Removes all the EII docker images [Optional]
Removes all EII install directory
To run the uninstaller script, run the following command from the [WORKDIR]/IEdgeInsights/build/ directory:
./eii_uninstaller.sh -h
Usage: ./eii_uninstaller.sh [-h] [-d] This script uninstalls the previous EII version. Where:
-h show the help -d triggers the deletion of docker images (by default it will not trigger)
Example:
Run the following command to delete the EII containers and volumes:
./eii_uninstaller.sh
Run the following command to delete the EII containers, volumes, and images:
EII_VERSION=3.0.0 ./eii_uninstaller.sh -d
The commands in the example will delete the version 2.4 EII containers, volumes, and all the docker images.
Debugging Options
Perform the following steps for debugging:
Run the following command to check if all the EII images are built successfully:
docker images|grep ia
You can view all the dependency containers and the EII containers that are up and running. Run the following command to check if all containers are running:
docker psEnsure that the proxy settings are correctly configured and restart the docker service if the build fails due to no internet connectivity.
Run the
docker pscommand to list all the enabled containers that are included in thedocker-compose.ymlfile.From edge video analytics microservice>visualizer, check if the default video pipeline with EII is working fine.
The
/opt/intel/eiiroot directory gets created - This is the installation path for EII:data/- stores the backup data for persistent imagestore and influxdbsockets/- stores the IPC ZMQ socket files
The following table displays useful docker-compose and docker commands:
Command |
Description |
|---|---|
|
Builds all the service containers |
|
Builds a single service container |
|
Stops and removes the service containers |
|
Brings up the service containers by picking the changes done in the |
|
Checks the running containers |
|
Checks the running and stopped containers |
|
Stops all the containers |
|
Removes all the containers. This is useful when you run into issue of already container is in use |
|
For more information refer to the docker documentation |
|
For more information refer to the docker documentation |
|
For more information refer to the docker documentation |
|
To run the docker images separately or one by one. For example: |
|
Use this command to check logs of containers |
|
To see all the docker-compose service container logs at once |
Troubleshooting Guide
For any troubleshooting tips related to the EII configuration and installation, refer to the TROUBLESHOOT.md guide.
Since all the EII services are independently buildable and deployable when we do a
docker-compose upfor all EII microservices, the order in which they come up is not controlled. Having said this, there are many publishers and subscriber microservices in EII middleware, hence, its possible that publisher comes up before subscriber or there can be a slght time overlap wherein the subscriber can come up just after publisher comes up. Hence, in these scenarios its a possibility that the data published by publisher can be lost as subscriber would not be up to receive all the published data. So, the solution to address this is to restart the publisher after we are sure that the intended subscriber is up.If you observe any issues with the installation of the Python package, then as a workaround you can manually install the Python packages by running the following commands:
cd [WORKDIR]/IEdgeInsights/build
# Install requirements for builder.py
pip3 install -r requirements.txt
Note: To avoid any changes to the Python installation on the system, it is recommended that you use a Python virtual environment to install the Python packages. For more information on setting up and using the Python virtual environment, refer to Python virtual environment.
EII v4.1 Release Notes
Features
Enabled independent building and deployment of microservices
Simpler deployments or New EII services integration (
This additional option is being provided only in DEV mode) In this option, the module microservice does not depend on the ConfigManagerAgent (CMA) microservice for configuration. All the microservice configs are directly read from the microservices respective config.json files. Below are the two APIs added in the ConfigMgr library to enable this additonal option.Config file APIs
Config file watch
Complex deployments This is the existing use case driven approach of launching multiple microservices by using the use case yml file with the list of services. This deployment is supported both in DEV and PROD mode like earlier.
Enabled ETCD watch capability for video and timeseries services to auto-restart microservices when microservices config/interface changes are done via the EtcdUI interface
Timeseries pipeline improvement - provided volume mount option for loading the python udfs and other required configs in DEV mode for easy udf dev
Enabled Datastore Microservice, it adds support for running databases: InfluxDB* (vision and timeseries metadata) and MinIO* (image data)
Enhanced Edge Video Analytics Microservice (EVAM), is now the default Video analytics pipeline, which supports ingestion from diverse cameras (GenICam GigE and USB3 Cameras, RTSP Cameras and USB cameras), Gstreamer based UDF loader to run custom UDFs, image ingestion from storage & Geti SDK integration that enables usage of GETi generated deployment folder for model inference. All future EII new development for video capabilities will focus on EVAM instead of VI VA.
Added Helm charts improvements:
Enabled single helm charts (no separate provision and deployment helm charts)
Added steps around usage of NFS based persistent volumes (helpful while accessing PVs across nodes in cluster) – needed to run in Anthos cluster environment
Added Web Deployment Tool improvements
New UI design
Added support for Edge Video Analytics Microservice for vision use case
Added support for time series use case
The following fixes are added to improve security hardening:
Fixed security-related findings from the Bandit* and the hadolint* tools.
Upgraded the third-party software components to the latest versions as appropriate.
Hardened the Docker container image by removing the usage of the privilege flag and making the rootfs read-only for the Jupyter Notebook and the Config Manager Agent EII services.
Known Issues
For the known issues, refer the page.
Changes from 3.0.0 to 4.x.y
Independent build and deployment of services
All the EII services are aligning with the Microservice architecture principles of being Independently buildable and deployable.
Independently buildable and deployable feature is useful in allowing users to pick and choose only one service to build or deploy.
- The Independently buildable and deployable feature allows the users to build the individual service at the directory level and also allows the users to deploy the service in either of the two ways:
Without ConfigMgrAgent dependency:
Deployment without ConfigMgrAgent dependency is only available in DEV mode where we make use of the ConfigMgr library config file APIs, by setting the READ_CONFIG_FROM_FILE_ENV value to true in the .env
([WORK_DIR]/IEdgeInsights/build/.env)file.
Note
We recommend the users to follow this simpler docker-compose deployment approach while adding in new services or debugging the existing service.
With ConfigMgrAgent dependency:
Deployment with ConfigMgrAgent dependency is available in both DEV and PROD mode where we set the READ_CONFIG_FROM_FILE_ENV value to false in the .env
([WORK_DIR]/IEdgeInsights/build/.env)file and make use of the[WORK_DIR]/IEdgeInsights/ConfigMgrAgent/docker-compose.ymland the builder.py([WORK_DIR]/IEdgeInsights/build/builder.py)to deploy the service.
For Eg. for independently deploying Data Store service, follow the steps as mentioned here.
Note
We recommend the users to follow the use-case driven approach mentioned in Generate Consolidated Files for a Subset of Edge Insights for Industrial Services, when they want to deploy more than one microservice.
Deployment Changes
Deployment using docker-compose.yml on single node
- Run EII services:
The EII provisioning is taken care by the ia_configmgr_agent service which gets lauched as part of the EII stack. For more details on the ConfigMgr Agent component, refer to the Readme.
In the DEV and the PROD mode, if the EII services come before the Config Manager Agent service, then they would be in the restarting mode with error logs such as
Config Manager initialization failed....This is due to the single step deployment to support the independent deployment of the EII services, where services can come in a random order and start working when the dependent service comes up later. In one to two minutes, all the EII services should show the status as running when Config Manager Agent service starts up. To restart any service, use command likedocker-compose restart [container_name]ordocker restart [container_name].Use the following commands to run the EII services:
cd [WORK_DIR]/IEdgeInsights/build
docker-compose up -d
Deployment on k8s cluster using helm
In EII 4.0.0/4.1.0, there is no need of provisioning step for deploying helm charts as it was there for 3.0 version.The new provisioning flow handles this. Thus, the 2-step helm chart deployment has been replaced by single step deployment in EII 4.0.0/4.1.0 version. Follow the README. for the steps required helm deployment.