Contents
Time Series Benchmarking Tool
These scripts are designed to automate the running of benchmarking tests and the collection of the performance data. This performance data includes the Average Stats of each data stream, the CPU %, Memory %, and Memory read/write bandwidth..
The Processor Counter Monitor (PCM) is required for measuring memory read or write bandwidth, which can be downloaded and built here
If you do not have PCM on your system, those values will be blank in the output.ppc
Steps for running a benchmarking test case:
Configure TimeSeriesProfiler config.json(
[WORK_DIR]/IEdgeInsights/tools/TimeSeriesProfiler/config.json) file to recieve rfc_results according to TimeSeriesProfiler README.md.Change the
commandoption in the MQTT publisher docker-compose.yml([WORK_DIR]/IEdgeInsights/tools/mqtt/publisher/docker-compose.yml) to:["--topic", "test/rfc_data", "--json", "./json_files/*.json", "--streams", "<streams>"]
For example:
["--topic", "test/rfc_data", "--json", "./json_files/*.json", "--streams", "1"]
To run the test case for the time series, ensure that “export_to_csv” value in TimeSeriesProfiler config.json(
[WORK_DIR]/IEdgeInsights/tools/TimeSeriesProfiler/config.json) is set to ‘True’ and run the following command:USAGE: ./execute_test.sh TEST_DIR STREAMS SLEEP PCM_HOME [EII_HOME] Where: TEST_DIR-Directory containing services.yml and config files for influx, telegraf, and kapacitor STREAMS-The number of streams i s(1, 2, 4, 8, 16) SLEEP-The number of seconds to wait after the containers come up PCM_HOME-The absolute path to the PCM repository where pcm.x is built [EII_HOME] - [Optional] Absolute path to EII home directory, if running from a non-default location
For example:
sudo -E ./execute_test.sh $PWD/samples 2 10 /opt/intel/pcm /home/intel/IEdgeInsights
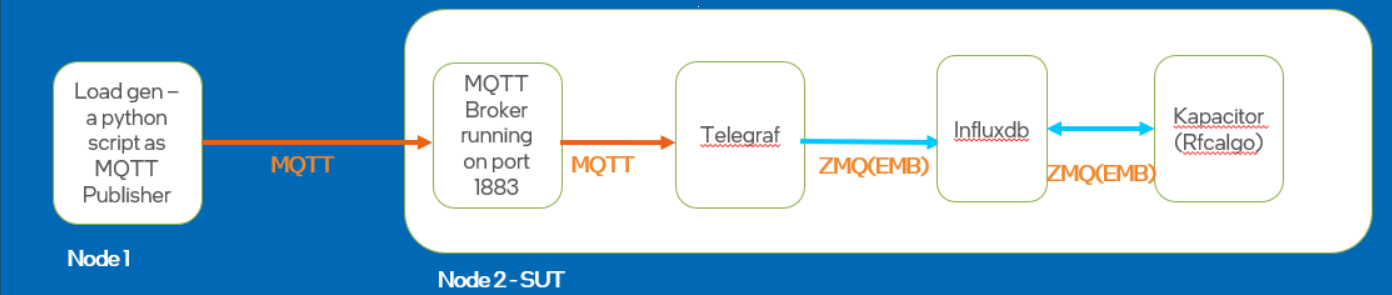
To publish the data, ensure the EII containers are up and running. Start the MQTT broker and run the publisher publisher.py(
[WORK_DIR]/IEdgeInsights/tools/mqtt/publisher/publisher.py), following are the steps:### High Level Diagram of Multi Node Setup

To run in multi node: Add the node IP with “no_proxy” value in the /etc/environment file. Logout and login once env updated. Remove “tools/mqtt/ia_mqtt_broker” from samples/services.yml and run broker in the bare metal.
To run MQTT publisher in single node and multi node: Run the MQTT publisher from publisher.py(
[WORK_DIR]/IEdgeInsights/tools/mqtt/publisher/publisher.py):python3 publisher.py --host <host-ip> --port <port> --topic "test/rfc_data" --json "./json_files/*.json" --streams <number-of-streams> --interval <time-interval> --service <service>
For example:
python3 publisher.py --host localhost --port "1883" --topic "test/rfc_data" --json "./json_files/*.json" --streams 1 --interval 0.1 --service "benchmarking"
5.The execution logs, performance logs, and the output.ppc are saved in TEST_DIR/output/< timestamp >/ so that the same test case is run multiple times without overwriting the output. You can see if the test has any errors in the execution.log, and you can see the results of a successful test in output.ppc.
The time-series profiler output file (named “avg_latency_Results.csv”) is stored in TEST_DIR/output/< timestamp >/.
Note
While running benchmarking tool with more than one stream, run **MQTT broker([WORK_DIR]/IEdgeInsights/tools/mqtt/broker/)* manually with multiple instances and add the MQTT consumers in **Telegraf telegraf.conf([WORK_DIR]/IEdgeInsights/Telegraf/config/Telegraf/config.json)* with ‘n’ number of streams based on the use case.